What's New
New features and notable improvements, by quarter. A complete list of improvements, bug fixes and smaller changes are in the Release Notes. For questions about leveraging any of these updates, please contact support.
Q4 2026
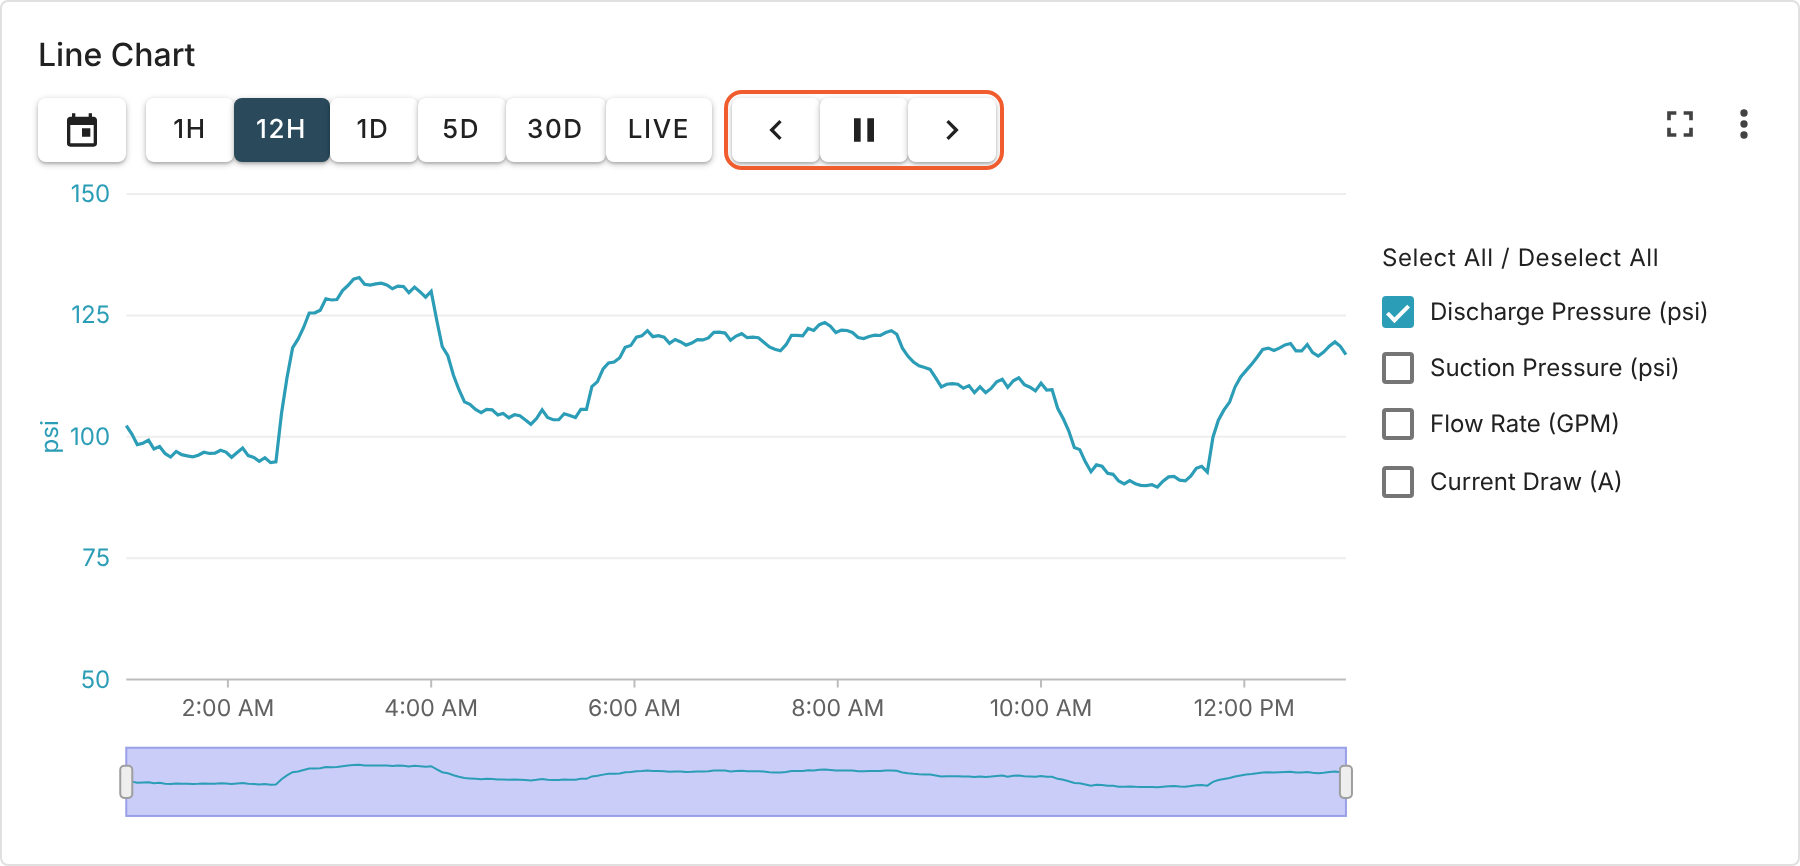
Step through time on charts
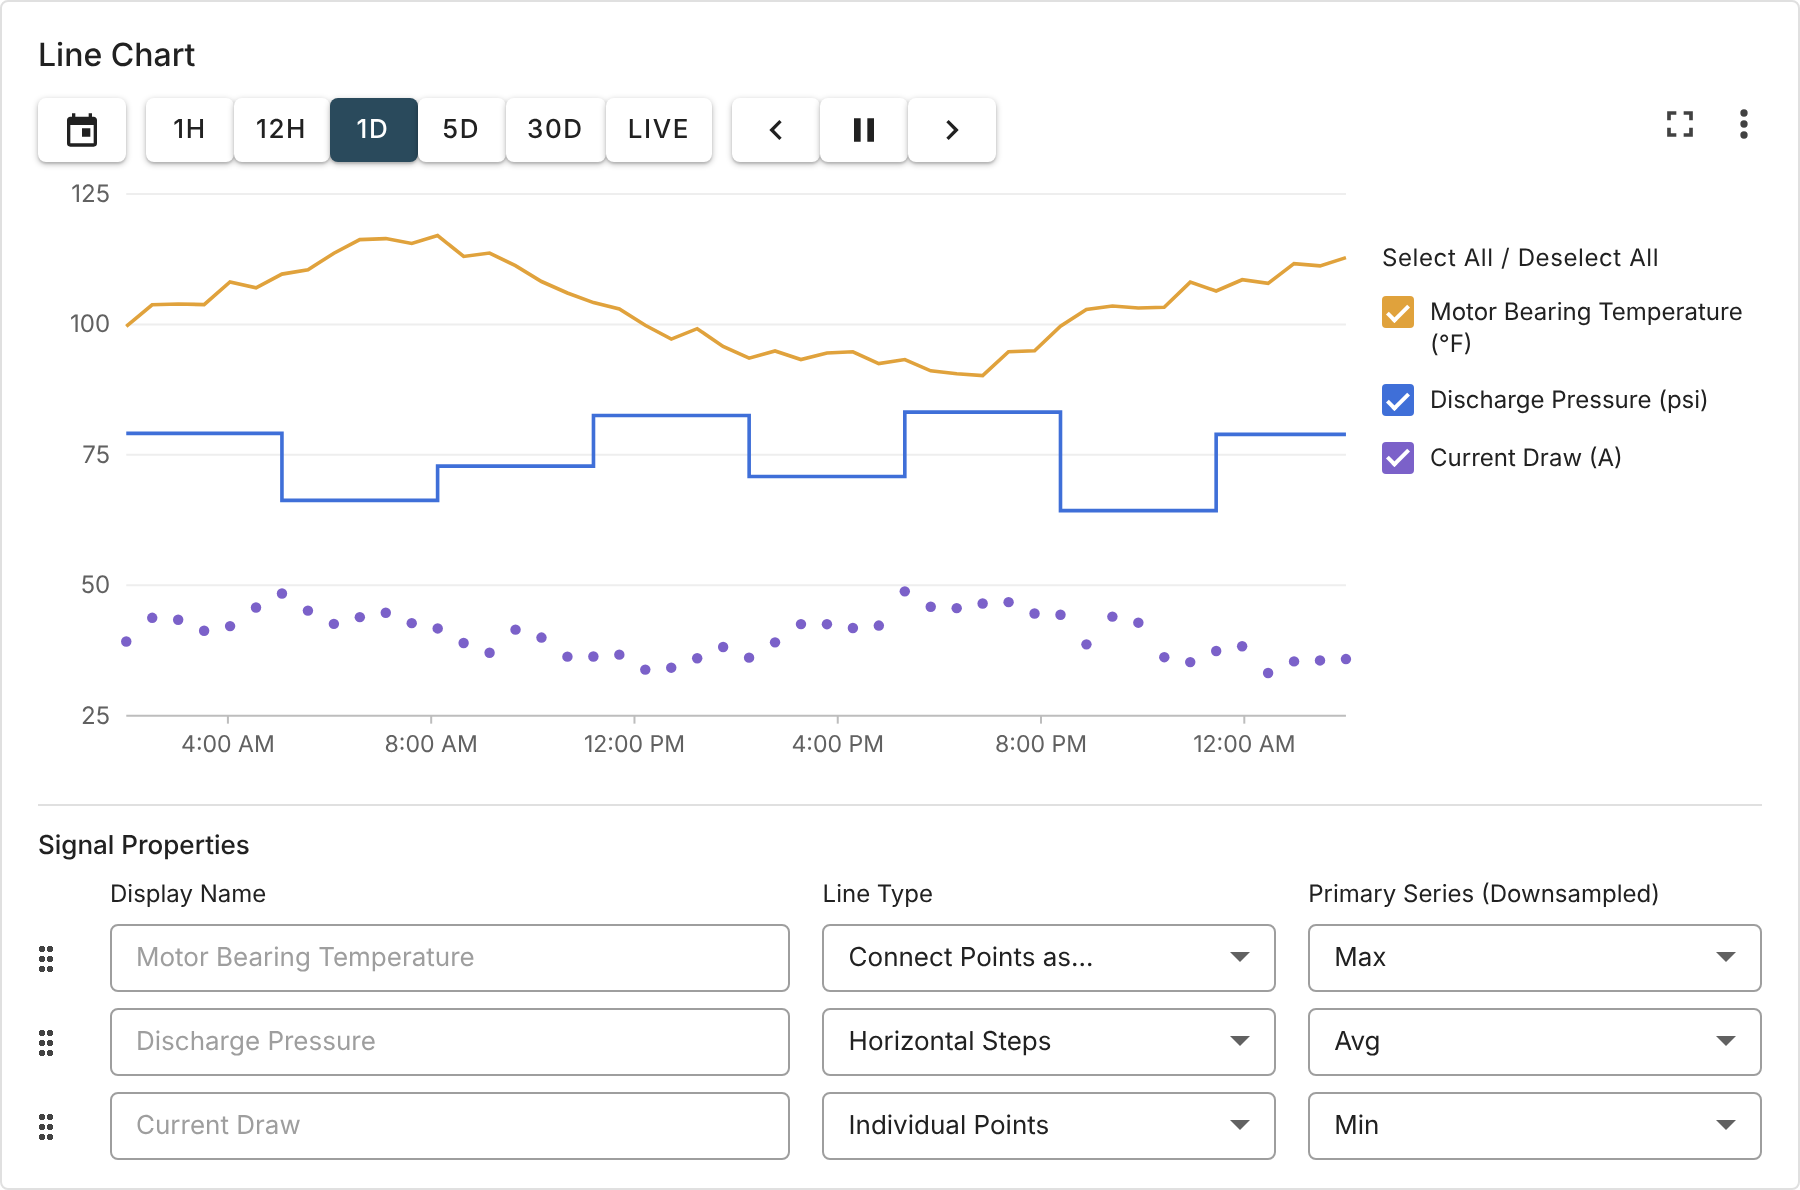
The Line Chart, Bar Chart, and Array Data panels have back and forward buttons on either side of the pause button that move the view one time period at a time, such as the previous 12 hours or the previous day.
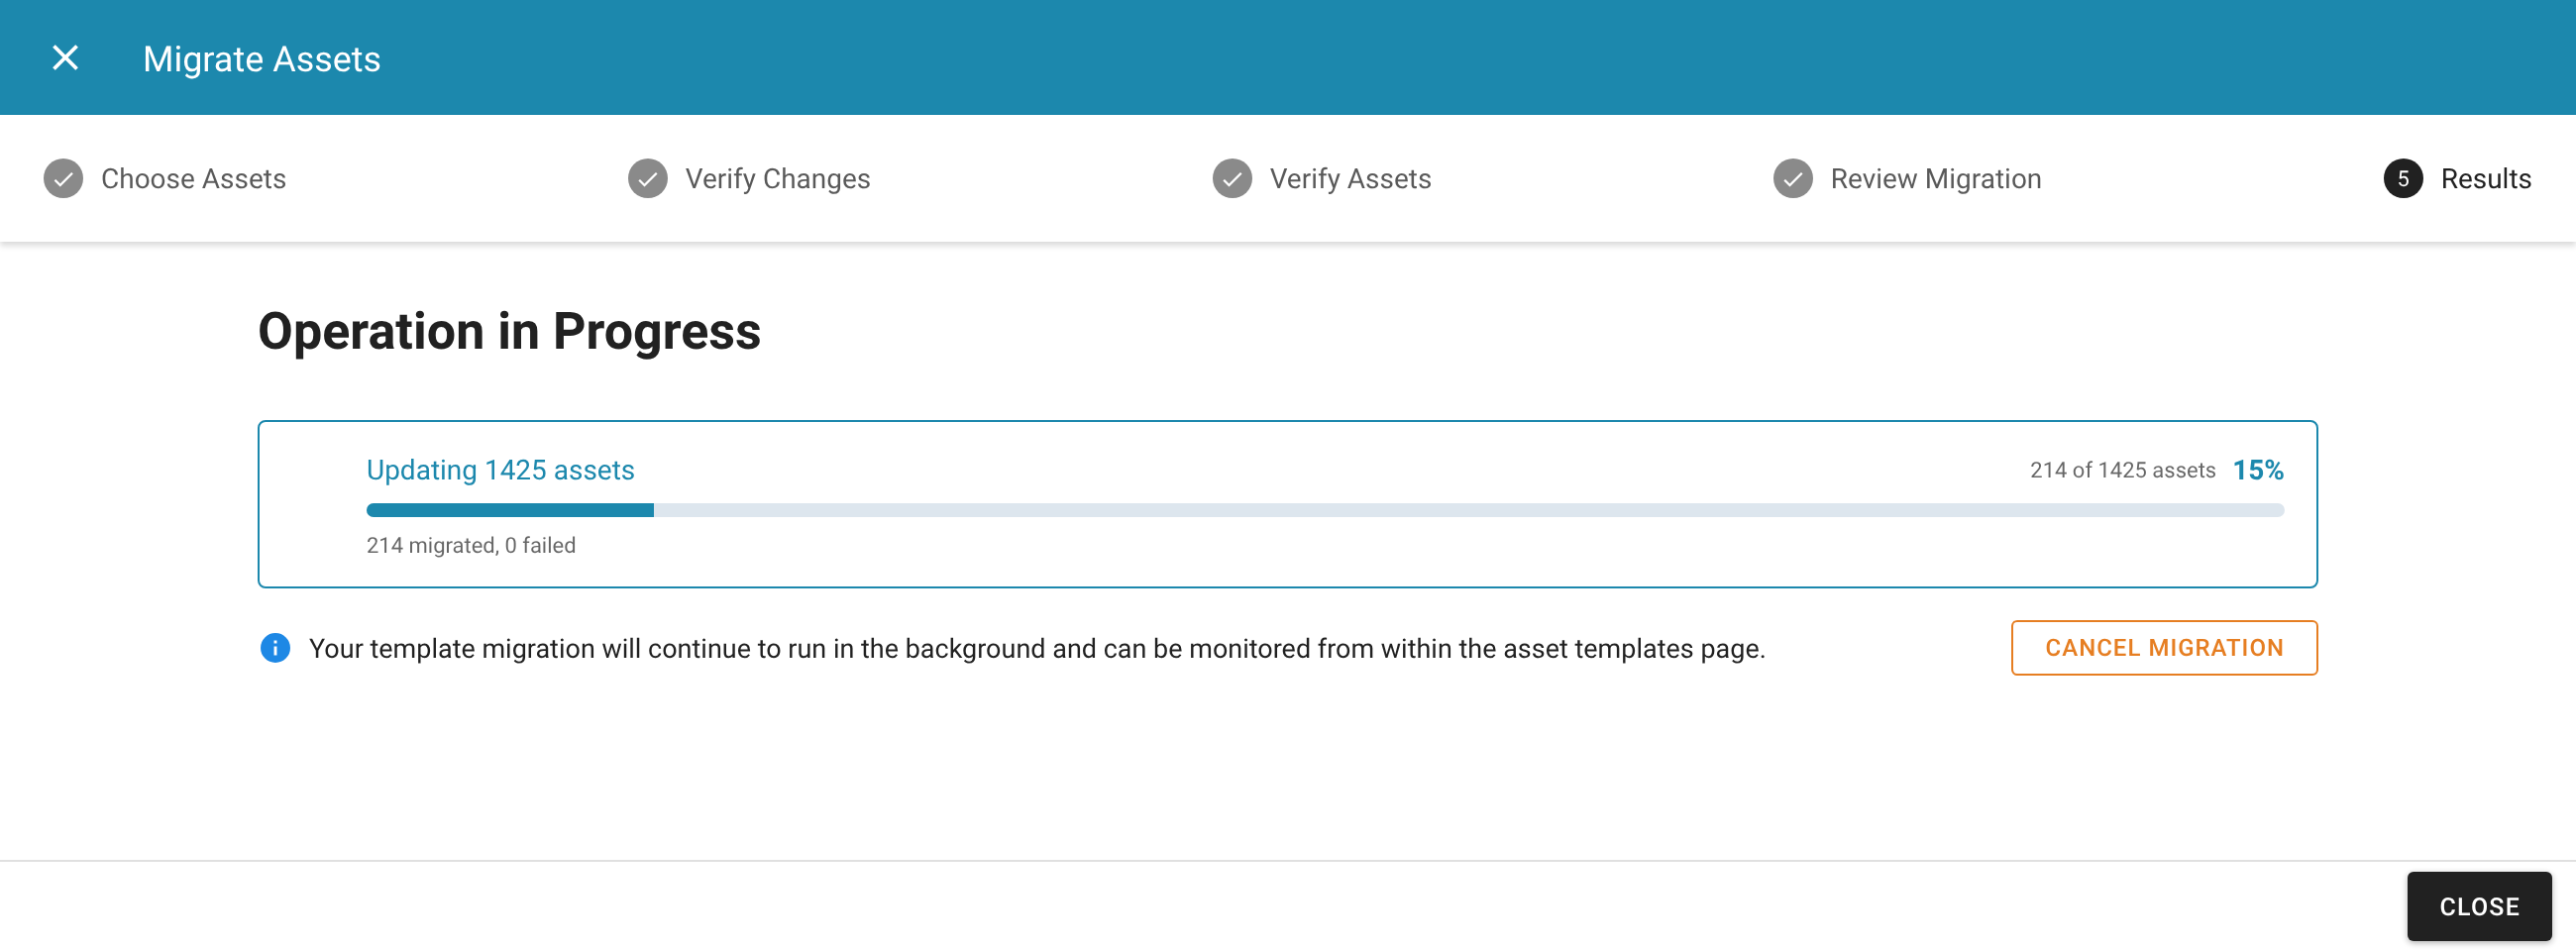
Template migrations run as background jobs
Moving assets to a new Asset Template version now runs as a job. A large migration keeps running after the dialog is closed, shows its progress, and is listed with its results on the template's Migrations tab.
Q3 2026
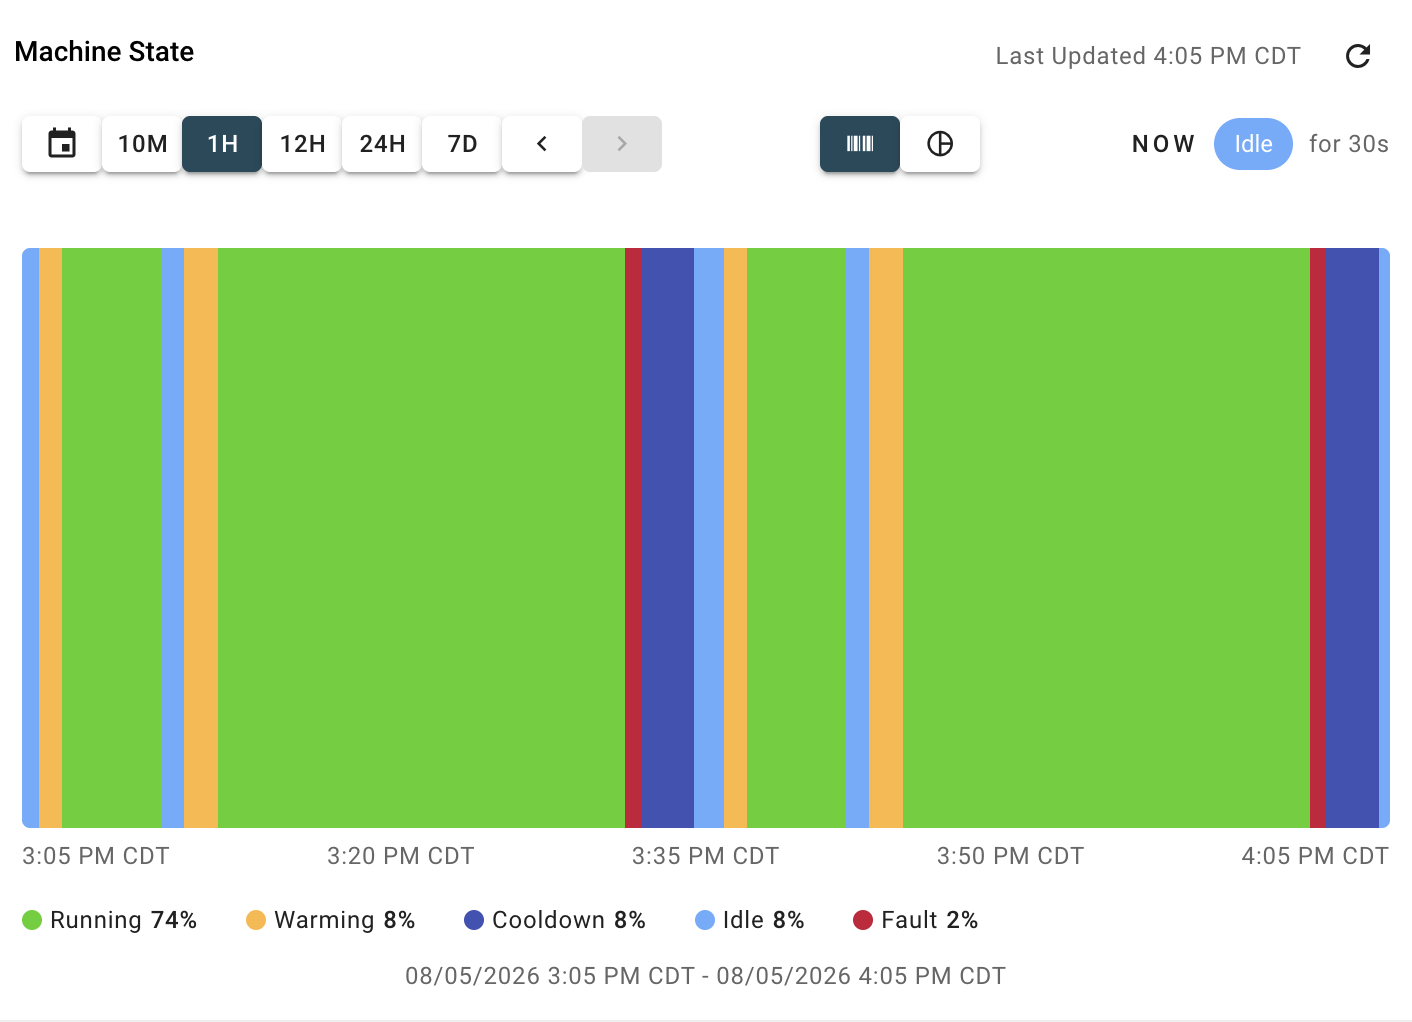
State Timeline panel
A dashboard panel that shows how long an asset spent in each state as a colored timeline, with a time and percentage summary. States can come from a signal value, a rule status, or the asset status.
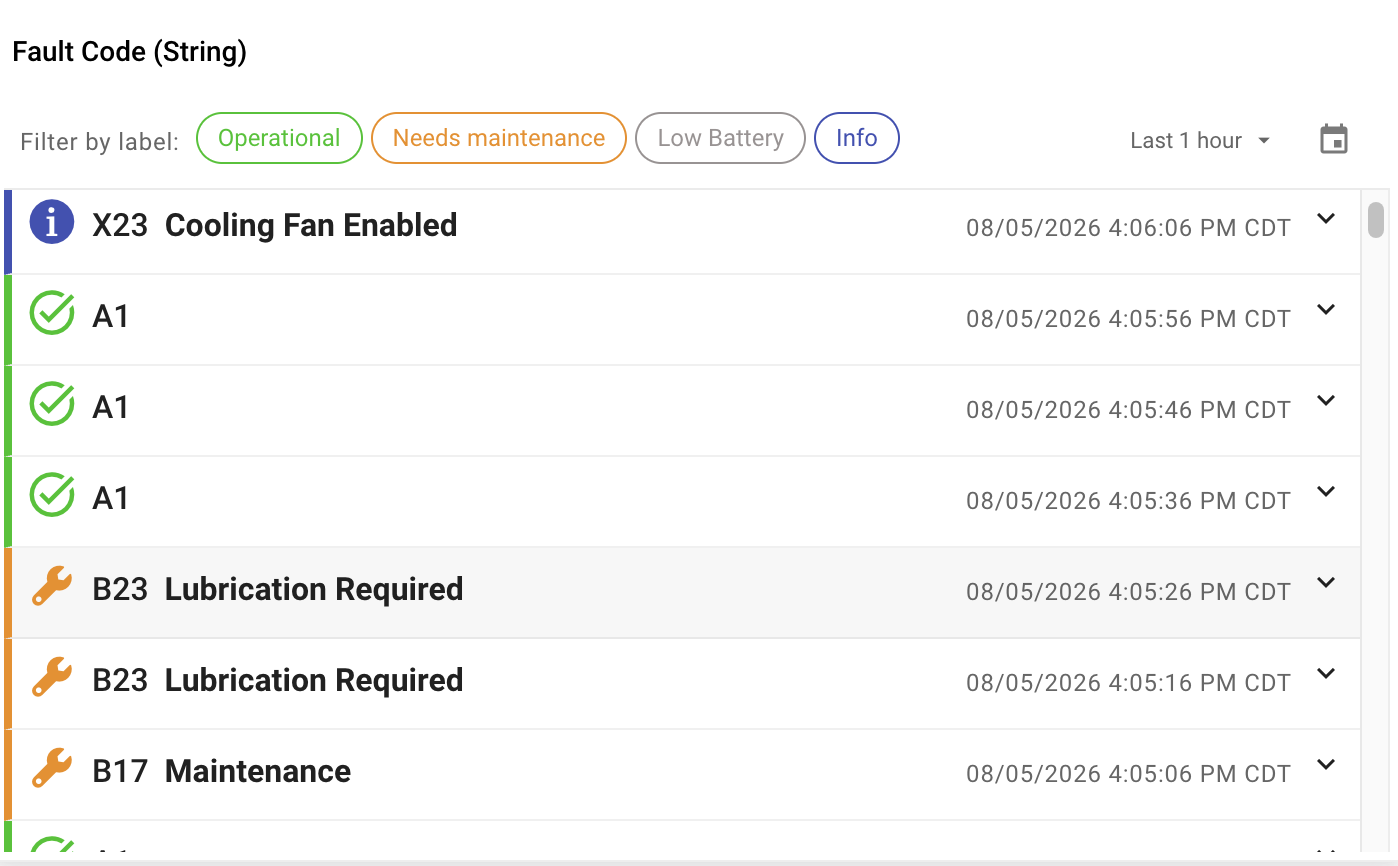
Configurable Signal Log panel
A scrollable log of a signal's values where each value can be given its own name, label, color, and icon. It suits fault codes, status codes, and other categorical data.
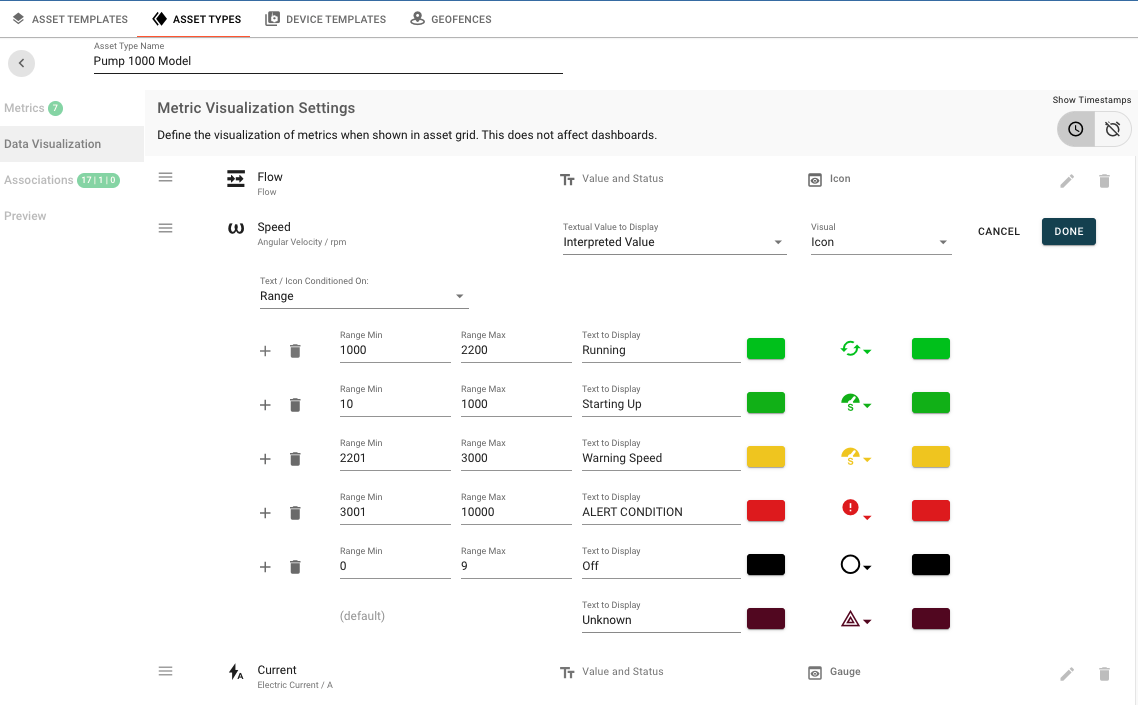
Asset Type metric matching
Asset Type metrics can match signals by full name instead of "contains", or by an Asset Template Key. A metric can also show the signal value next to its interpreted text or icon in the asset grid.
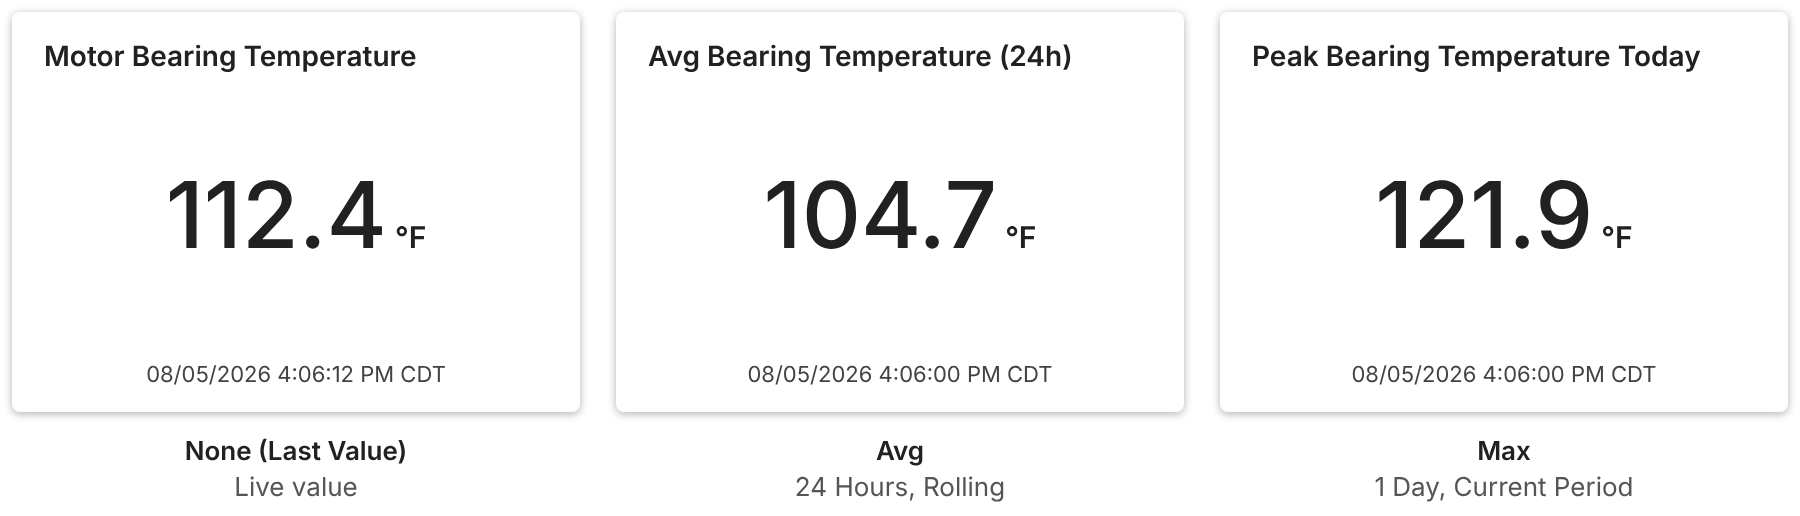
Current Value panel aggregation
The Current Value panel can show an average, minimum, maximum, count, sum, or difference over a time window instead of the last value. The window can be rolling, such as the last 24 hours, or the current period, such as today so far.
- User roles have separate permissions for Asset Type Management, Notifications, Reports, and Asset Information, so each can be granted without full Asset Management. See Role Permissions.
- The Data Table panel has Count, Sum, and Diff column functions.
- Exporting from a zoomed Line Chart exports the zoomed view.
Q2 2026
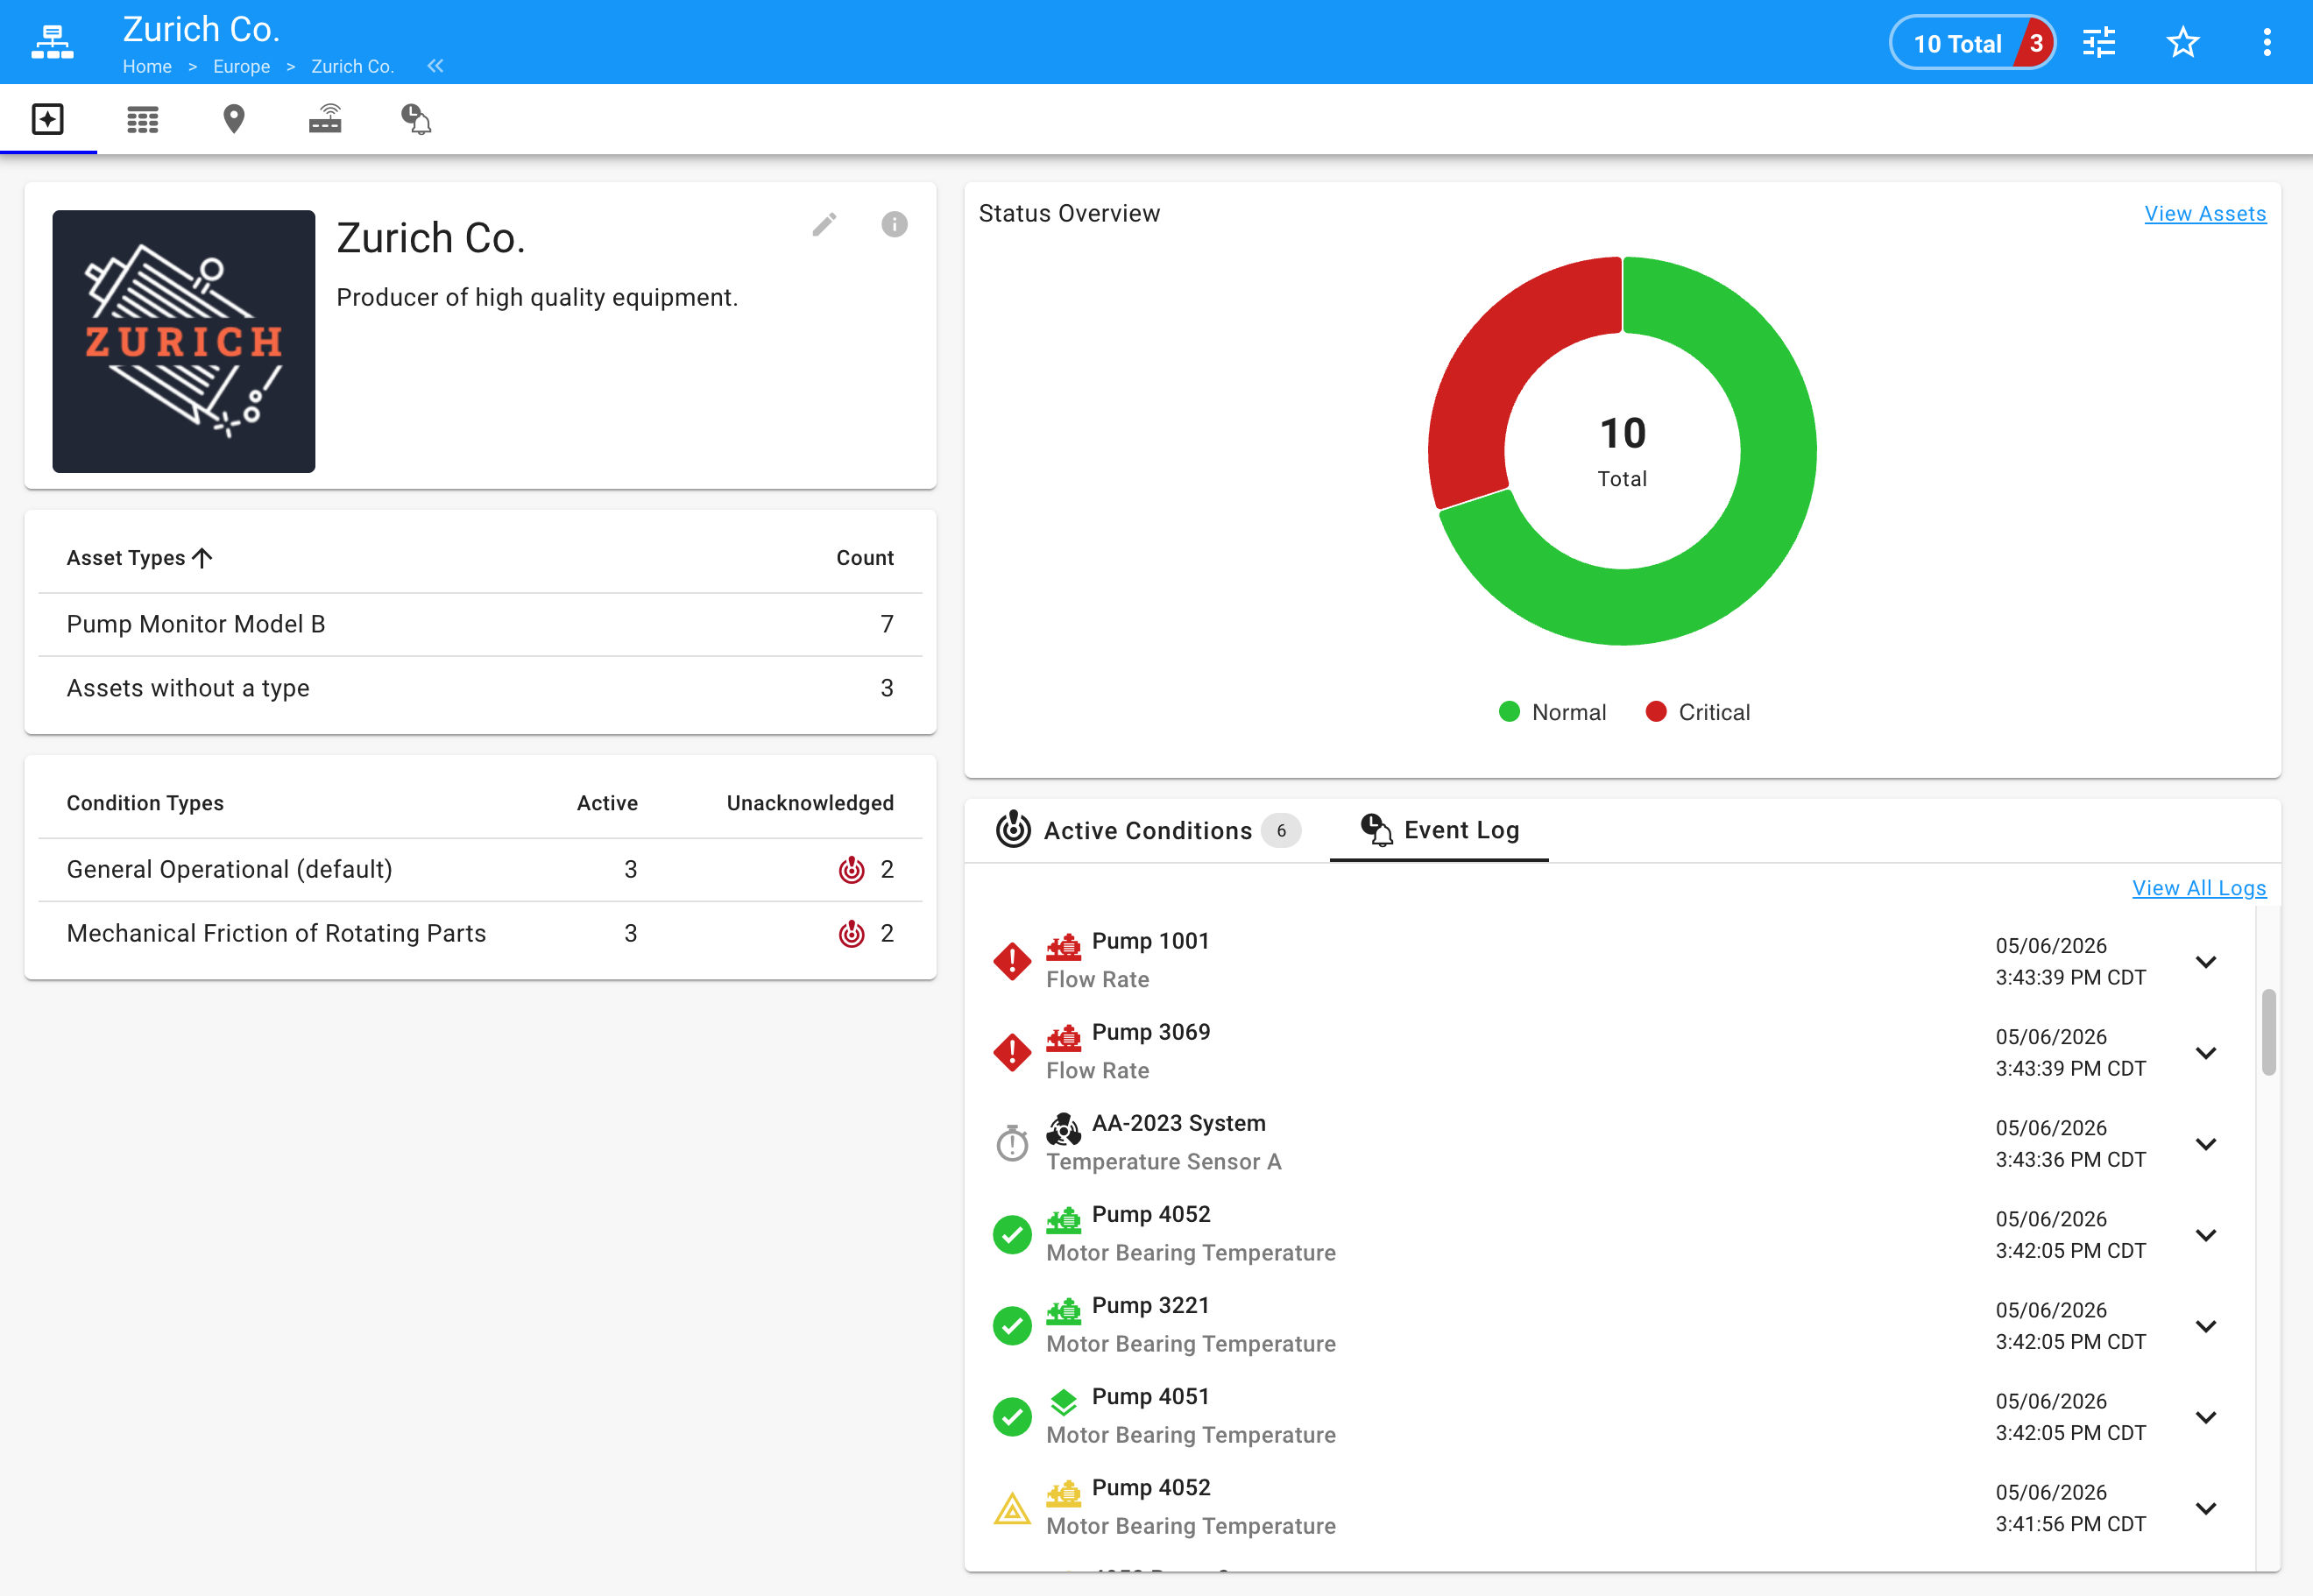
Group Info tab
A summary page for a group: asset status totals, active conditions, a recent event log, and asset counts by type. Administrators turn it on per solution.
Hysteresis on threshold rules
A threshold rule can require the value to move a set amount back past the threshold before the state clears. This stops a rule from switching back and forth when a value sits near its limit.

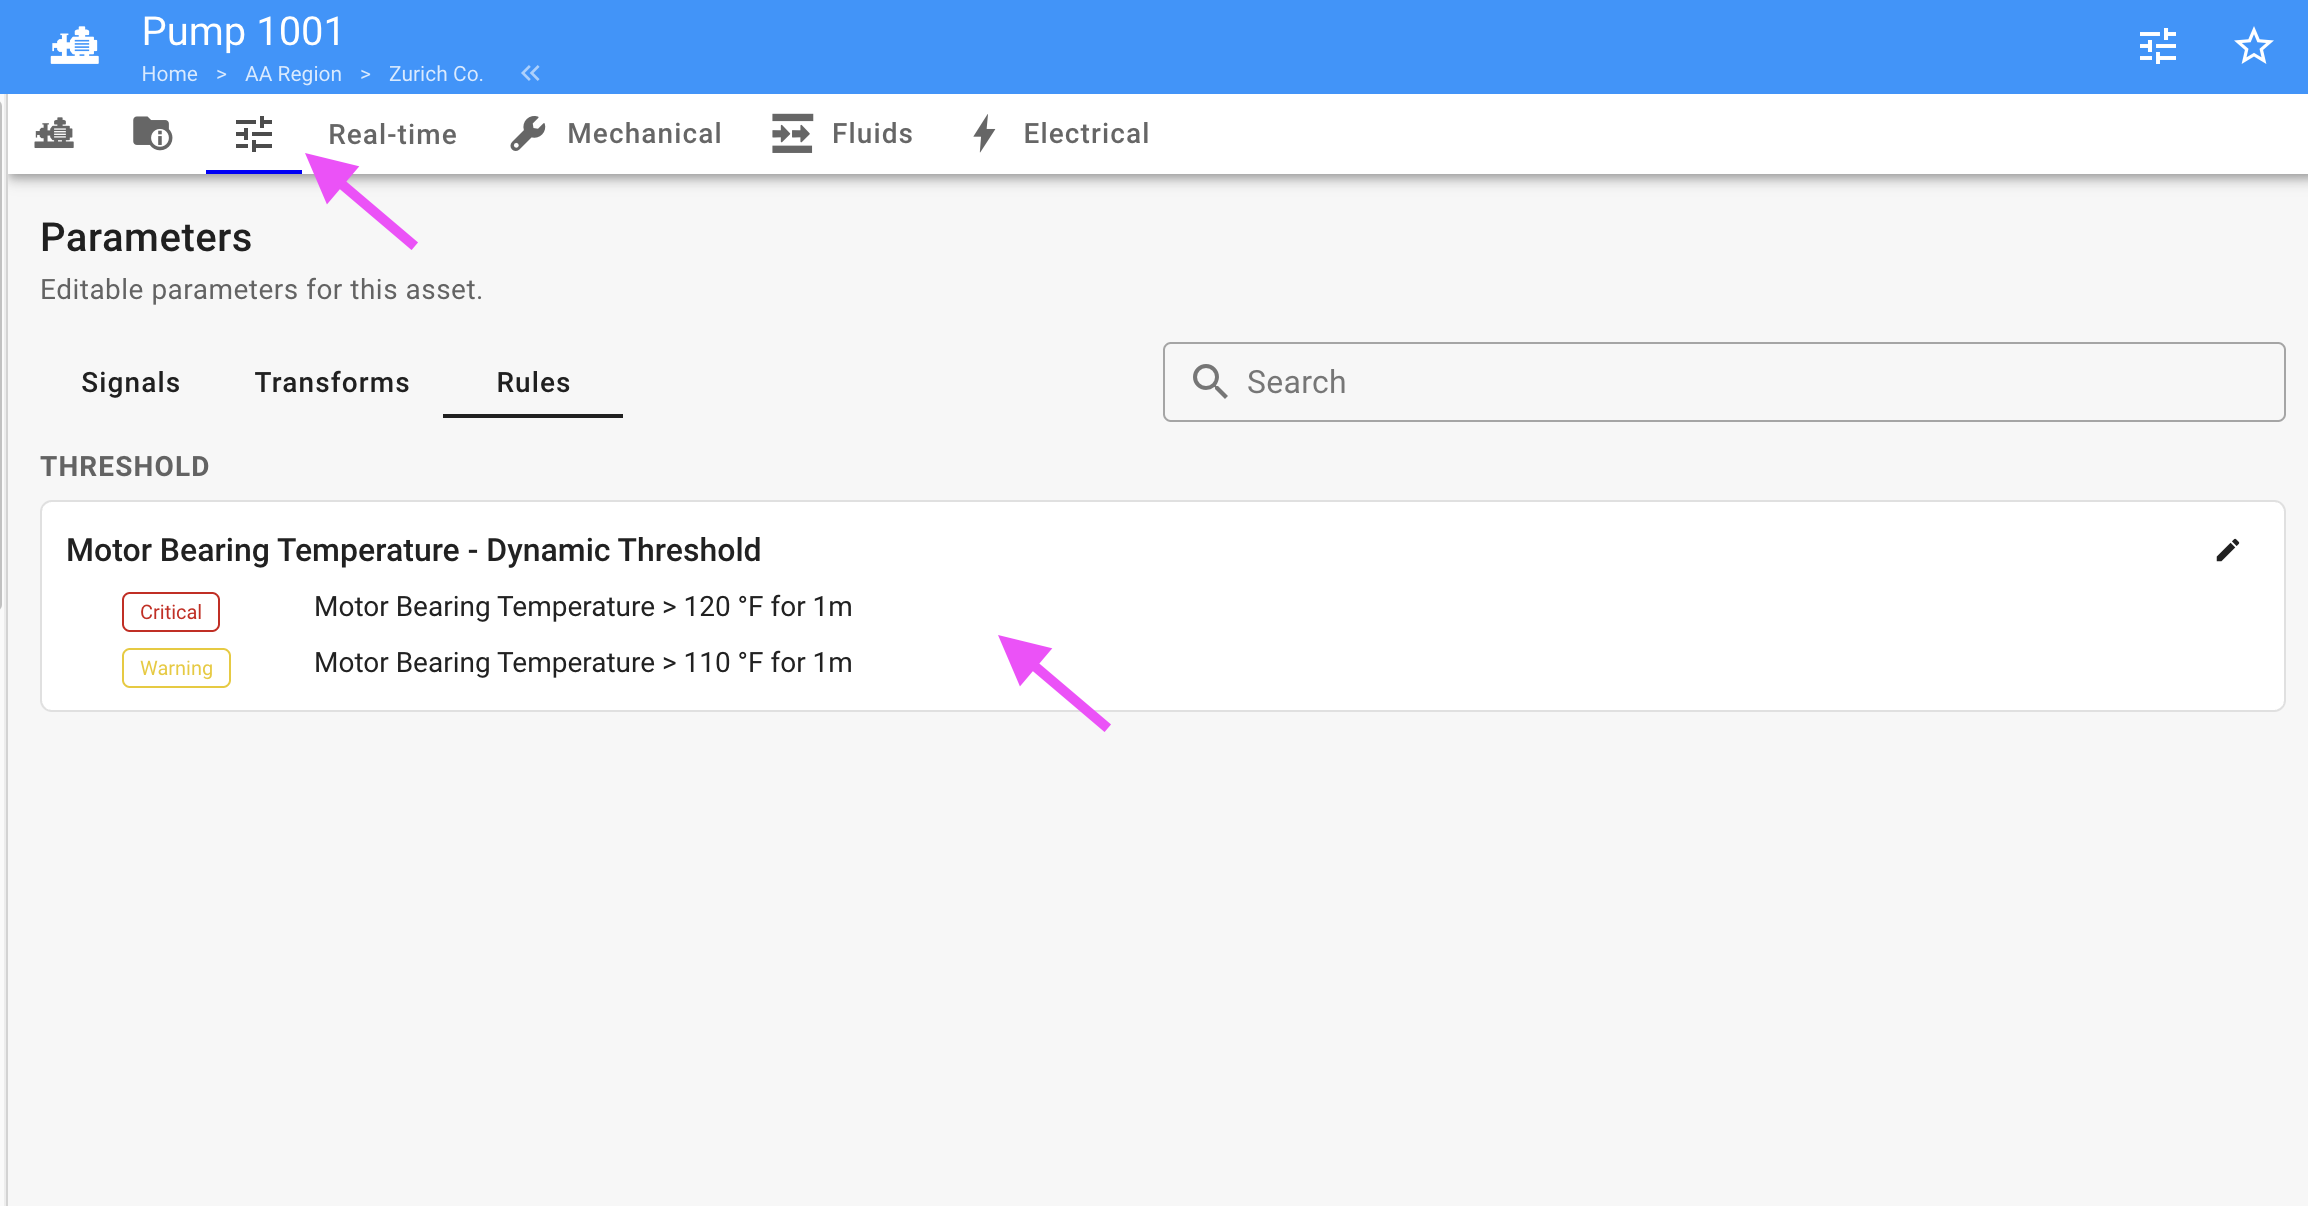
Asset Template Parameter Overrides
Template managers can expose chosen signal, transform, and rule properties, such as a threshold value, so users can change them on a linked asset from a Parameters tab without the Asset Manager permission. This is an early access feature, available by request.
Line Chart series options
Each signal on a Line Chart can be drawn as connected lines, steps, or individual points. When a long time range is down-sampled, each signal can plot the minimum, maximum, or average for each period, so peaks are not averaged away.
Group icons
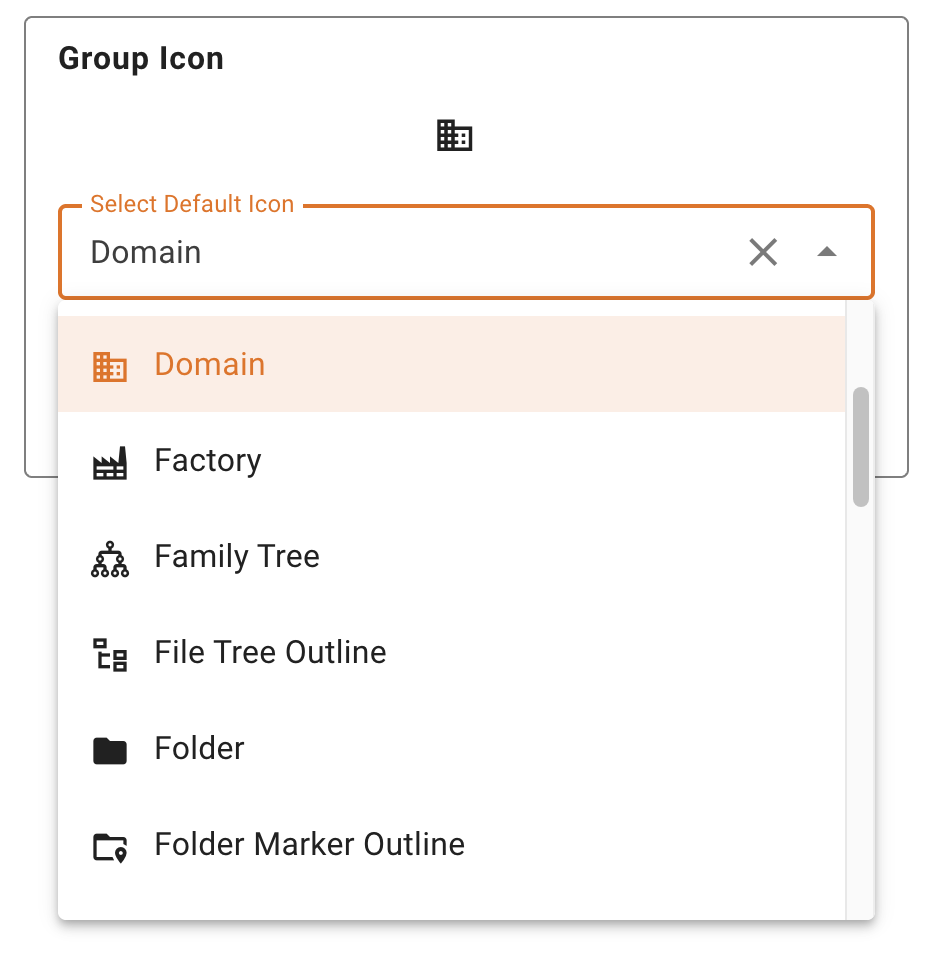
Groups can have their own icon in the side navigation, with a default set for the whole solution. Subgroups and assets also line up more clearly under their parent group.
- URL metadata can show a name instead of the address and can link to another page inside ExoSense. See URL metadata formats.
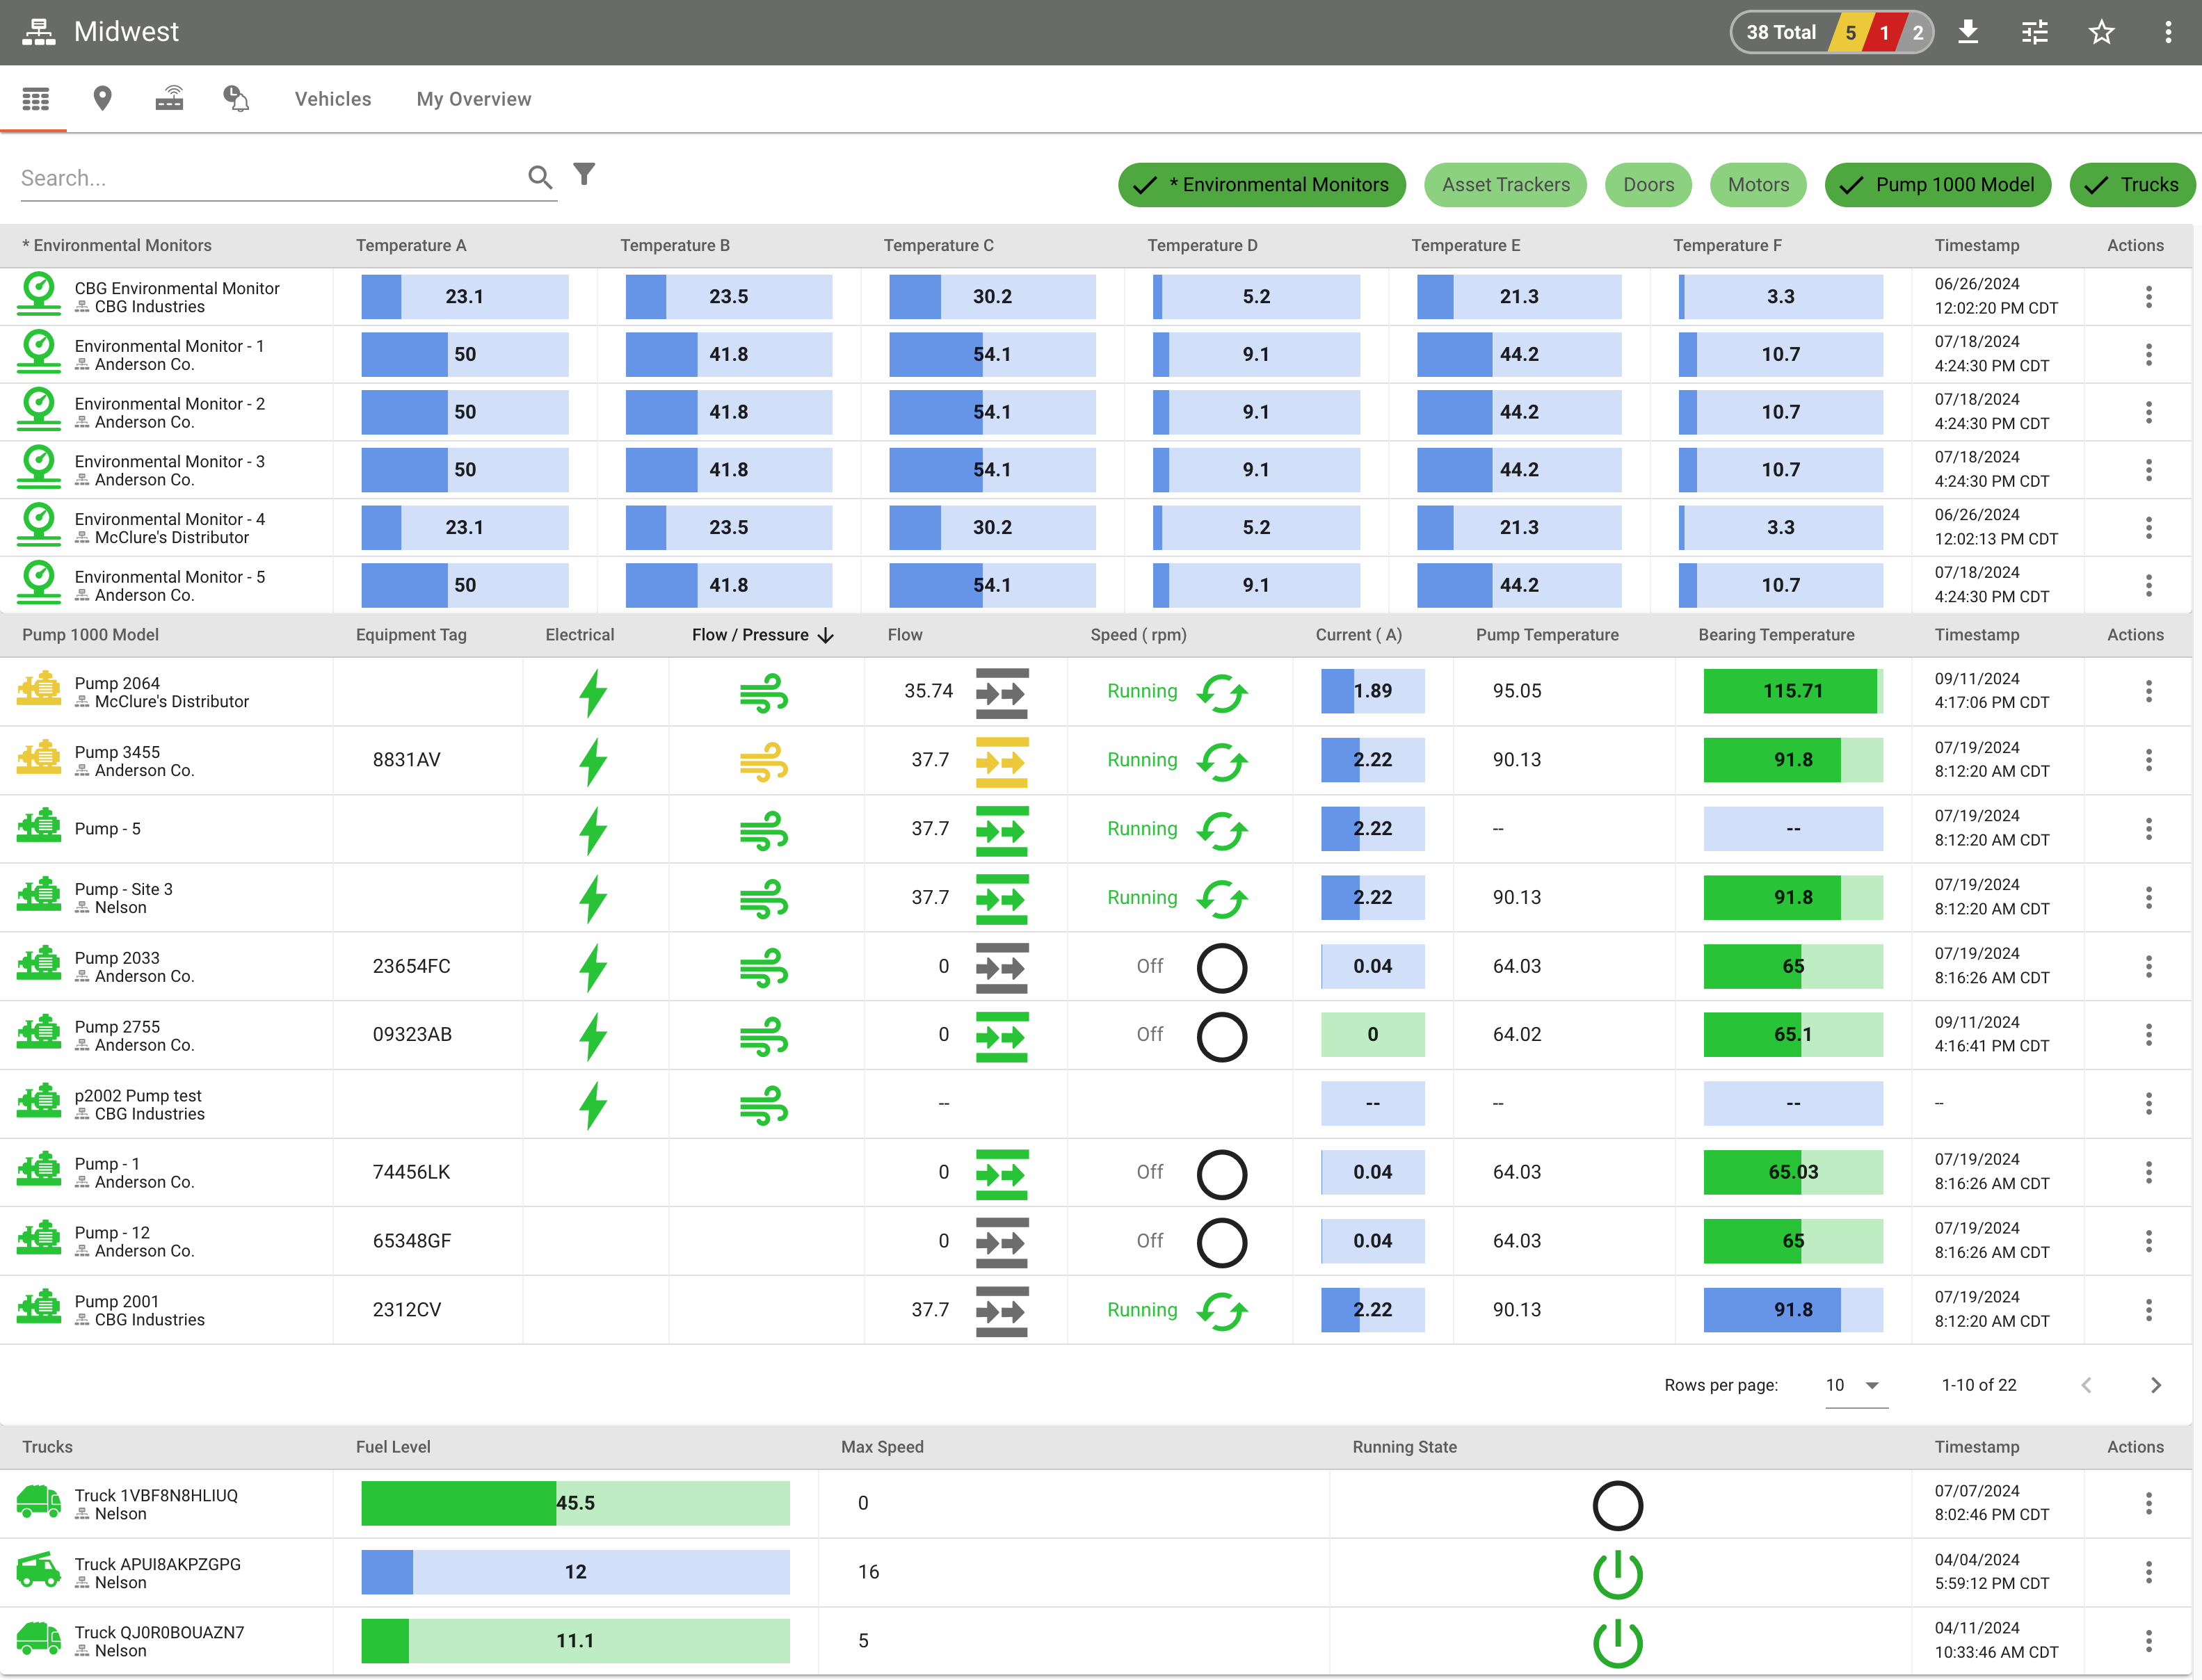
- An asset that has never reported data is shown the same way as an asset in timeout (gray) in the asset grid and side navigation.
- The Line Chart and Gauge panels use a signal's Min and Max properties when auto-scaling.
- Milli Standard Gravity is available as an acceleration unit.
Q1 2026
Search metadata in the asset grid
Search in a group's asset grid also matches the metadata columns, so assets can be found by values such as a serial number, model, or customer site.
Unclaim devices in the UI
Devices can be unclaimed from within ExoSense, with an option to disconnect the asset signals that use the device at the same time.
- Inline Insight functions have Live, Draft, and Locked modes to control whether a function can be added to assets or edited. See Inline Insight functions.
- The Activity Log records device control use and Asset Template actions.
- Adding, moving, and claiming devices and assets is faster in solutions with many devices, assets, and groups, as is the group status roll-up in the header.
Q4 2025
Current Value panel interpretation
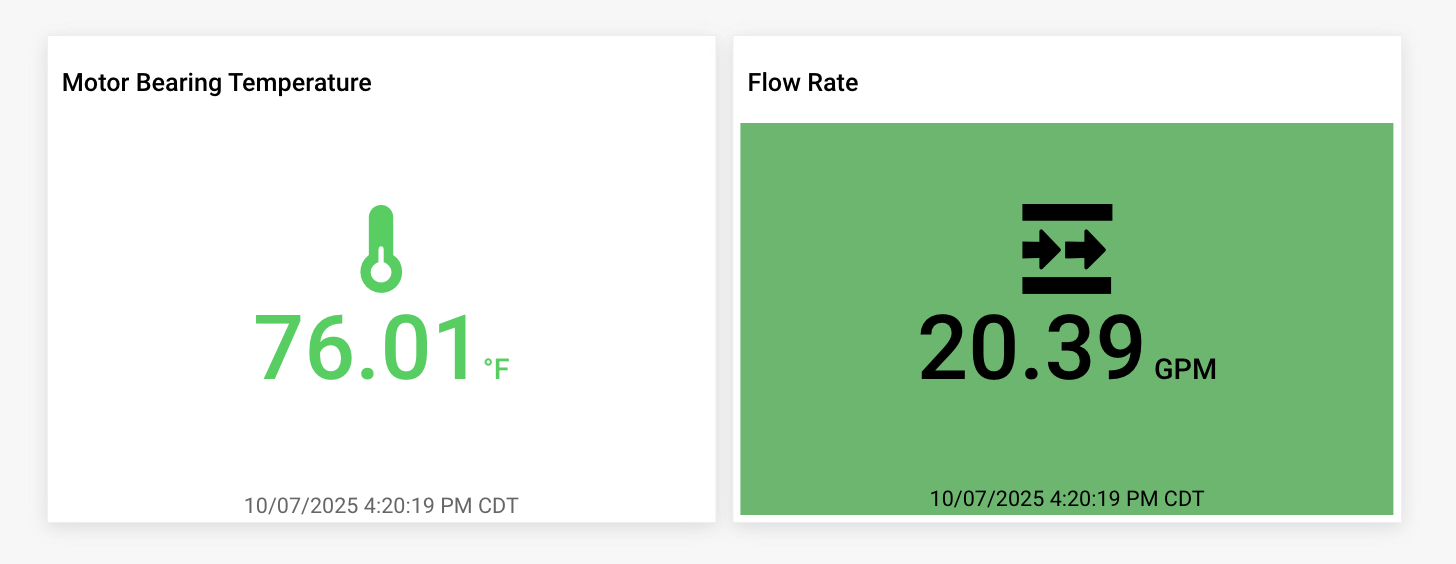
The Current Value panel can show custom text, icons, images, and background colors based on a value, a range, or a rule status.
- On Change Filter transforms pass a value on only when it changes, for number, boolean, and string signals. See On Change Filters.
- A dashboard can hold up to 20 panels.
- More asset icons are available.
Q3 2025
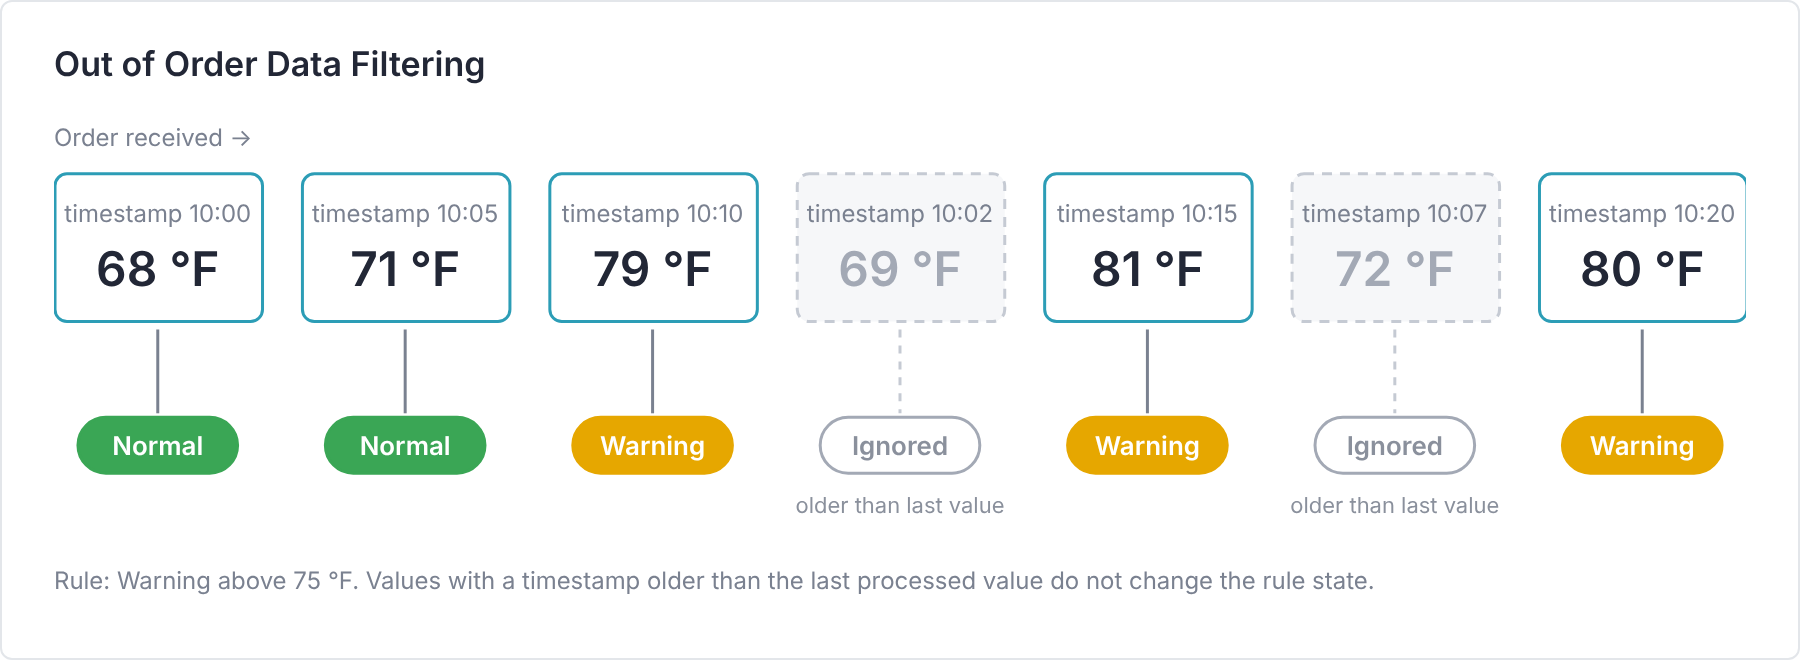
Out of Order Data Filtering for rules
Rules can ignore values that arrive with a timestamp older than the last value processed. Devices that send recorded data out of order no longer cause incorrect rule states or notifications. It is on by default for new rules.
Asset breadcrumbs
An optional breadcrumb under the asset name shows the asset's group path and links to each group.

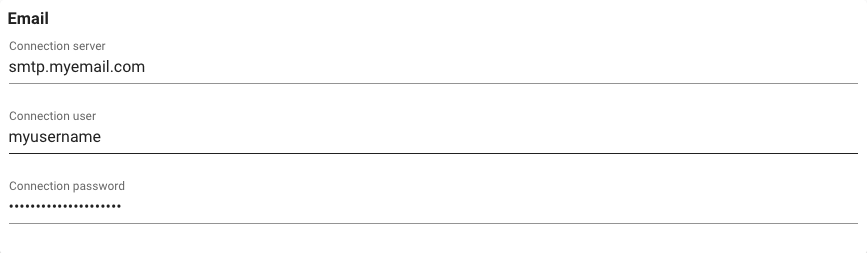
Custom email domain and senders
Administrators can send invites, notifications, and reports from their own email server and addresses, and send a test email from each sender address to check the setup.
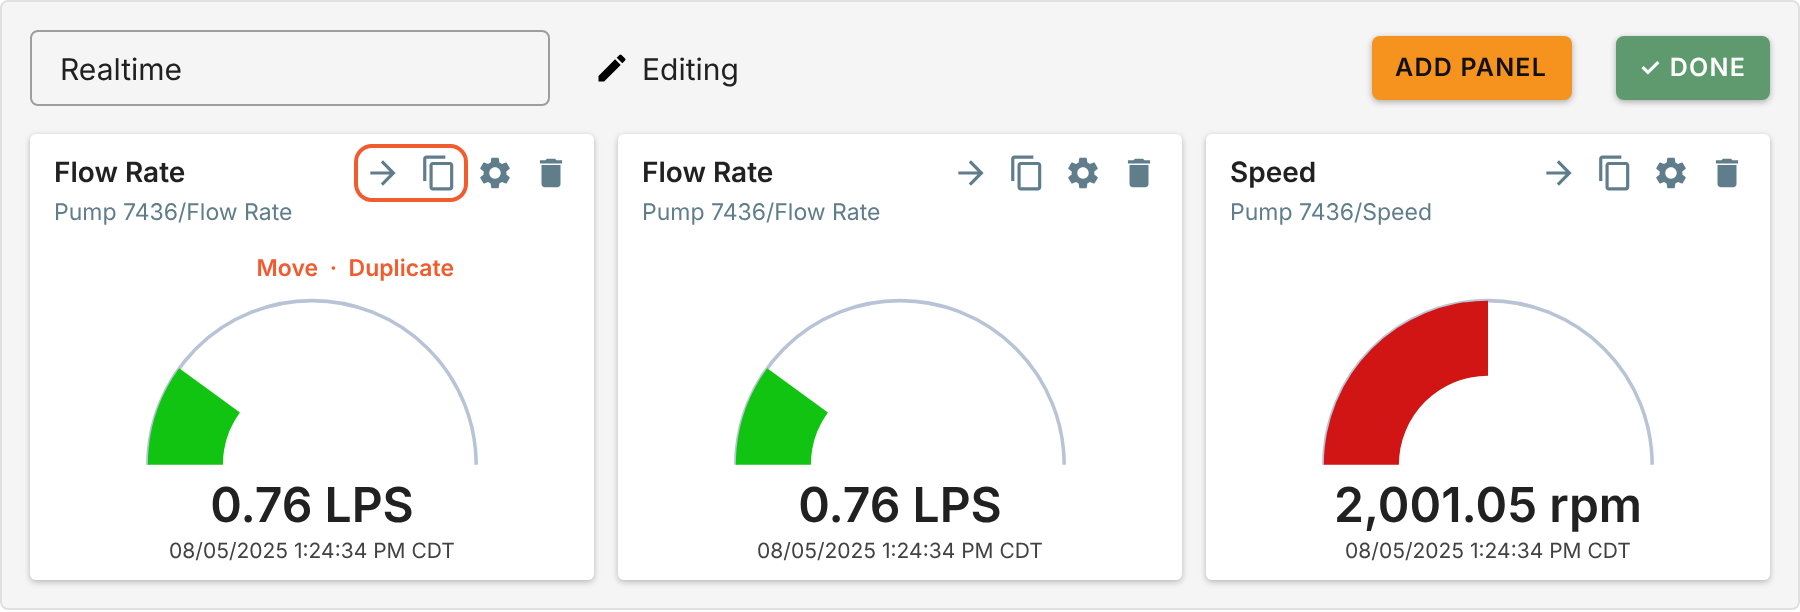
Duplicate and move dashboard panels
In dashboard edit mode, each panel has buttons to duplicate it on the same dashboard or move it to another dashboard of the same asset or group.
- Assets can be duplicated with the new asset creation workflow.
- New icons are available for the Key Indicator panel, dashboard tabs, subsystems, and asset grid visualizations.
- The side navigation can collapse and expand automatically, and closes after a selection on mobile.
Q2 2025
Notification Lists
Notification Lists replaced the earlier notifications interface. A user can keep several lists, each with its own assets or whole groups, filters, and choice of email, SMS, or both.

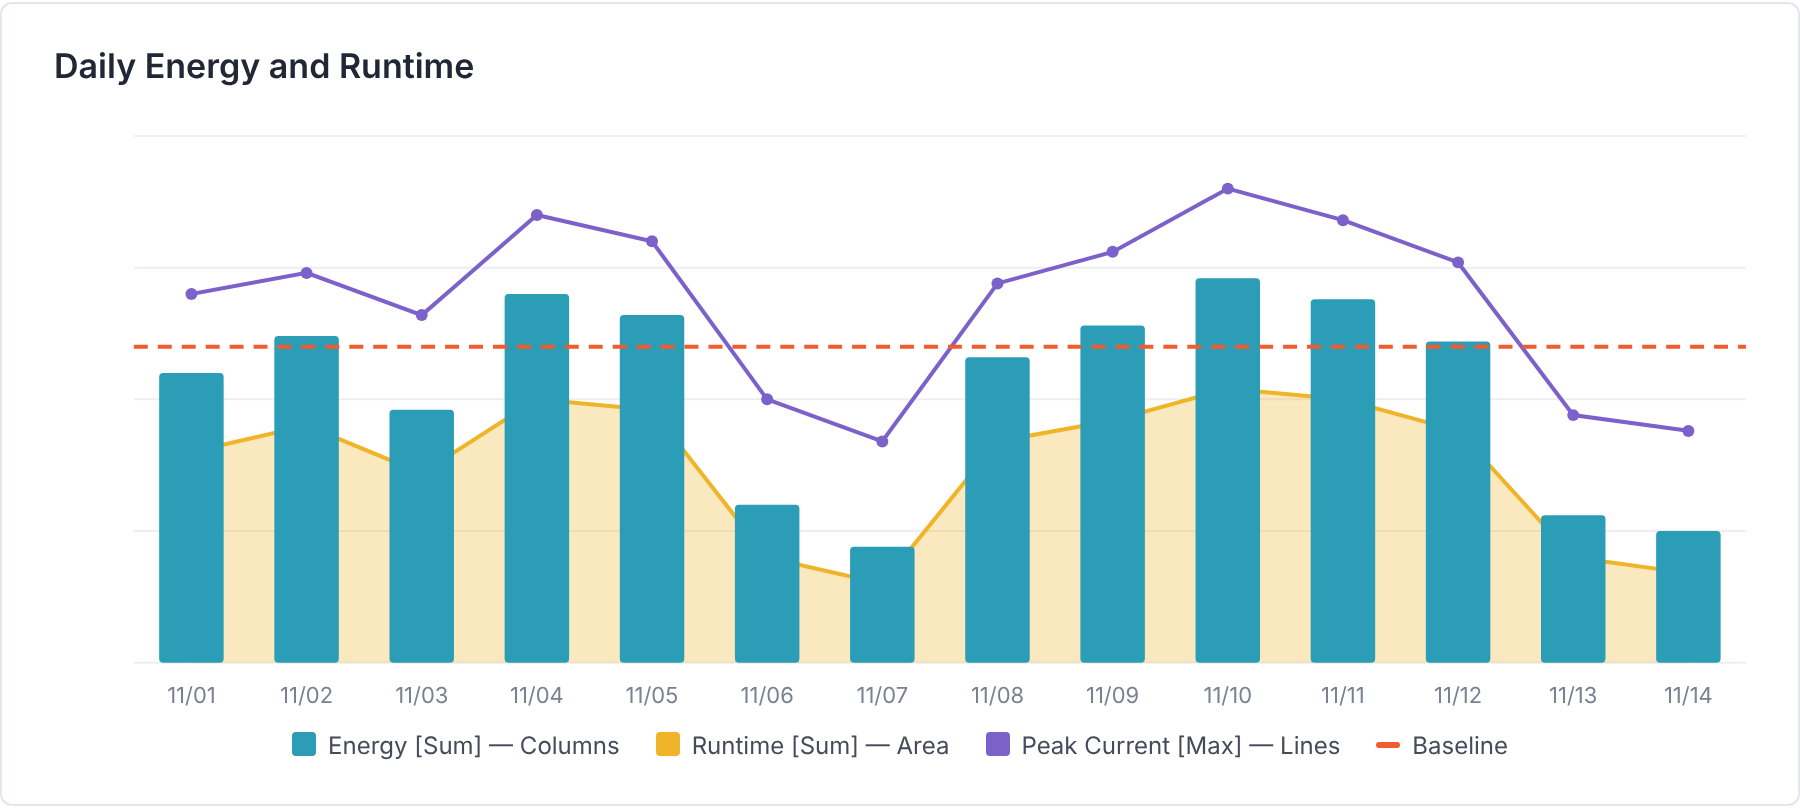
Bar Chart series types and baseline
Each series on a Bar Chart can be drawn as columns, an area, lines, steps, or points, and the chart can show a fixed baseline. A chart holds up to 10 series.
Q1 2025
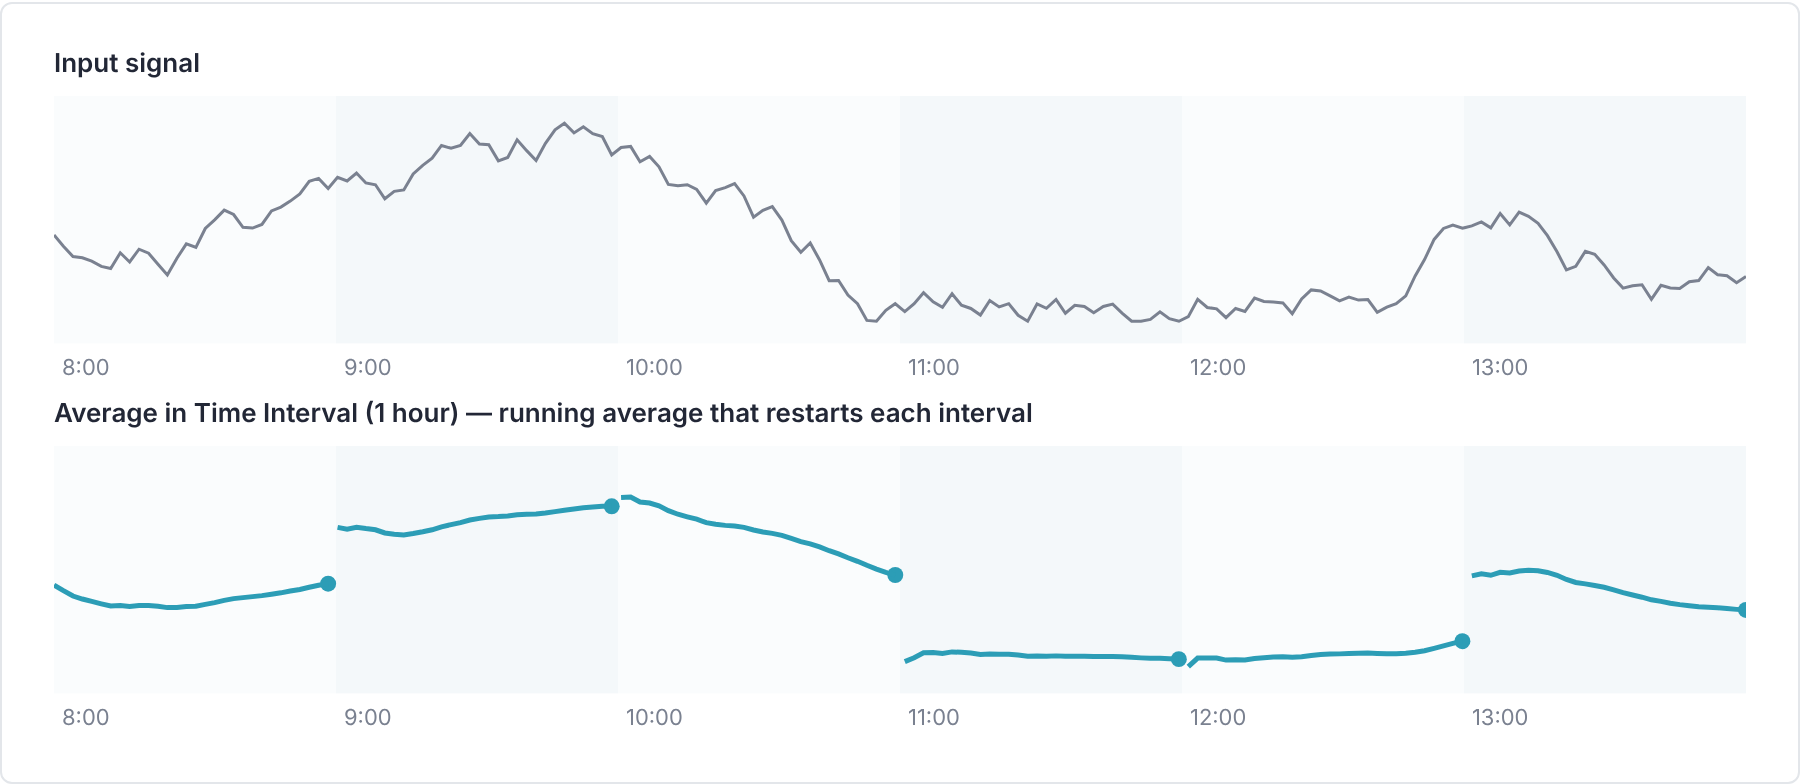
Windowed transforms
Transforms that calculate a count, minimum, maximum, sum, average, or standard deviation over a time interval, such as each hour.
Notification Templates
Administrators can customize the email and SMS messages ExoSense sends, with a version for each language. Notification Templates were first released in 2024 and became part of the Scale tier in March 2025.


Template Asset Overrides
On an asset linked to a template, Asset Managers can change signal properties such as the name, and transform and rule settings such as a threshold value. The changes stay in place when the asset moves to a new template version. Included in the Professional and Scale tiers since March 2025.

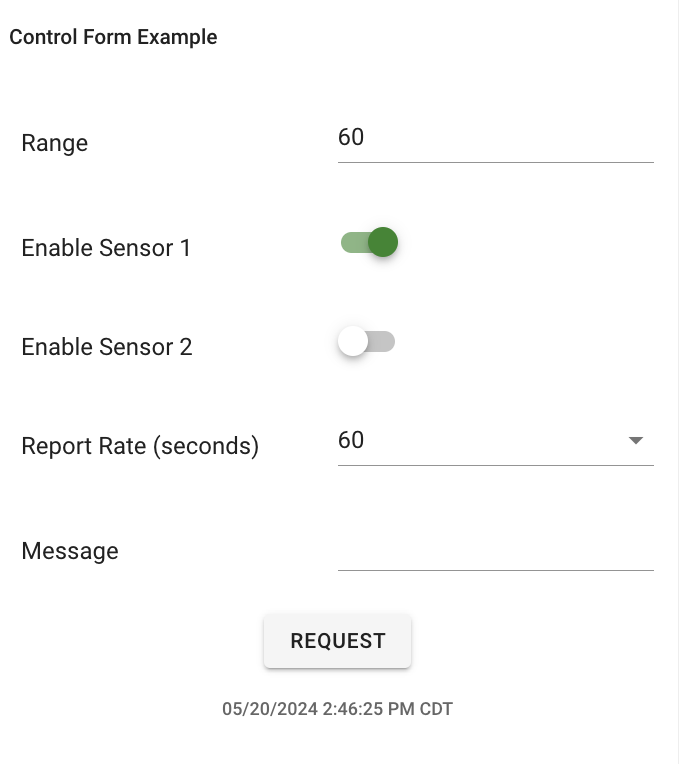
Control Form panel
A dashboard panel with a configurable form of value fields, ranges, lists, and switches that sends the values to a device as one control message. Included in the Professional and Scale tiers since March 2025.
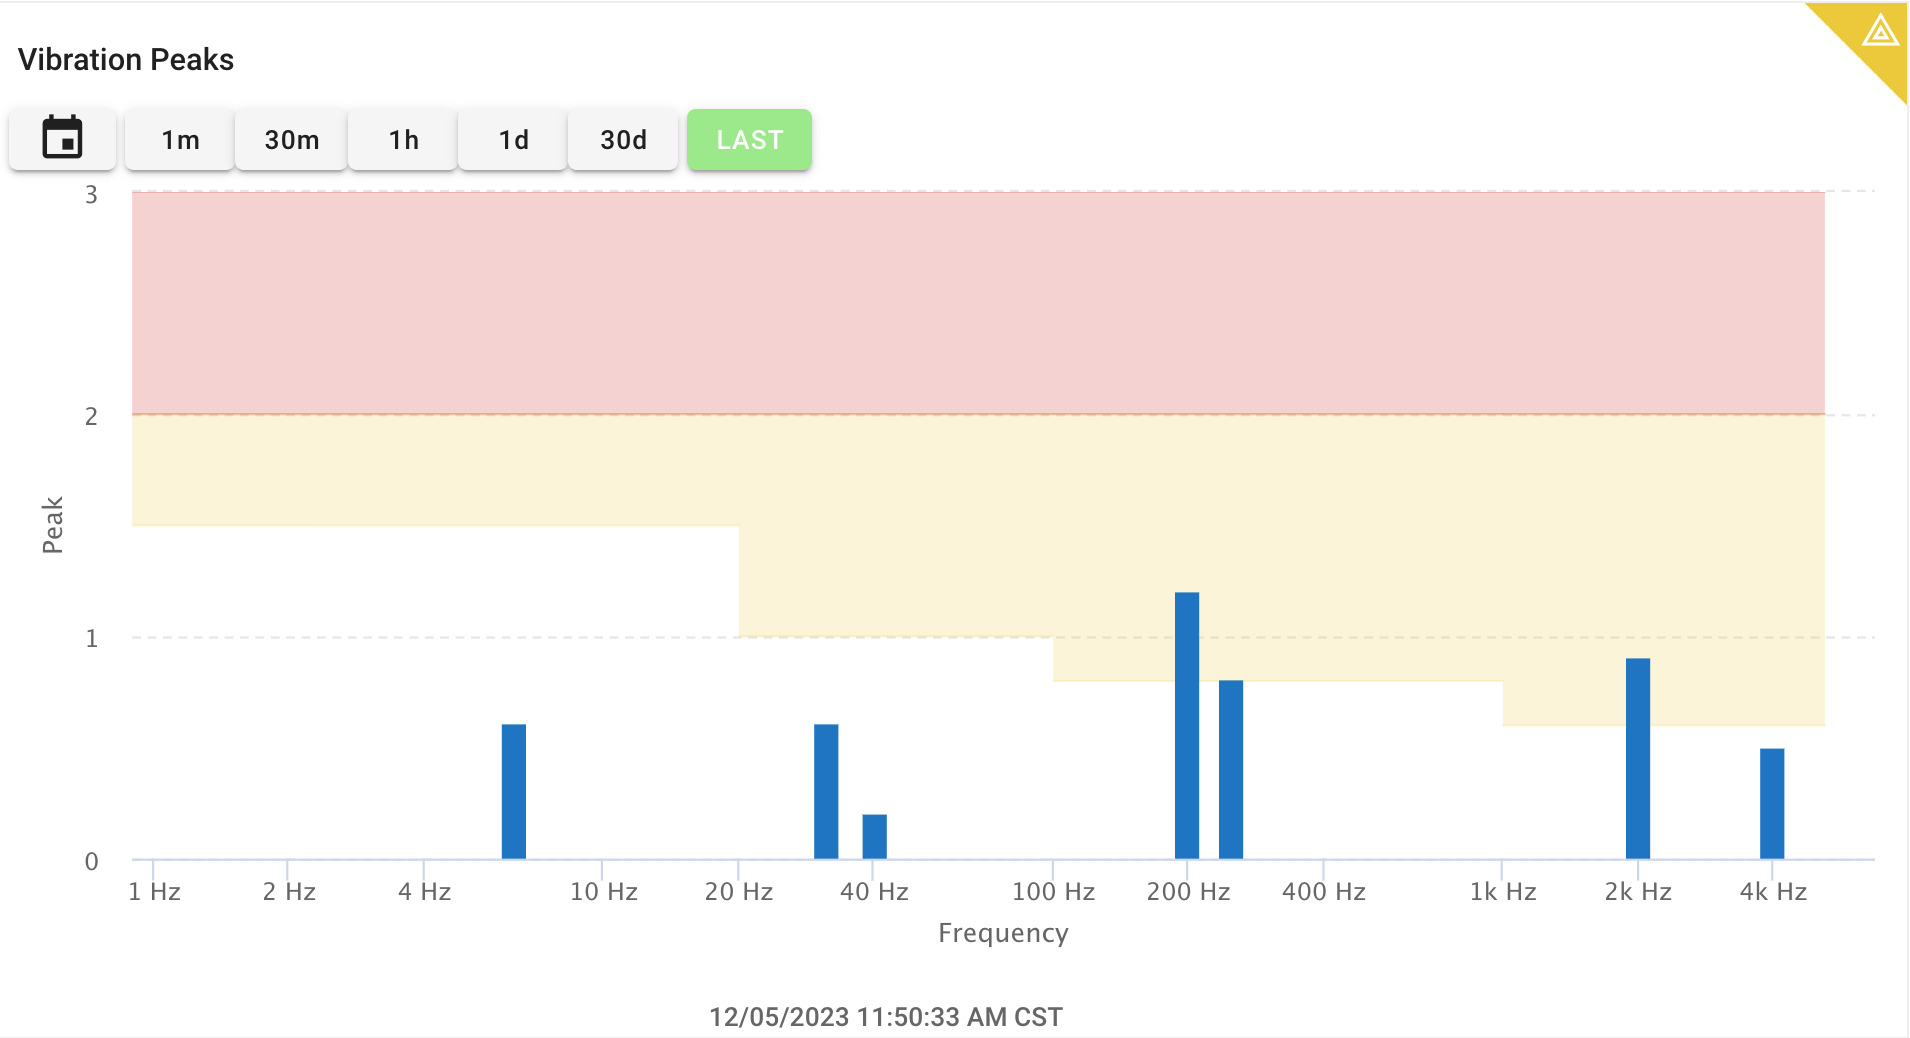
Array Data panel
A dashboard panel that charts a signal whose value is a full array of points, such as amplitude against frequency at one point in time, with a history view. Included in the Professional and Scale tiers since March 2025.
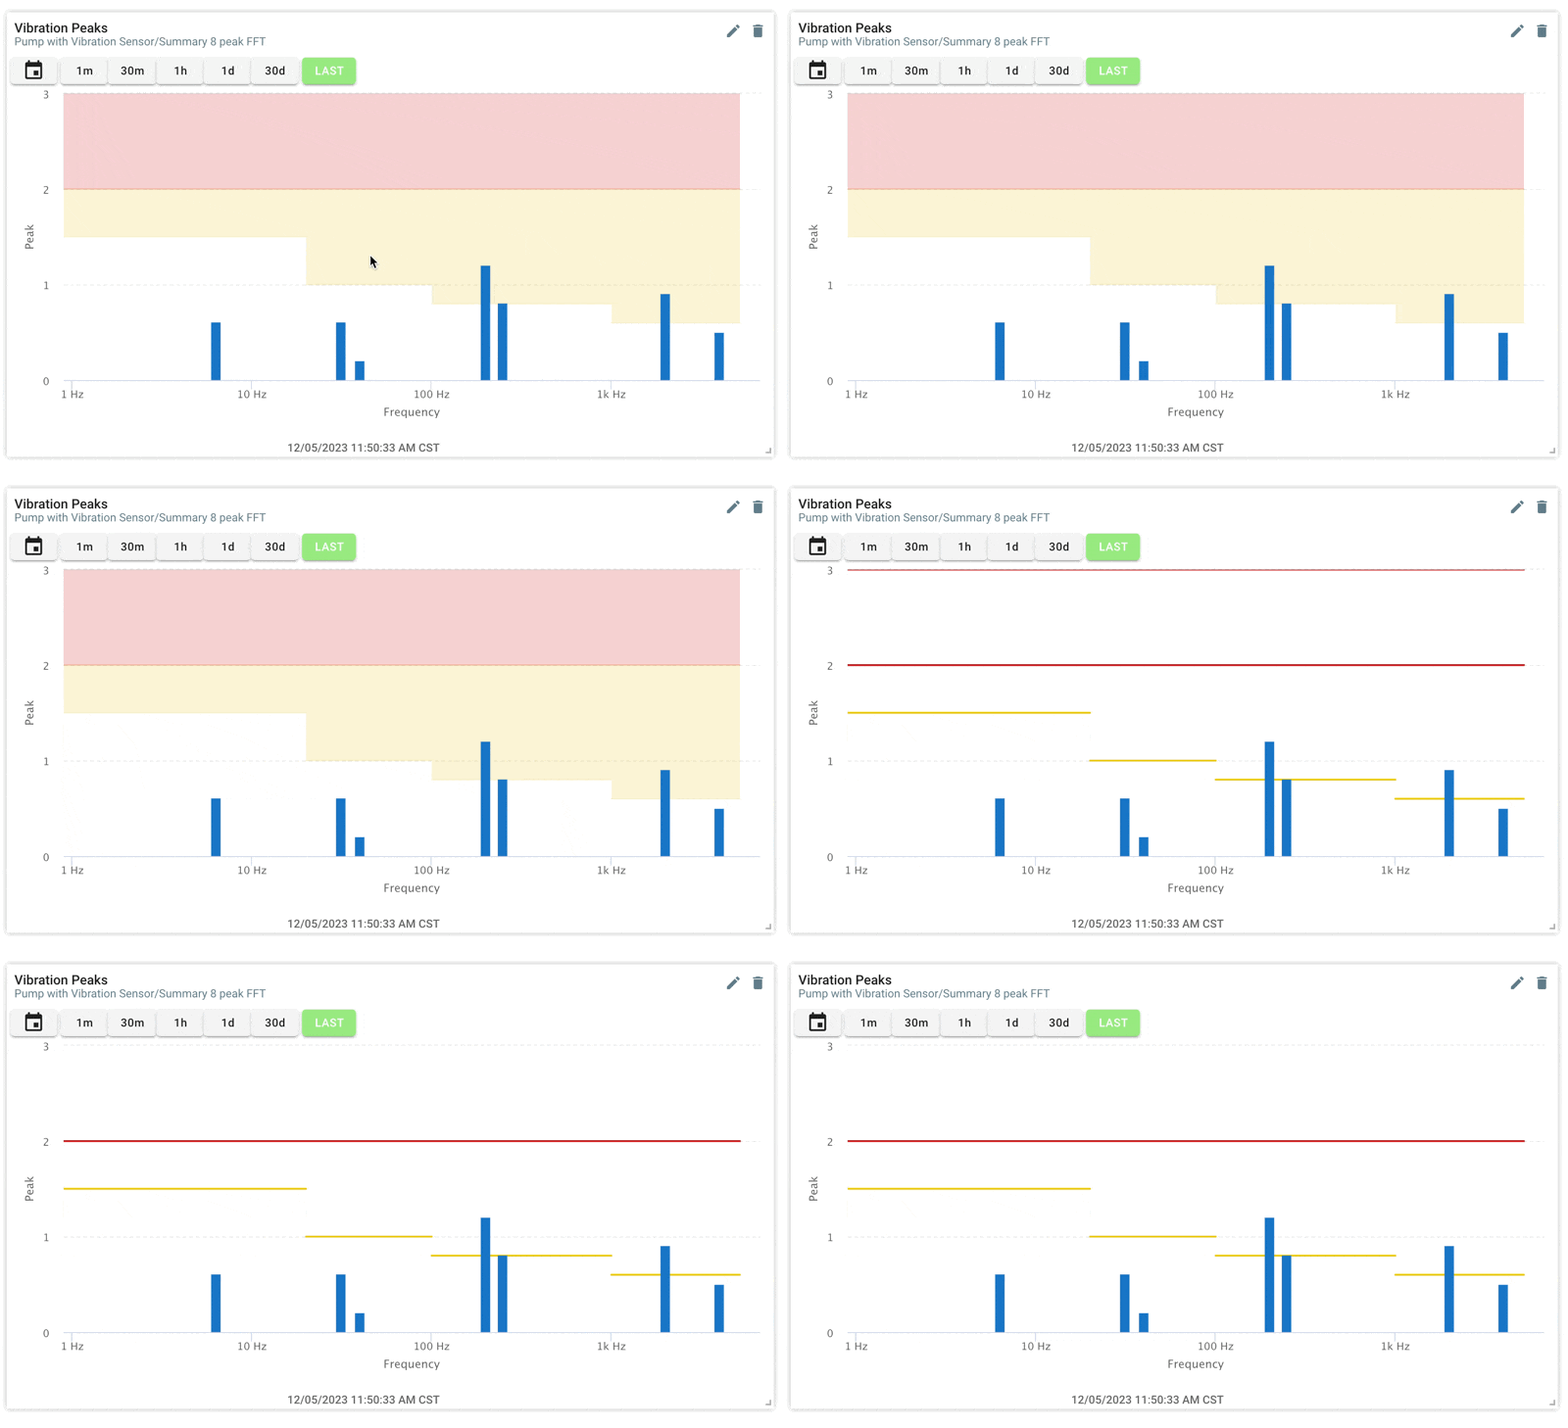
Array Rules
Rules for array signals, defined as ranges over parts of the array, that can be shown on the Array Data and Operating Plot panels. Included in the Professional and Scale tiers since March 2025.
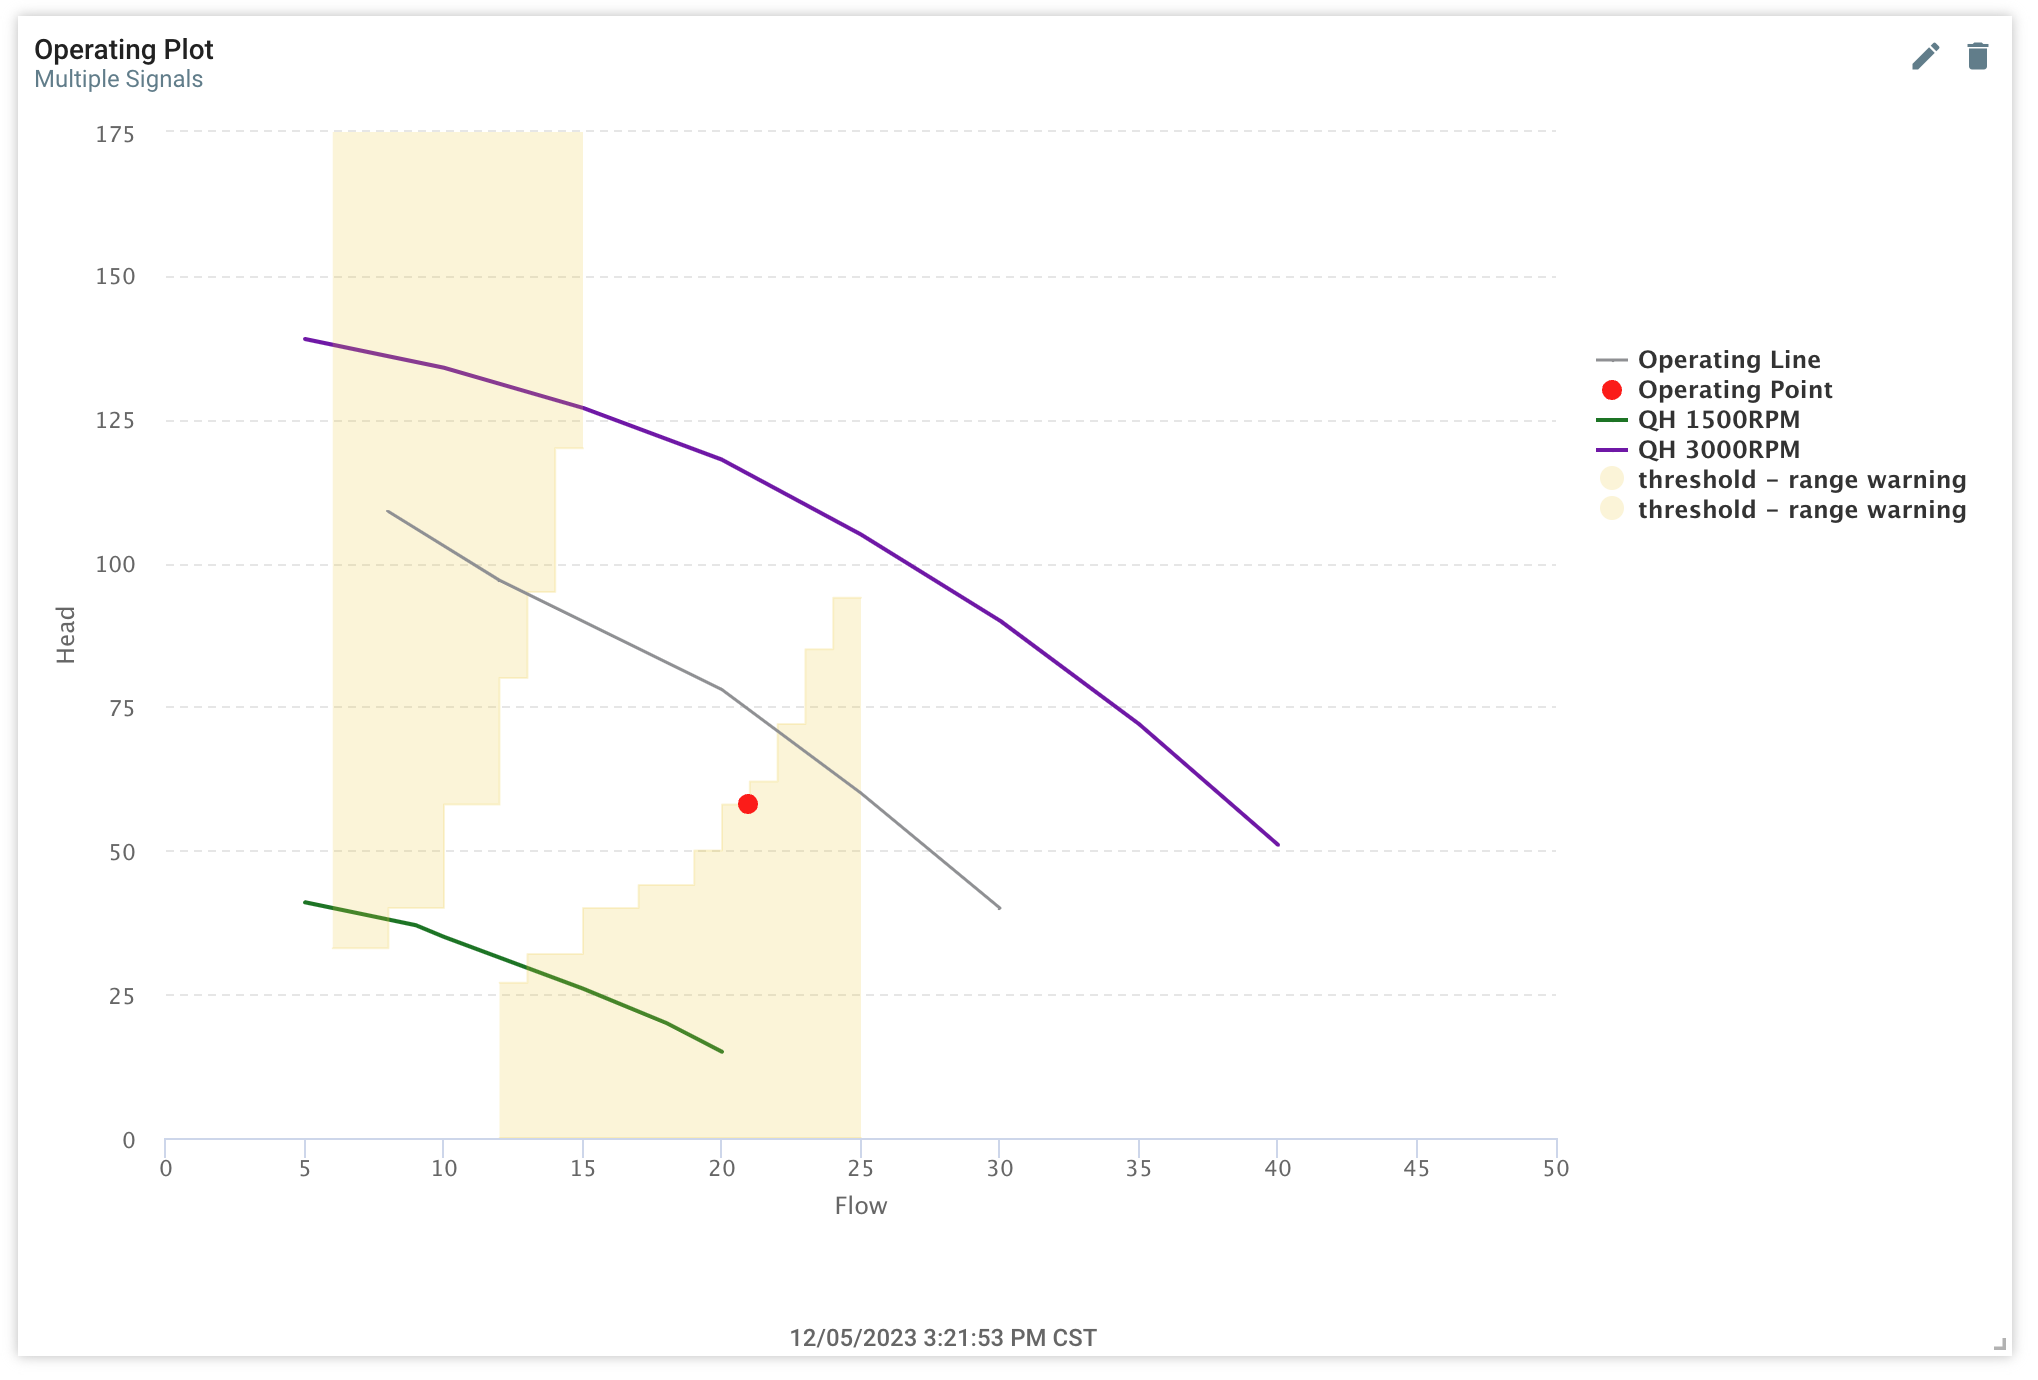
Operating Plot panel
A dashboard panel that plots lines and points from array signals, metadata, or fixed values, such as a pump's operating point on its head and flow curve. Included in the Professional and Scale tiers since March 2025.
Subsystems
Signals on an asset can be grouped into subsystems such as Electrical or Hydraulics. Each subsystem has its own status and can have its own dashboard. Included in the Scale tier since March 2025.

Function Checks
Checks gate a transform or rule so it only runs when other signals are in a given state or within a time window, for example only while a machine is running. Included in the Scale tier since March 2025.

User Preferred Units
Each user can choose the units they see in dashboards, by unit system or for specific data types, without changing how the data is stored or processed. Included in the Scale tier since March 2025.

- A user can be invited to up to 50 groups when Multi-Group Users is enabled. See User Access Control.
Earlier changes are in the Release Notes archives.