AWS EveryCloud Example
DEPRECATED FUNCTIONALITY
This functionality and solution template has been deprecated. Please contact Exosite support for information on alternative methods for attaining the features and functionality of the EveryCloud solution on Murano.
Overview
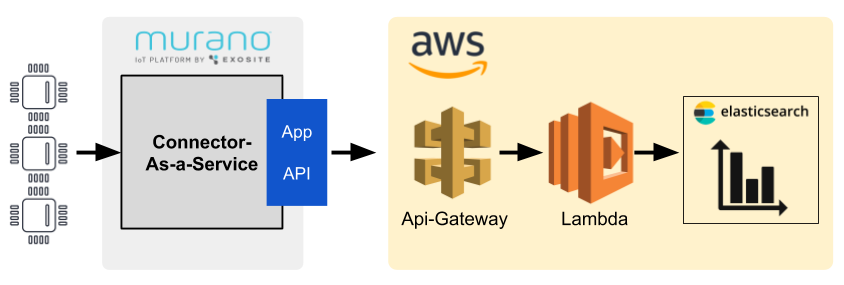
In this tutorial we will see how to create an Elasticsearch instance on AWS and configure it as an external application to use with claimed devices in your Device Portal. Events from devices will be sent to Elasticsearch for indexing and we can use Kibana to create dashboards and visualized our data.
Requirements
- AWS account with permission to launch services and create IAM roles
- Have an account on the Device Portal connected & claimed devices. See the device owner page for more info.
Setup AWS application
To simplify the setup of the required AWS services we have prepared an AWS CloudFormation template.
- Copy and save the CloudFormation Template 'api-lambda-es.yaml' on your computer
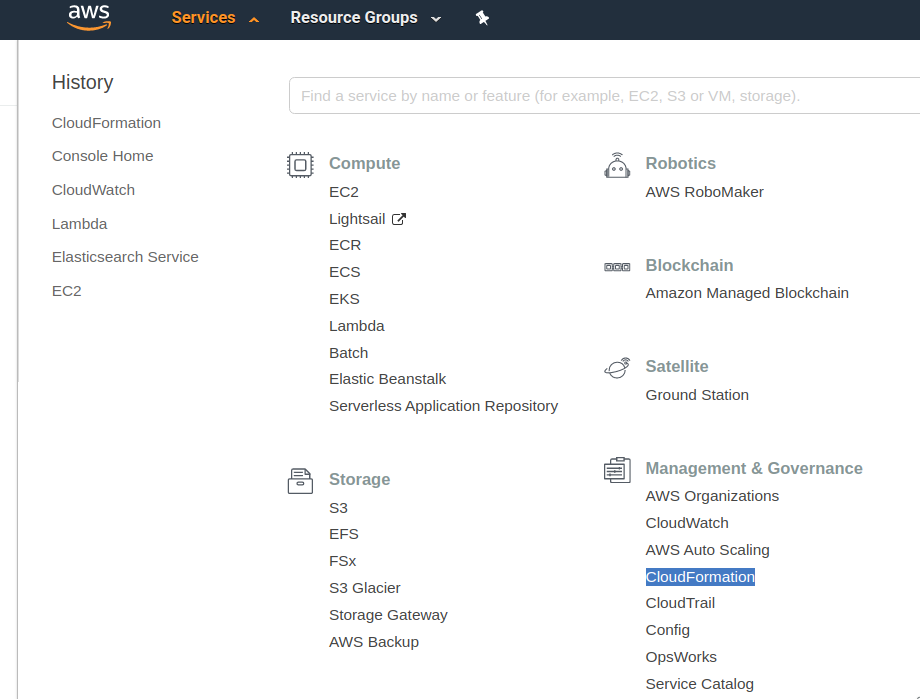
- Sign in to your AWS account at https://console.aws.amazon.com
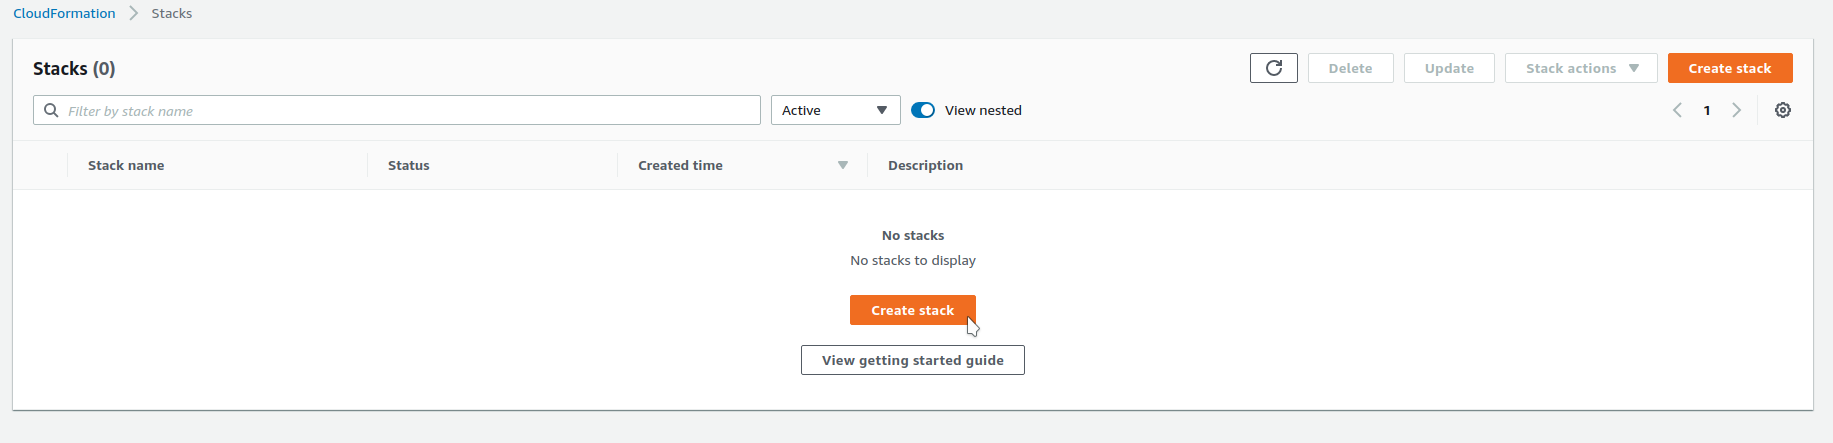
- Go to the CloudFormation service page
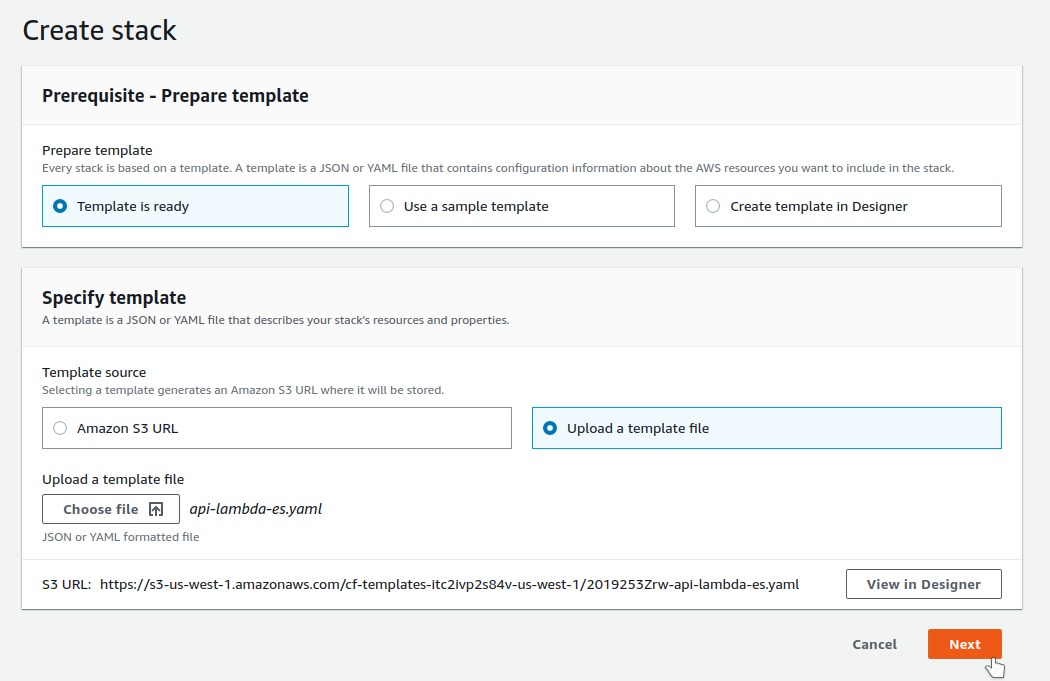
- Click
Create stack
- Choose
Upload a template fileand uploadapi-lambda-es.yamlfrom step 1
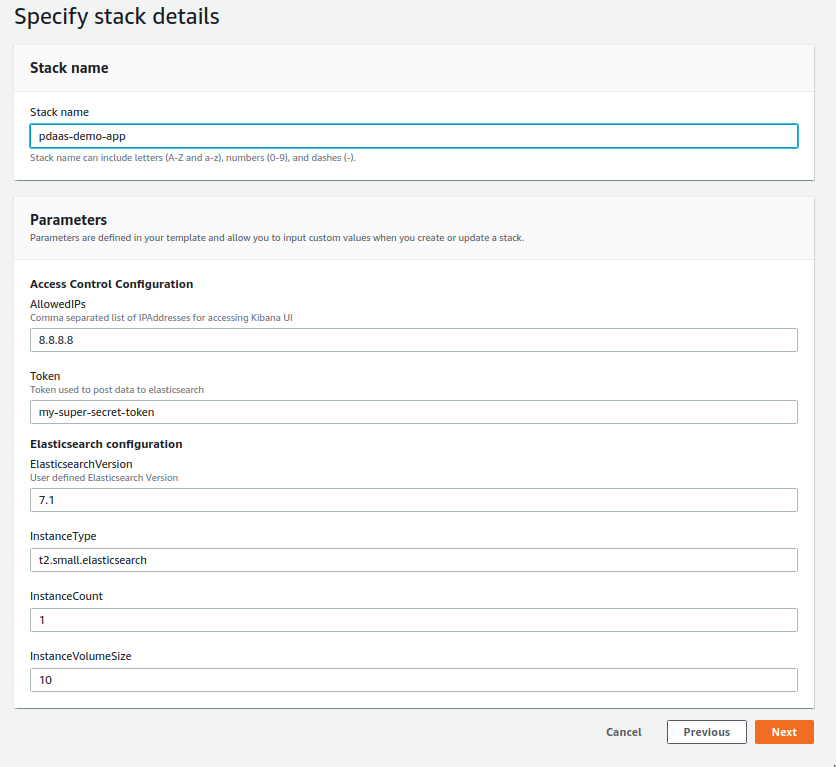
- Configure template parameters
- Give a cloudformation stack name, ex:
pdaas-demo-app - Go to https://www.google.com/search?q=what+is+my+ip to get your current public IP and add it to
AllowedIPs - Replace the
Tokenfield with random value and remember it as we will use it later. - \(Optional\) Configure elasticsearch setup
- Click
Next
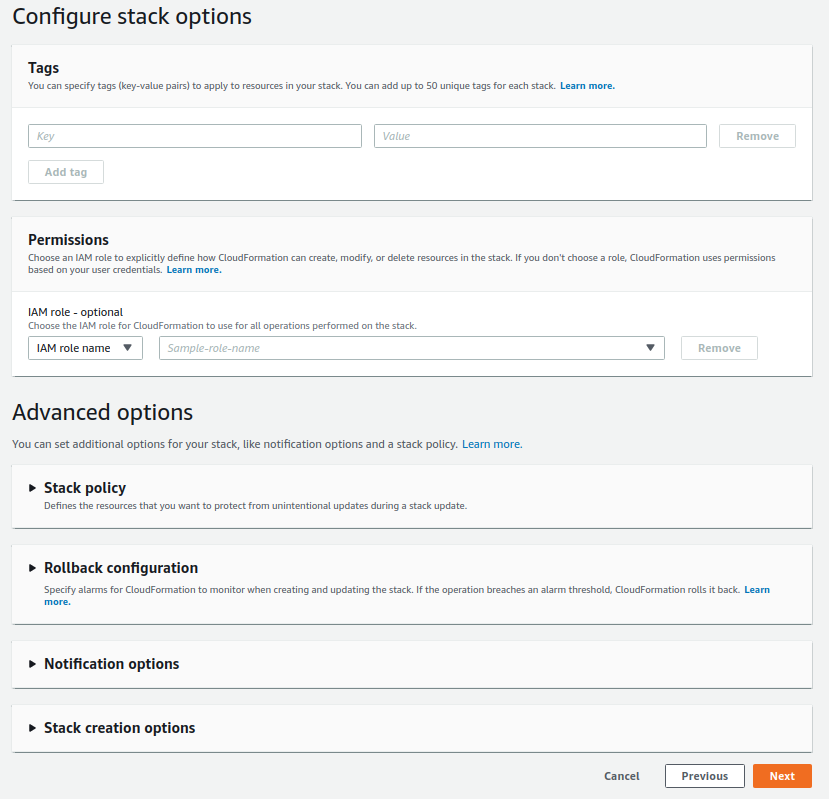
- No need for custom stack options so can click
Nextagain
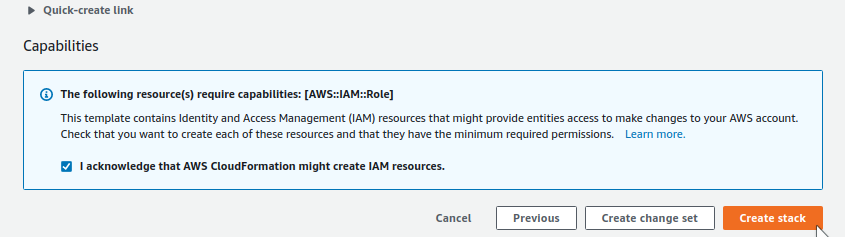
- We have to acknowledge that the template will create an IAM role \(used to give Lambda permission to Elasticsearch\) and then click
Create stack
- AWS CloudFormation will create and configure our services, it will take ~15 minutes to complete.
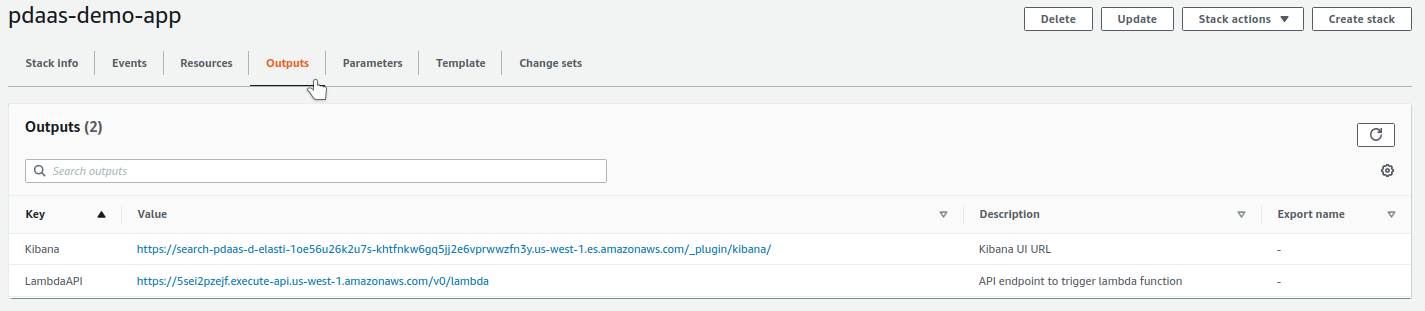
- Once complete we can go to the
Outputstab to see the relevant URLs created
Connect External Application 
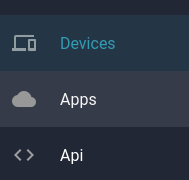
- In the Device Portal, we can click the "hamburger" menu button in the top left corner to access the application page.
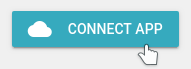
- Once in the Device Portal's application page we click
CONNECT APPto configure our Elasticsearch application.
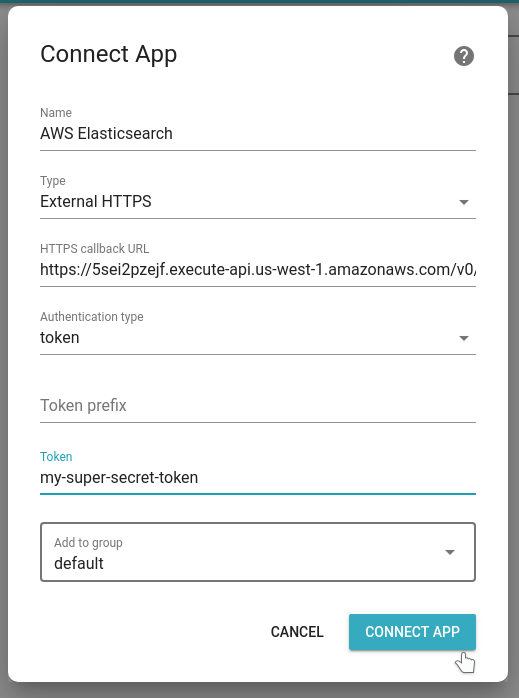
- We will use the following configuration
- Give an appropriate name, ex:
AWS Elasticsearch - Select
External HTTPSapplication type - For HTTPS callback URL we can copy the
LambdaAPIURL from our CloudFormationOutputstab - Choose
tokenas Authentication type - Leave
Token prefixempty, and input the token used to create the AWS Elasticsearch stack - Click
CONNECT APPto finalize the setup
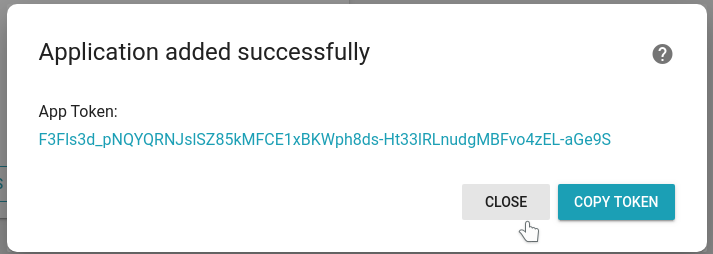
After adding an application we will see a popup with a token. This token can be used for external applications to interface with some of the available Device Portal API's such as list devices.
Our Elasticsearch instance does not use such functionality so we can just close this popup.
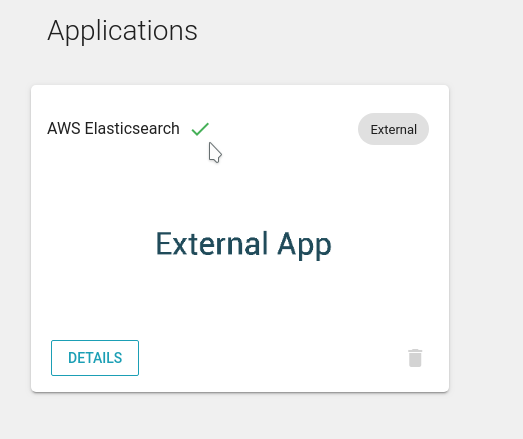
If there are devices connected and sending events to our Device Portal application we should now see a green-mark indicating that our Elasticsearch app has received and successfully acknowledged device events.
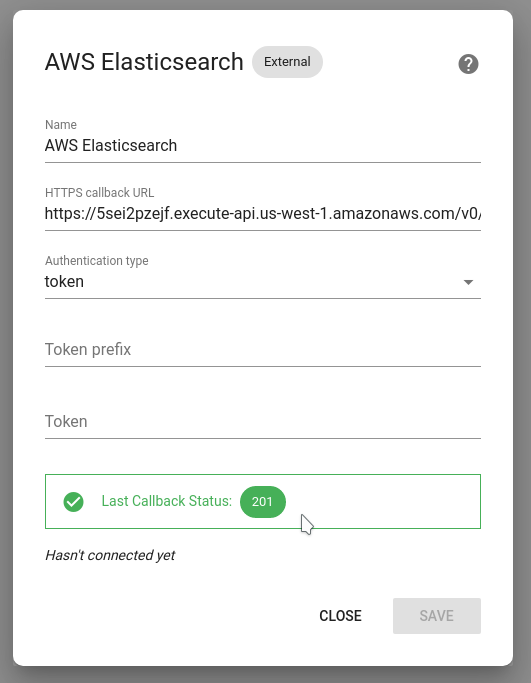
In application details, we can also see the last callback status.
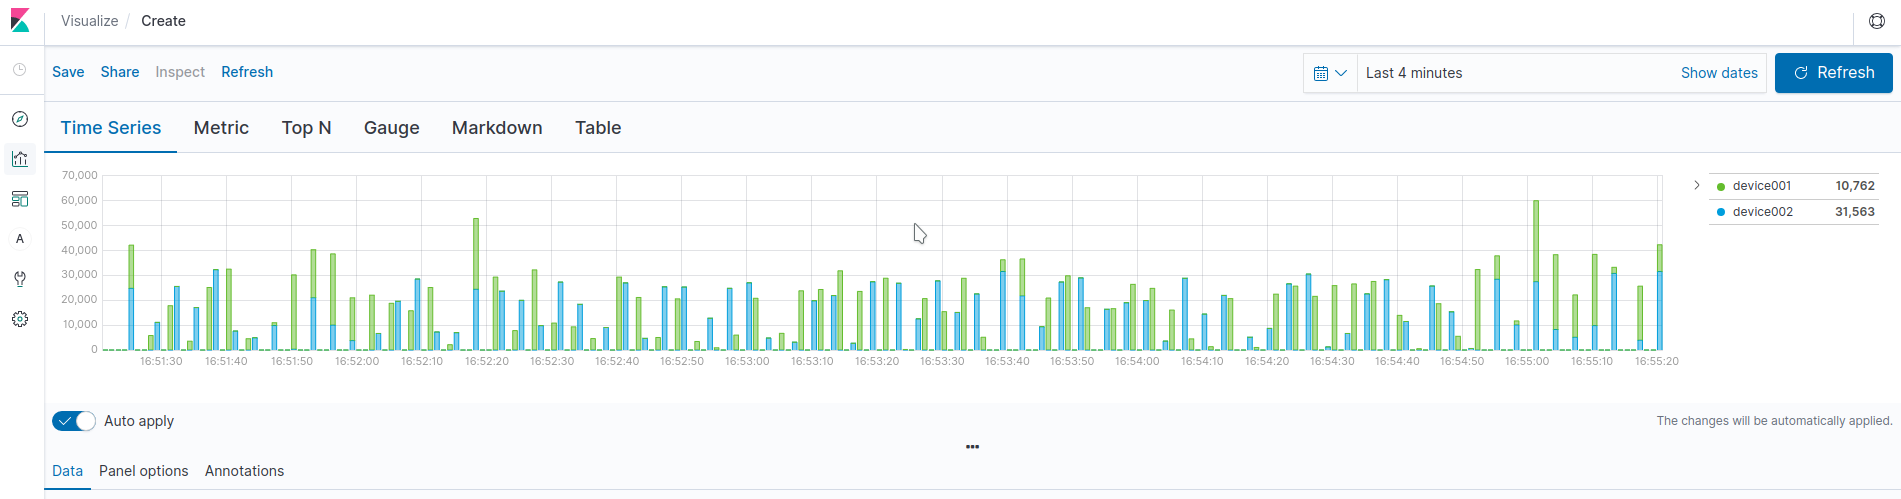
Create Kibana visualization 
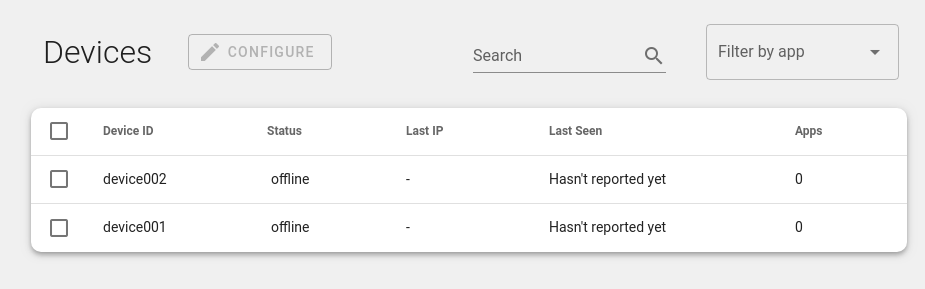
We can now create visualizations for our device events using Kibana. In the application of this example there are two devices connected, device001 and device002. These two devices are sending a number to a resource called temp. We will create a bar graph for this resource grouped by device identity.
- Go to the Kibana UI by clicking the
KibanaURL in the AWS CloudFormationOutputstab - We are then greeted by the Kibana setup page, here we will click
Explore on my own
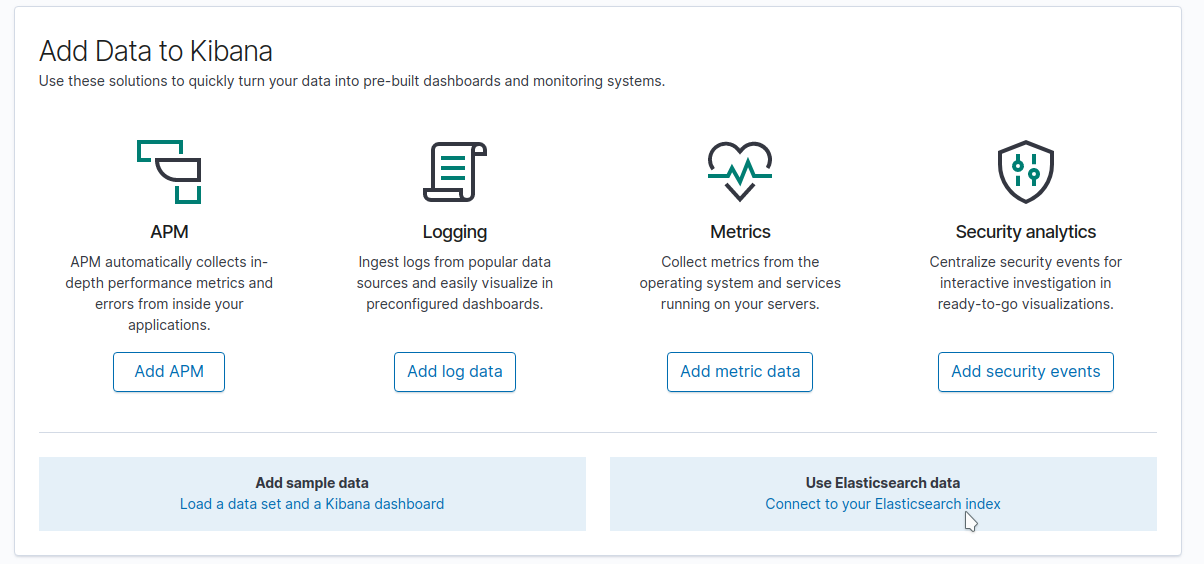
- On the Kibana main page we can click
Connect to your Elasticsearch Index
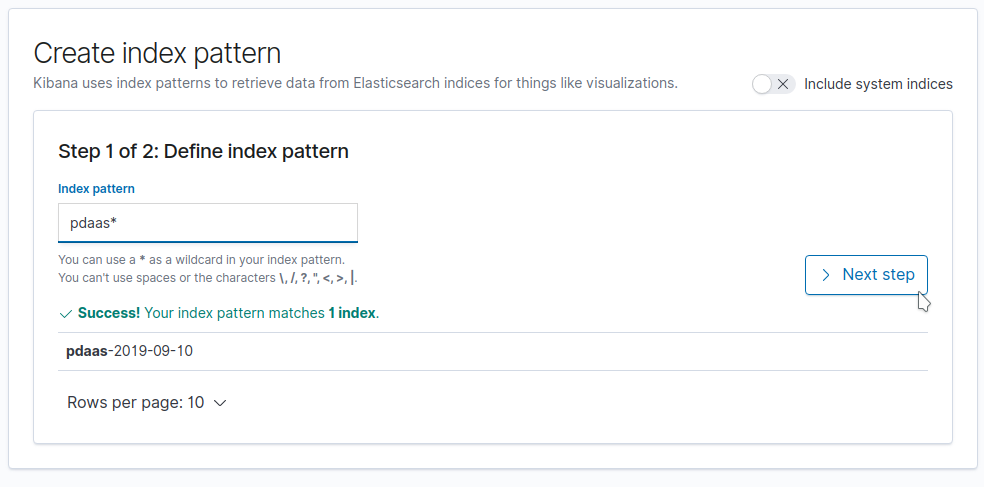
- Indexes are automatically created when device events are successfully reaching our Elasticsearch. So if we have devices sending data we should see a
pdaas-yyy-mm-ddindex created. We will add a wildcard pattern forpdaas*
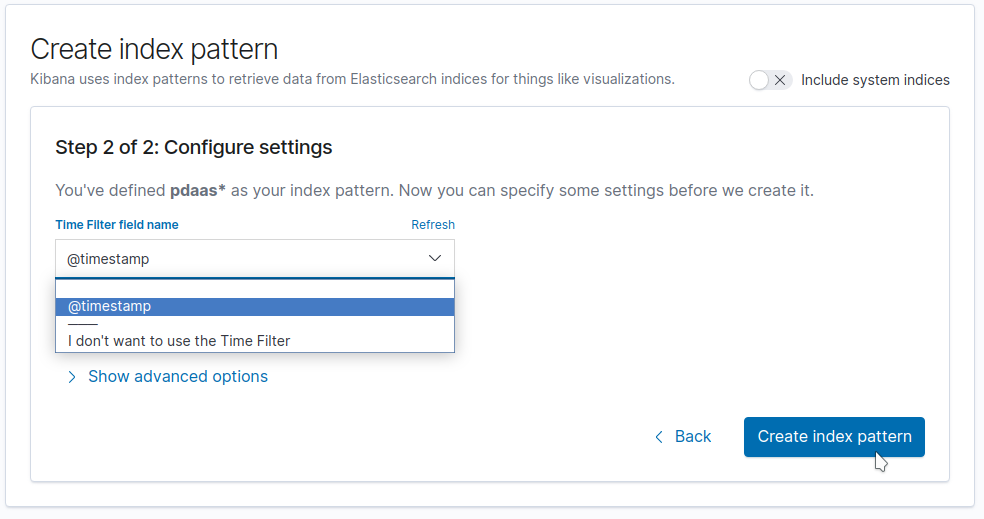
- Next we need to select our timestamp field
@timestampand finally clickCreate index pattern
- We can now see our index pattern and all available fields
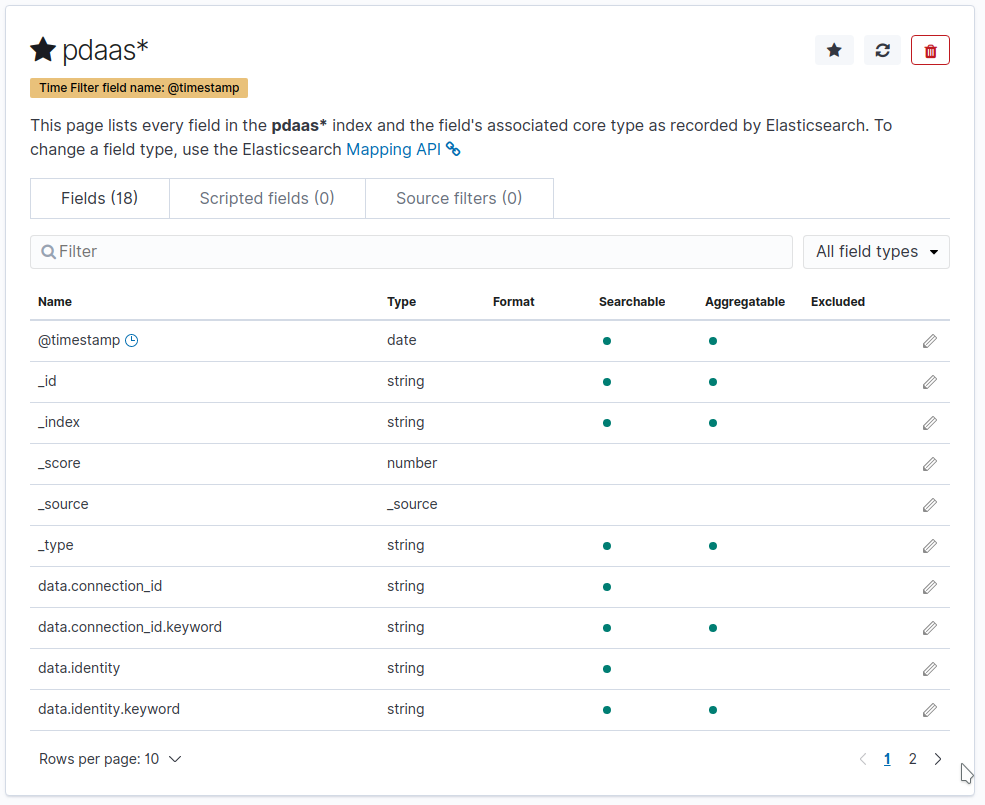
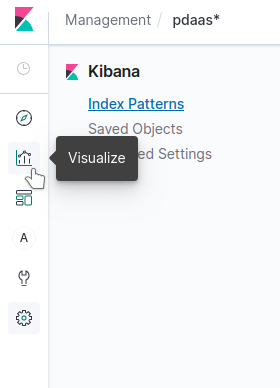
- Next we can click the
Visualizetab
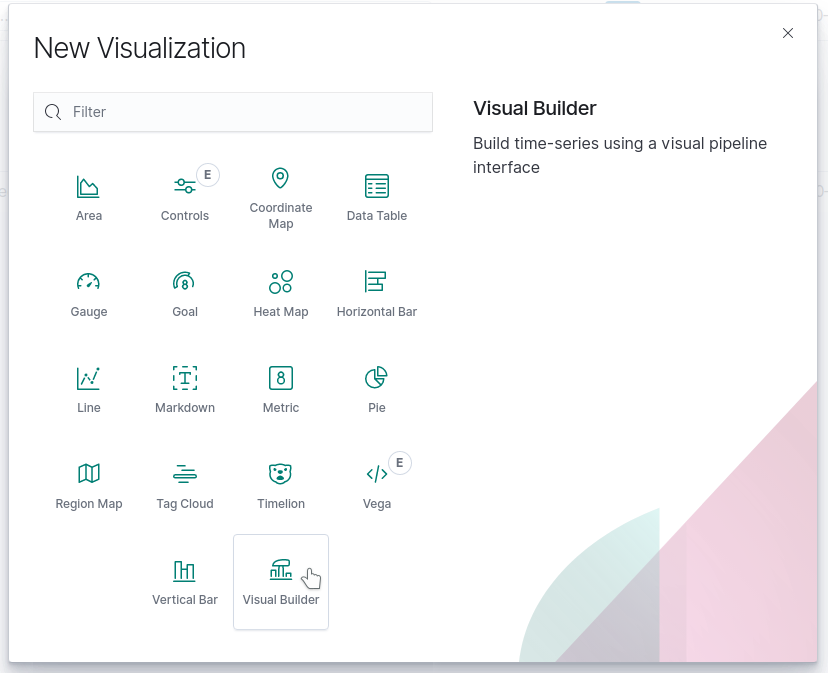
- Click
Create a visualizationand selectVisual Builder
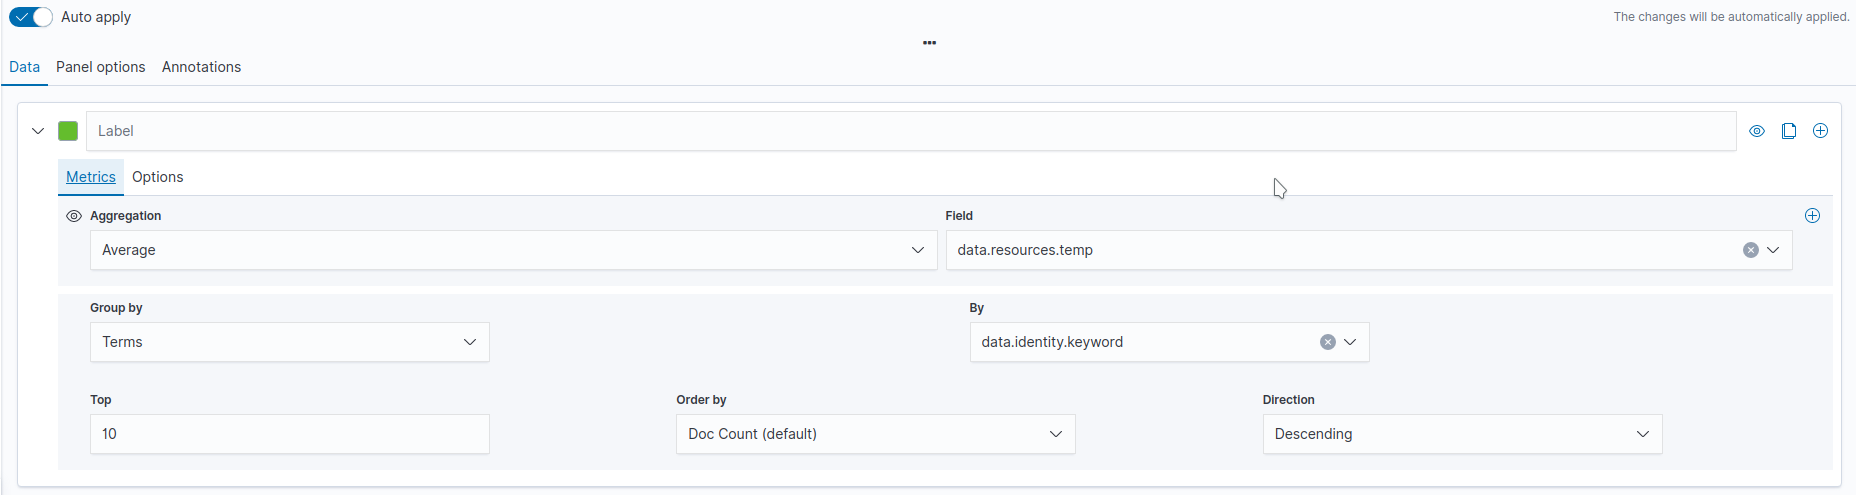
- Change
Aggregationtoaverageand field to ourdata.resources.tempand setGroup bytoTermsandBytodata.identity.keyword
- Go to
Optionstab next toMetricsand changeChart typetobar,StackedtoStackedandSplit color themetoRainbow
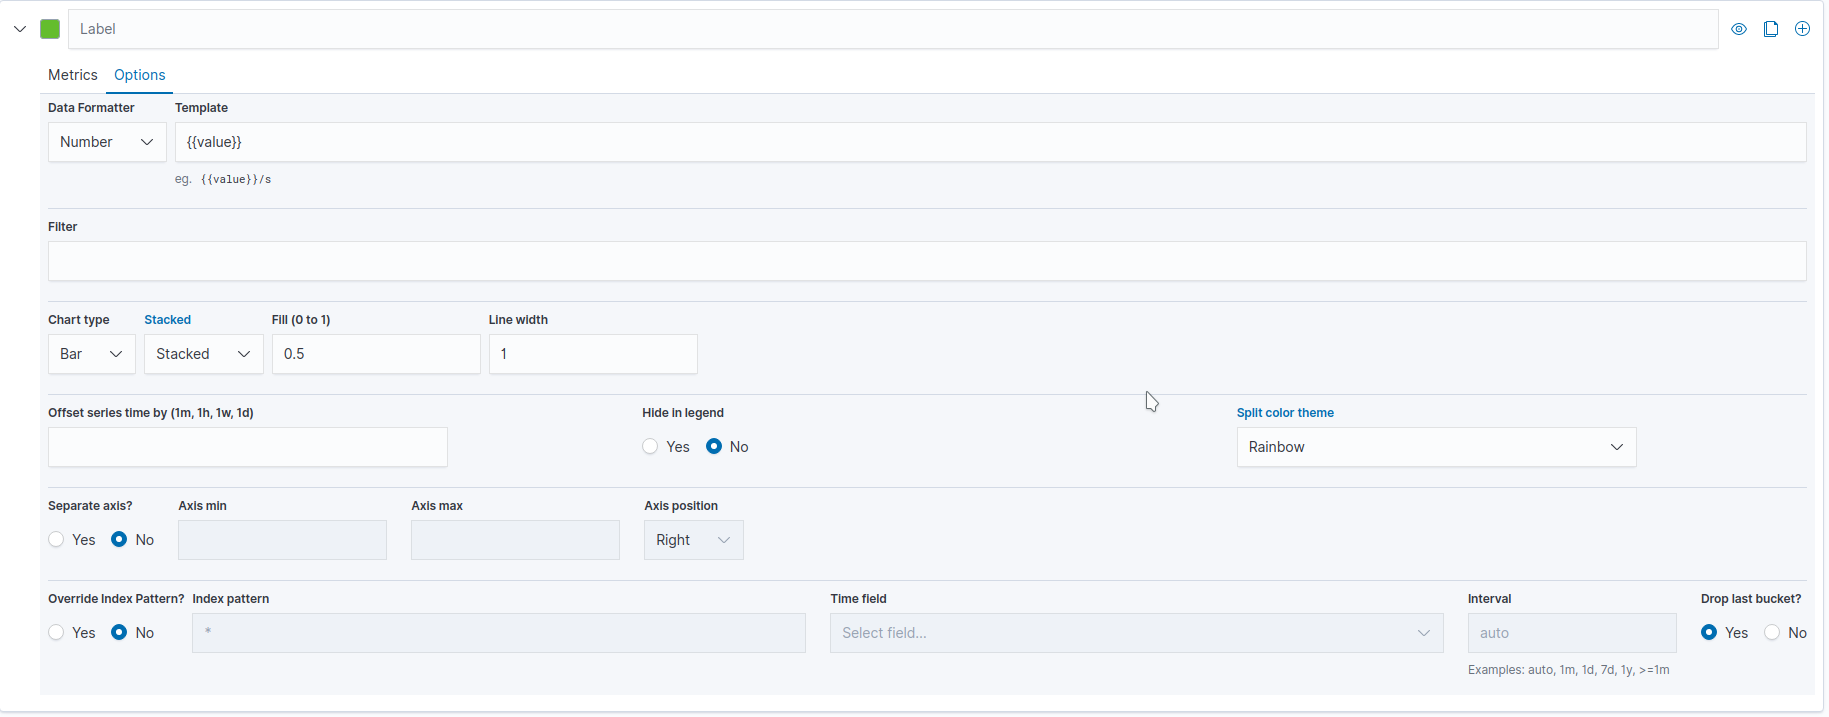
- We now have our stacked bar graph over
tempsplit by deviceidentitywith live data from our devices