Asset Fleet View
Asset Fleet Grid
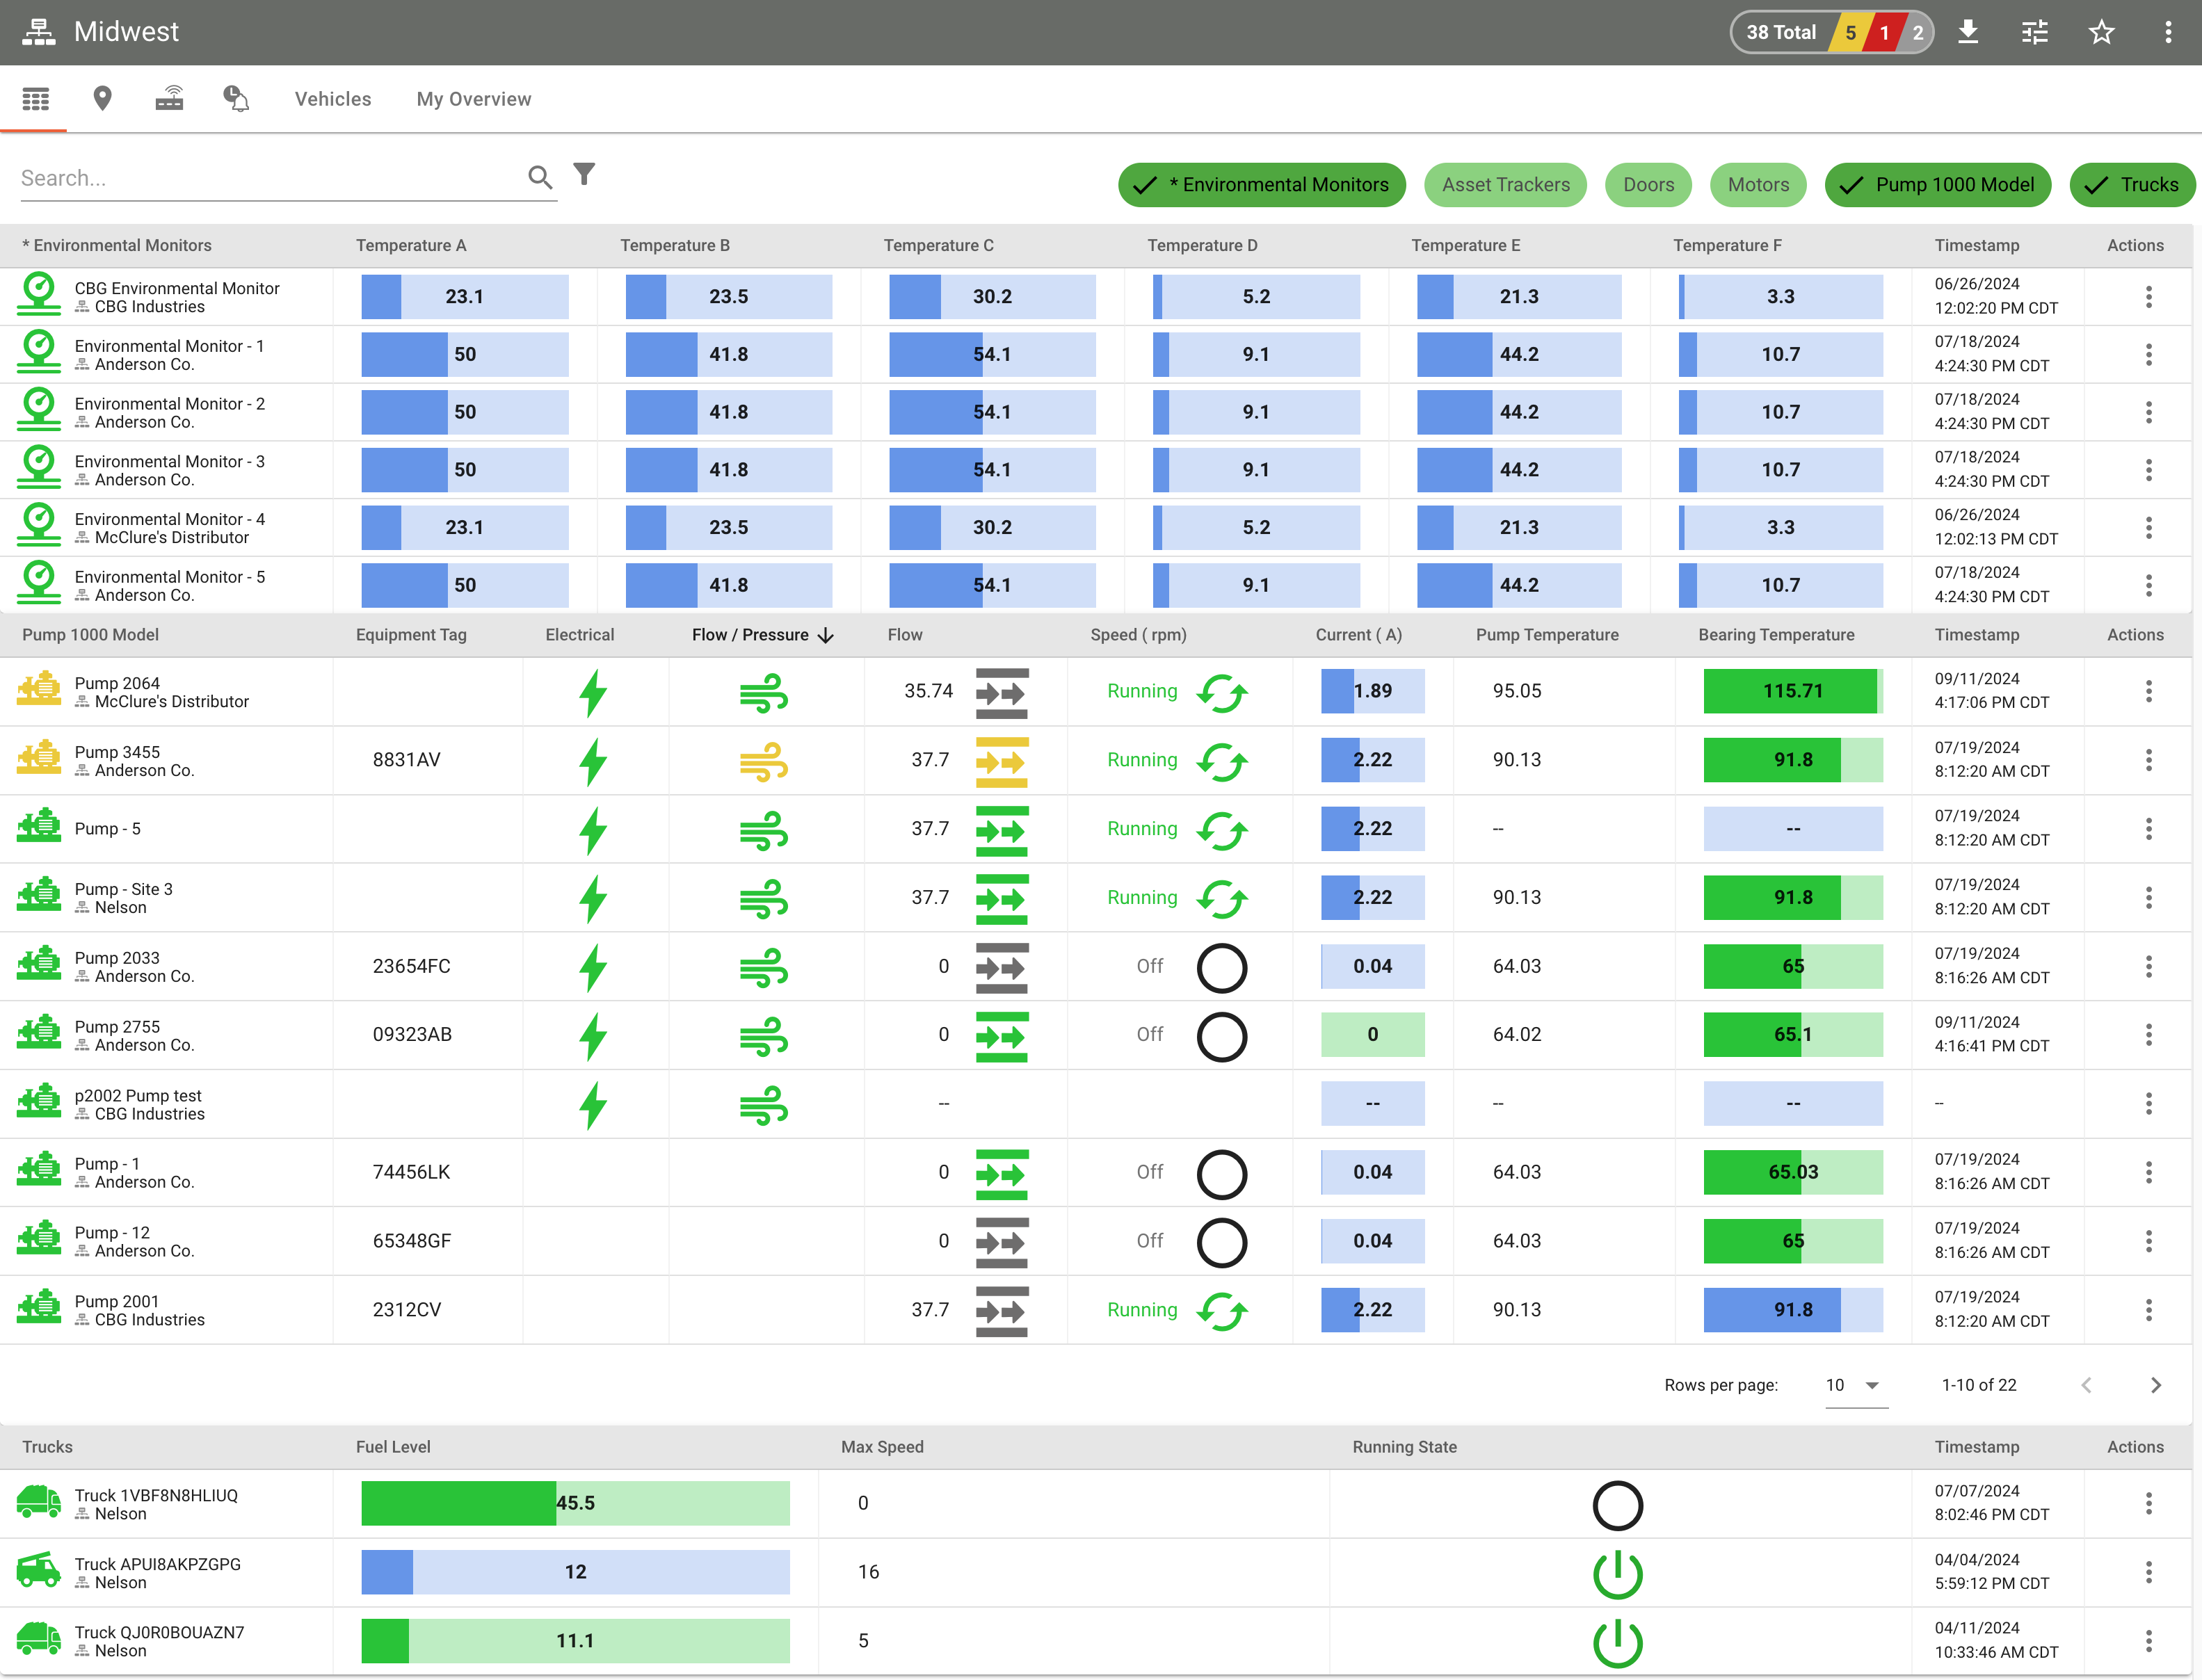
The Asset Grid view provides a tabular fleet overview of all assets in a group (and subgroups) separated by Asset Type. The columns can be sorted, the default sort uses the asset statuses. Each Asset Type defines metrics, which are the columns in this grid. Metrics may be signals, metadata, and/or subsystems.
Columns
- Signal metrics can be represented with its current value, an interpreted value, and optionally a gauge or icon - along with status indication.
- Metadata metrics show the value of the asset's metadata field.
- Subsystem metrics show the subsystems icon and current status color. Clicking on the icon will go to the subsystem's dashboard for that asset.
When Assets have not been assigned an Asset Type, they are separated and use the Asset List view.
Asset Fleet Grid view and Asset Types are available at specific ExoSense application tiers. When not available, the Asset List view is available.
-
Asset Types
Asset Types are used to populate the asset grid fleet view.
-
Asset Templates
Asset Templates can be associated to an Asset type, but are otherwise not represented on the asset grid view.
Grid Visualizations
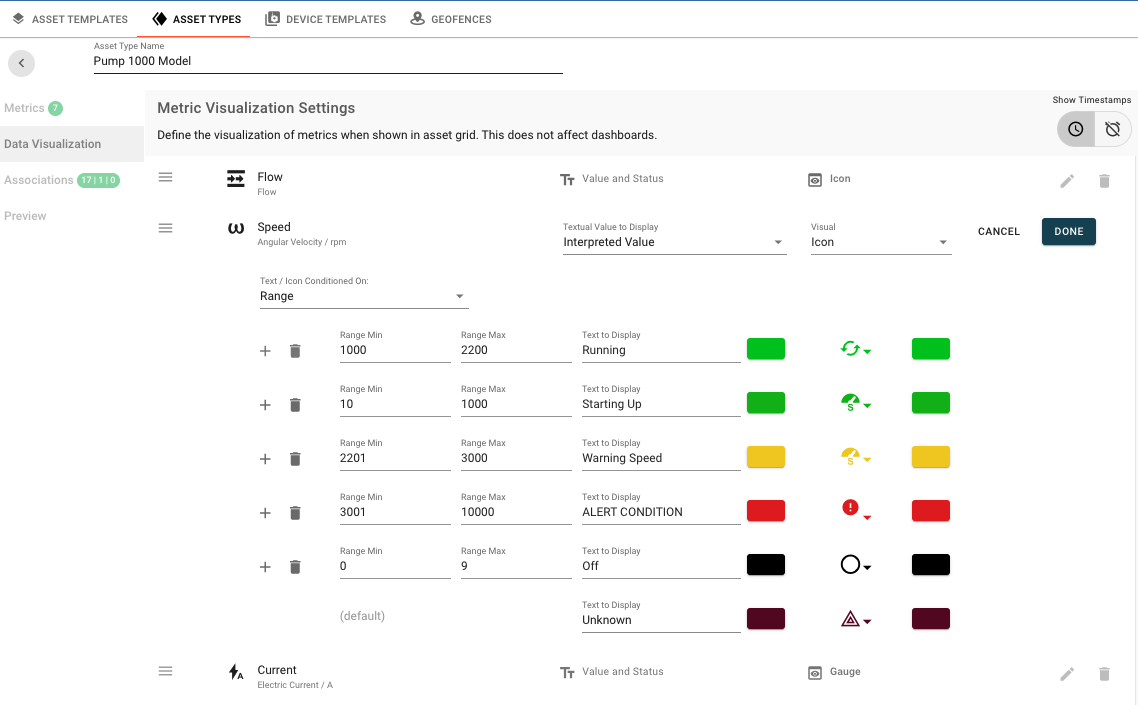
The visualization for each asset metric column in this tabular grid view can be configured using the Asset Types. These values and visualization will update real-time as new asset signal values (associated to the metrics) are received. The Timestamp for the last received Asset signal value is optional to show as a column.
Metric Visualization Options
| Example Option | Visual |
|---|---|
| Value and Status |  |
| Value with Icon | |
| Interpreted with Icon | |
| Value with gauge |  |
Configuration in the Asset Type
Exporting the Asset Grid View
The Asset fleet grid view can be exported using the 'Export Menu' icon in the upper right hand navigation. The export options include image, print, pdf, and two file output options CSV and JSON. When exporting this grid table view, it will use the current rendered data and visualizations as you see in the browser page. Ensure all assets are shown in the browser as you wish to export.
This feature and specific export options may not be available on all solutions. Contact administrator for more information.
| Export Method | Description |
|---|---|
| The PDF export options allow by default exporting the entire visible asset grid table as a single continuous view into a PDF file, which will be downloaded to your computer via your browser. You can choose in PDF mode to use page breaks and adjust the resolution. | |
| Image | The Image export options exports the entire visible asset grid table as a single continuous image (.jpg). Image quality is adjustable as an option. |
| This will bring up the print dialog for your browser and computer. | |
| CSV | The CSV export will generate a single CSV file. If there are more than one asset type with different columns, the file will combine all columns. Assets without a type will also be exported. |
| JSON | The JSON export will generate a file that contains each asset with information about asset type and all signal / metadata values in JSON format |
CSV Export Format Example
Name,Type Name,timestamp,Battery,Bearing Temperature,Current,Discharge Pressure,Electrical,Electrical Current,Engine Status,Equipment Tag,Flow,Fuel Level,Humidity,Max Speed,Pump Temperature,Speed,State,Suction Pressure,Tag,Temperature,Temperature A,Temperature B,Temperature C,Temperature D,Temperature E,Temperature F,Vehicle,Vibration RMS
Asset Tracker - 5,Asset Trackers,2023-07-29T21:12:49.000Z,93.3,,,,,,,,,,64.68,,,,,,,61.37,,,,,,,,
Tracker - 0003,Asset Trackers,2023-07-29T21:13:12.000Z,44.3,,,,,,,,,,78.17,,,,,,889FF2,57.14,,,,,,,MN 2FZ-870,
Tracker 0001,Asset Trackers,2023-07-29T21:12:49.000Z,93.3,,,,,,,,,,64.68,,,,,,932CC3,61.37,,,,,,,MN 2FZ-870,
Vehicle 004,Asset Trackers,2023-07-29T21:13:31.000Z,42.9,,,,,,,,,,78.56,,,,,,,58.65,,,,,,,,
Anderson Environmental Monitor,Environmental Monitors,2023-07-29T21:13:34.000Z,,,,,,,,,,,,,,,,,,,49.7,41.5,53.9,8.7,44,10.4,,
CBG Environmental Monitor,Environmental Monitors,2023-07-29T21:13:42.000Z,,,,,,,,,,,,,,,,,,,49.7,41.5,53.9,8.7,44,10.4,,
Environmental Monitor - 2,Environmental Monitors,2023-07-29T21:13:34.000Z,,,,,,,,,,,,,,,,,,,49.7,41.5,53.9,8.7,44,10.4,,
Environmental Monitor - 3,Environmental Monitors,2023-07-29T21:13:34.000Z,,,,,,,,,,,,,,,,,,,49.7,41.5,53.9,8.7,44,10.4,,
Environmental Monitor - 4,Environmental Monitors,2023-07-29T21:13:43.000Z,,,,,,,,,,,,,,,,,,,49.7,41.5,53.9,8.7,44,10.4,,
Environmental Monitor - 5,Environmental Monitors,2023-07-29T21:13:34.000Z,,,,,,,,,,,,,,,,,,,49.7,41.5,53.9,8.7,44,10.4,,
Pump - 1,Pump 1000 Model,2023-07-29T21:12:32.000Z,,91.86,2.24,25.24,,,,74456LK,37.74,,,,90.13,1900.87,,16.36,,,,,,,,,,
Pump - 1,Pump 1000 Model,2023-07-29T21:12:32.000Z,,91.86,2.24,25.24,,,,,37.74,,,,90.13,1900.87,,16.36,,,,,,,,,,
Pump - 2,Pump 1000 Model,2023-07-29T21:12:32.000Z,,91.86,2.24,25.24,,,,,37.74,,,,90.13,1900.87,,16.36,,,,,,,,,,
Pump - 2,Pump 1000 Model,2023-07-29T21:12:36.000Z,,91.86,2.24,25.24,,,,4TF323,37.74,,,,90.13,1900.87,,16.36,,,,,,,,,,
Pump - 3,Pump 1000 Model,2023-07-29T21:12:32.000Z,,91.86,2.24,25.24,,,,,37.74,,,,90.13,1900.87,,16.36,,,,,,,,,,
Pump 3456,Pump 1000 Model,2023-07-29T21:12:32.000Z,,91.86,2.24,25.24,,,,,37.74,,,,90.13,1900.87,,16.36,,,,,,,,,,
Pump 43,Pump 1000 Model,2023-07-29T21:12:07.000Z,,115.75,2.49,27.12,,,,,36.97,,,,95.11,2001,,16.49,,,,,,,,,,
Pump 45902,Pump 1000 Model,2023-07-29T21:12:32.000Z,,91.86,2.24,25.24,,,,,37.74,,,,90.13,1900.87,,16.36,,,,,,,,,,
Pump - 12,Pump 1000 Model,2023-07-29T21:12:32.000Z,,91.86,2.24,25.24,,,,65348GF,37.74,,,,90.13,1900.87,,16.36,,,,,,,,,,
Pump 2755,Pump 1000 Model,2023-08-07T19:31:19.000Z,,73.05,0,16.35,,,,09323AB,21.73,,,,71.7,0,,16.35,,,,,,,,,,
Pump - 3234,Pump 1000 Model,2023-07-29T21:12:32.000Z,,91.86,2.24,25.24,,,,,37.74,,,,90.13,1900.87,,16.36,,,,,,,,,,
Pump - 7,Pump 1000 Model,2023-07-29T21:12:07.000Z,,115.75,2.49,27.12,,,,1463DF,36.97,,,,95.11,2001,,16.49,,,,,,,,,,
Pump - 8,Pump 1000 Model,2023-07-29T21:12:32.000Z,,91.86,2.24,25.24,,,,236598HJ,37.74,,,,90.13,1900.87,,16.36,,,,,,,,,,
Pump - 9,Pump 1000 Model,2023-07-29T21:12:32.000Z,,91.86,2.24,25.24,,,,34333GV,37.74,,,,90.13,1900.87,,16.36,,,,,,,,,,
Pump 2064,Pump 1000 Model,2023-07-29T21:12:07.000Z,,115.75,2.49,27.12,,,,,36.97,,,,95.11,2001,,16.49,,,,,,,,,,
Pump 8324,Pump 1000 Model,2023-07-29T21:12:07.000Z,,115.75,2.49,27.12,,,,9823GVB,36.97,,,,95.11,2001,,16.49,,,,,,,,,,
Pump 8344,Pump 1000 Model,2023-07-29T21:12:07.000Z,,115.75,2.49,27.12,,,,552214TR,36.97,,,,95.11,2001,,16.49,,,,,,,,,,
Pump - Site 22,Pump 1000 Model,2023-07-29T21:12:32.000Z,,91.86,2.24,25.24,,,,,37.74,,,,90.13,1900.87,,16.36,,,,,,,,,,
Pump - Site 31,Pump 1000 Model,2023-07-29T21:12:32.000Z,,91.86,2.24,25.24,,,,,37.74,,,,90.13,1900.87,,16.36,,,,,,,,,,
Pump 2033,Pump 1000 Model,2023-07-29T21:12:32.000Z,,91.86,2.24,25.24,,,,23654FC,37.74,,,,90.13,1900.87,,16.36,,,,,,,,,,
Pump 4901,Pump 1000 Model,2023-07-29T21:12:32.000Z,,91.86,2.24,25.24,,,,11988PL,37.74,,,,90.13,1900.87,,16.36,,,,,,,,,,
Pump 2001,Pump 1000 Model,2023-07-29T21:12:32.000Z,,91.86,2.24,25.24,,,,2312CV,37.74,,,,90.13,1900.87,,16.36,,,,,,,,,,
| Name | Type Name | timestamp | Battery | Bearing Temperature | Current | Discharge Pressure | Electrical | Electrical Current | Engine Status | Equipment Tag | Flow | Fuel Level | Humidity | Max Speed | Pump Temperature | Speed | State | Suction Pressure | Tag | Temperature | Temperature A | Temperature B | Temperature C | Temperature D | Temperature E | Temperature F | Vehicle | Vibration RMS |
|---|---|---|---|---|---|---|---|---|---|---|---|---|---|---|---|---|---|---|---|---|---|---|---|---|---|---|---|---|
| Asset Tracker - 5 | Asset Trackers | 2023-07-29T21:12:49.000Z | 93.3 | 64.68 | 61.37 | |||||||||||||||||||||||
| Tracker - 0003 | Asset Trackers | 2023-07-29T21:13:12.000Z | 44.3 | 78.17 | 889FF2 | 57.14 | MN 2FZ-870 | |||||||||||||||||||||
| Tracker 0001 | Asset Trackers | 2023-07-29T21:12:49.000Z | 93.3 | 64.68 | 932CC3 | 61.37 | MN 2FZ-870 | |||||||||||||||||||||
| Vehicle 004 | Asset Trackers | 2023-07-29T21:13:31.000Z | 42.9 | 78.56 | 58.65 | |||||||||||||||||||||||
| Anderson Environmental Monitor | Environmental Monitors | 2023-07-29T21:13:34.000Z | 49.7 | 41.5 | 53.9 | 8.7 | 44 | 10.4 | ||||||||||||||||||||
| CBG Environmental Monitor | Environmental Monitors | 2023-07-29T21:13:42.000Z | 49.7 | 41.5 | 53.9 | 8.7 | 44 | 10.4 | ||||||||||||||||||||
| Environmental Monitor - 2 | Environmental Monitors | 2023-07-29T21:13:34.000Z | 49.7 | 41.5 | 53.9 | 8.7 | 44 | 10.4 | ||||||||||||||||||||
| Environmental Monitor - 3 | Environmental Monitors | 2023-07-29T21:13:34.000Z | 49.7 | 41.5 | 53.9 | 8.7 | 44 | 10.4 | ||||||||||||||||||||
| Environmental Monitor - 4 | Environmental Monitors | 2023-07-29T21:13:43.000Z | 49.7 | 41.5 | 53.9 | 8.7 | 44 | 10.4 | ||||||||||||||||||||
| Environmental Monitor - 5 | Environmental Monitors | 2023-07-29T21:13:34.000Z | 49.7 | 41.5 | 53.9 | 8.7 | 44 | 10.4 | ||||||||||||||||||||
| Pump - 1 | Pump 1000 Model | 2023-07-29T21:12:32.000Z | 91.86 | 2.24 | 25.24 | 74456LK | 37.74 | 90.13 | 1900.87 | 16.36 | ||||||||||||||||||
| Pump - 1 | Pump 1000 Model | 2023-07-29T21:12:32.000Z | 91.86 | 2.24 | 25.24 | 37.74 | 90.13 | 1900.87 | 16.36 | |||||||||||||||||||
| Pump - 2 | Pump 1000 Model | 2023-07-29T21:12:32.000Z | 91.86 | 2.24 | 25.24 | 37.74 | 90.13 | 1900.87 | 16.36 | |||||||||||||||||||
| Pump - 2 | Pump 1000 Model | 2023-07-29T21:12:36.000Z | 91.86 | 2.24 | 25.24 | 4TF323 | 37.74 | 90.13 | 1900.87 | 16.36 | ||||||||||||||||||
| Pump - 3 | Pump 1000 Model | 2023-07-29T21:12:32.000Z | 91.86 | 2.24 | 25.24 | 37.74 | 90.13 | 1900.87 | 16.36 | |||||||||||||||||||
| Pump 3456 | Pump 1000 Model | 2023-07-29T21:12:32.000Z | 91.86 | 2.24 | 25.24 | 37.74 | 90.13 | 1900.87 | 16.36 | |||||||||||||||||||
| Pump 43 | Pump 1000 Model | 2023-07-29T21:12:07.000Z | 115.75 | 2.49 | 27.12 | 36.97 | 95.11 | 2001 | 16.49 | |||||||||||||||||||
| Pump 45902 | Pump 1000 Model | 2023-07-29T21:12:32.000Z | 91.86 | 2.24 | 25.24 | 37.74 | 90.13 | 1900.87 | 16.36 | |||||||||||||||||||
| Pump - 12 | Pump 1000 Model | 2023-07-29T21:12:32.000Z | 91.86 | 2.24 | 25.24 | 65348GF | 37.74 | 90.13 | 1900.87 | 16.36 | ||||||||||||||||||
| Pump 2755 | Pump 1000 Model | 2023-08-07T19:31:19.000Z | 73.05 | 0 | 16.35 | 09323AB | 21.73 | 71.7 | 0 | 16.35 | ||||||||||||||||||
| Pump - 3234 | Pump 1000 Model | 2023-07-29T21:12:32.000Z | 91.86 | 2.24 | 25.24 | 37.74 | 90.13 | 1900.87 | 16.36 | |||||||||||||||||||
| Pump - 7 | Pump 1000 Model | 2023-07-29T21:12:07.000Z | 115.75 | 2.49 | 27.12 | 1463DF | 36.97 | 95.11 | 2001 | 16.49 | ||||||||||||||||||
| Pump - 8 | Pump 1000 Model | 2023-07-29T21:12:32.000Z | 91.86 | 2.24 | 25.24 | 236598HJ | 37.74 | 90.13 | 1900.87 | 16.36 | ||||||||||||||||||
| Pump - 9 | Pump 1000 Model | 2023-07-29T21:12:32.000Z | 91.86 | 2.24 | 25.24 | 34333GV | 37.74 | 90.13 | 1900.87 | 16.36 | ||||||||||||||||||
| Pump 2064 | Pump 1000 Model | 2023-07-29T21:12:07.000Z | 115.75 | 2.49 | 27.12 | 36.97 | 95.11 | 2001 | 16.49 | |||||||||||||||||||
| Pump 8324 | Pump 1000 Model | 2023-07-29T21:12:07.000Z | 115.75 | 2.49 | 27.12 | 9823GVB | 36.97 | 95.11 | 2001 | 16.49 | ||||||||||||||||||
| Pump 8344 | Pump 1000 Model | 2023-07-29T21:12:07.000Z | 115.75 | 2.49 | 27.12 | 552214TR | 36.97 | 95.11 | 2001 | 16.49 | ||||||||||||||||||
| B1001 Asset 2 | Pump 1000 Model | |||||||||||||||||||||||||||
| Pump - Site 22 | Pump 1000 Model | 2023-07-29T21:12:32.000Z | 91.86 | 2.24 | 25.24 | 37.74 | 90.13 | 1900.87 | 16.36 | |||||||||||||||||||
| Pump - Site 31 | Pump 1000 Model | 2023-07-29T21:12:32.000Z | 91.86 | 2.24 | 25.24 | 37.74 | 90.13 | 1900.87 | 16.36 | |||||||||||||||||||
| Pump 2033 | Pump 1000 Model | 2023-07-29T21:12:32.000Z | 91.86 | 2.24 | 25.24 | 23654FC | 37.74 | 90.13 | 1900.87 | 16.36 | ||||||||||||||||||
| Pump 4901 | Pump 1000 Model | 2023-07-29T21:12:32.000Z | 91.86 | 2.24 | 25.24 | 11988PL | 37.74 | 90.13 | 1900.87 | 16.36 | ||||||||||||||||||
| Pump 2001 | Pump 1000 Model | 2023-07-29T21:12:32.000Z | 91.86 | 2.24 | 25.24 | 2312CV | 37.74 | 90.13 | 1900.87 | 16.36 |
JSON Export Format
 [
    {
        "name": "Pump - 1",
        "typeName": "Pump 1000 Model",
        "timestamp": "2023-07-29T21:12:32.000Z",
        "data": [
        {
            "key": "Equipment Tag",
            "value": "74456LK"
        },
        {
            "key": "Flow",
            "value": 37.74
        },
        {
            "key": "Speed",
            "value": 1900.87
        },
        {
            "key": "Current",
            "value": 2.24
        },
        {
            "key": "Suction Pressure",
            "value": 16.36
        },
        {
            "key": "Discharge Pressure",
            "value": 25.24
        },
        {
            "key": "Pump Temperature",
            "value": 90.13
        },
        {
            "key": "Bearing Temperature",
            "value": 91.86
        },
        {
            "key": "Electrical",
            "value": null
        }
        ]
    },
    {
        "name": "Pump - 2",
        "typeName": "Pump 1000 Model",
        "timestamp": "2023-07-29T21:12:32.000Z",
        "data": [
        {
            "key": "Equipment Tag",
            "value": ""
        },
        {
            "key": "Flow",
            "value": 37.74
        },
        {
            "key": "Speed",
            "value": 1900.87
        },
        {
            "key": "Current",
            "value": 2.24
        },
        {
            "key": "Suction Pressure",
            "value": 16.36
        },
        {
            "key": "Discharge Pressure",
            "value": 25.24
        },
        {
            "key": "Pump Temperature",
            "value": 90.13
        },
        {
            "key": "Bearing Temperature",
            "value": 91.86
        },
        {
            "key": "Electrical",
            "value": null
        }
        ]
    },
    ...
]