Dashboards
Dashboards provide users with the ability to view asset signal data, information, and content in ways that make sense to that machine, equipment, or process. Dashboards may also be created at a group level to provide views of information about one or more assets.
Each Asset may include many dashboards. Dashboards are free form canvases that contain visualization panels on them to represent an overview of asset data. Users can adjust the panels layout and size on the canvas grid ("drag and drop").
Creating & Managing
Assets and Groups can have one or more dashboards. If an asset is created from a template, it will have the dashboards of that template. If an asset is created from scratch, it will by default have a default dashboard (see below), which can be edited / changed.
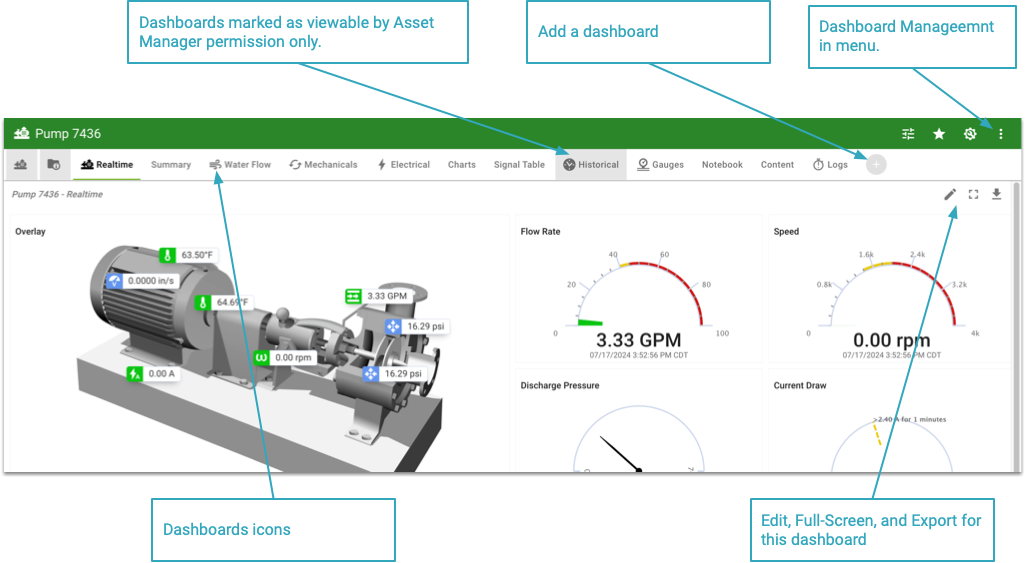
To create another dashboard for an Asset, click the plus button in the dashboard tabs or use the 'Dashboard Management' menu function.
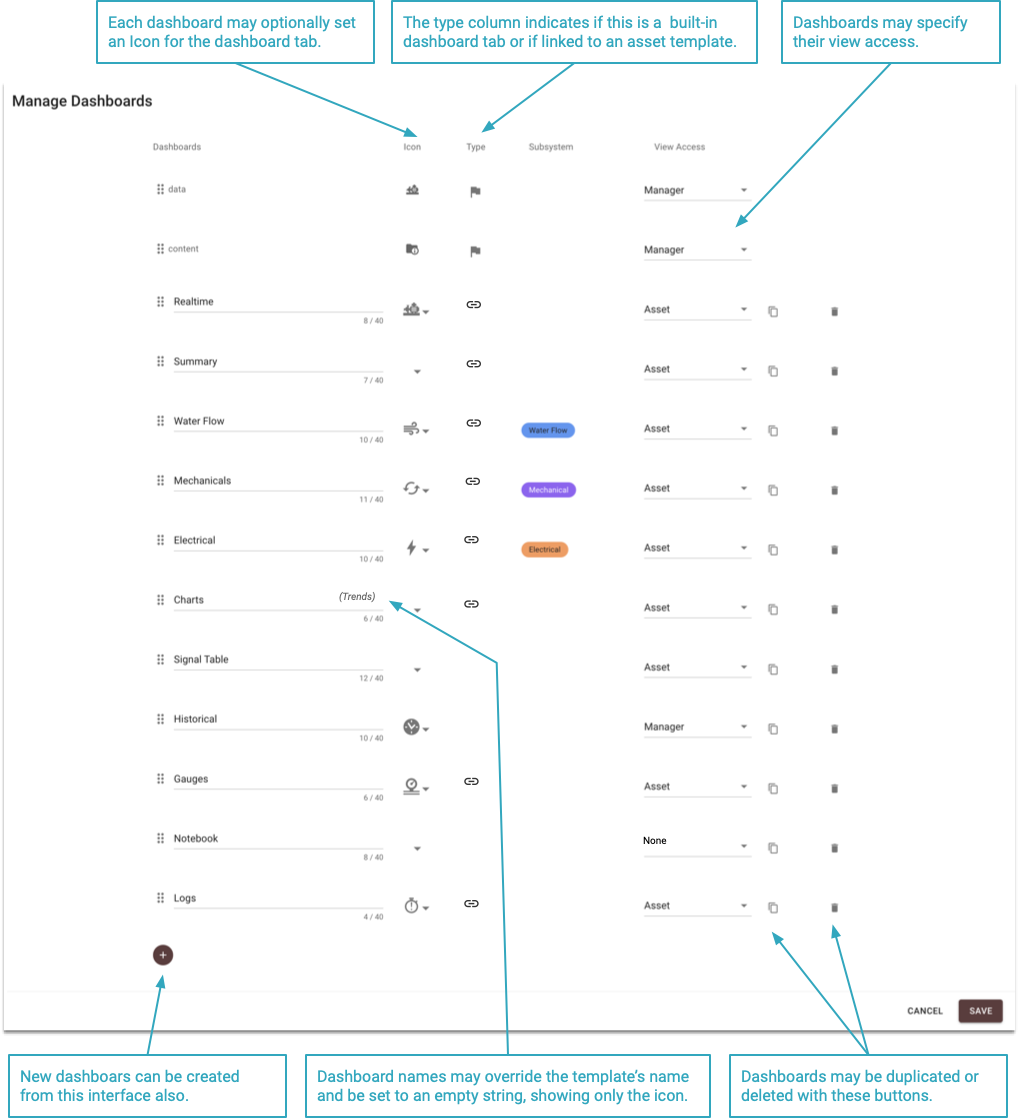
Management Functionality
- Name - The name may be edited here, including overriding the name from a template.
- Ordering - Dashboards may have their order changed by dragging them in the order you want them in the management interface.
- Icons - Each dashboard can have an optional icon. If the dashboard has no name, (empty), only the icon will be shown.
- View Access - Default is
Asset, meaning anyone who can view the asset will see this dashboard.Manageris limited to those with the Asset manager permission andNonewill not be visible to anyone, which is typically used for linked template dashboards that are not in use. - Subsystems - When the subsystem feature is in use, dashboards may be linked to a specific Subsystem.
- Duplication - Dashboards may be duplicated in the management interface.
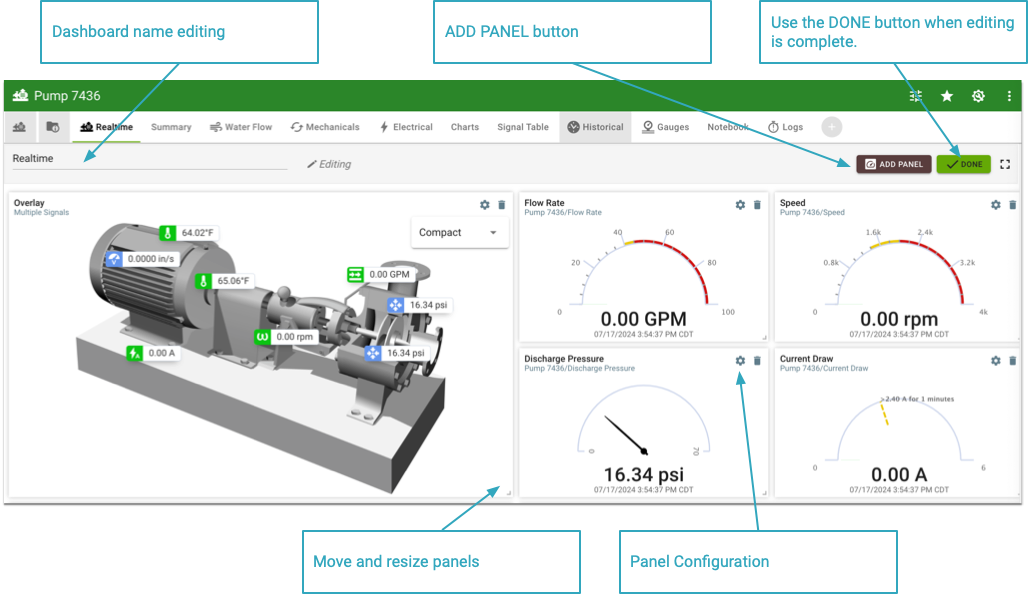
Editing
After clicking the edit icon button, the dashboard goes into 'edit' mode which allows adding new panels, moving and resizing panels on the dashboard, and configuring those dashboard panels. Panels may be duplicated onto the same dashboard. The 'Move' button allows moving a dashboard panel to another dashboard within the same Asset.
Panels
Dashboard panels are visualizations that include types like gauges, a simple number, line charts, and image overlay. Each panel itself has its own configuration options including selecting the asset data to be used and other configurable parameters such as time scale for charts.
Panel Summary
| Panel | Type | Description | Example | |
|---|---|---|---|---|
| Line Chart | Chart | A line chart showing one or more signals history. | 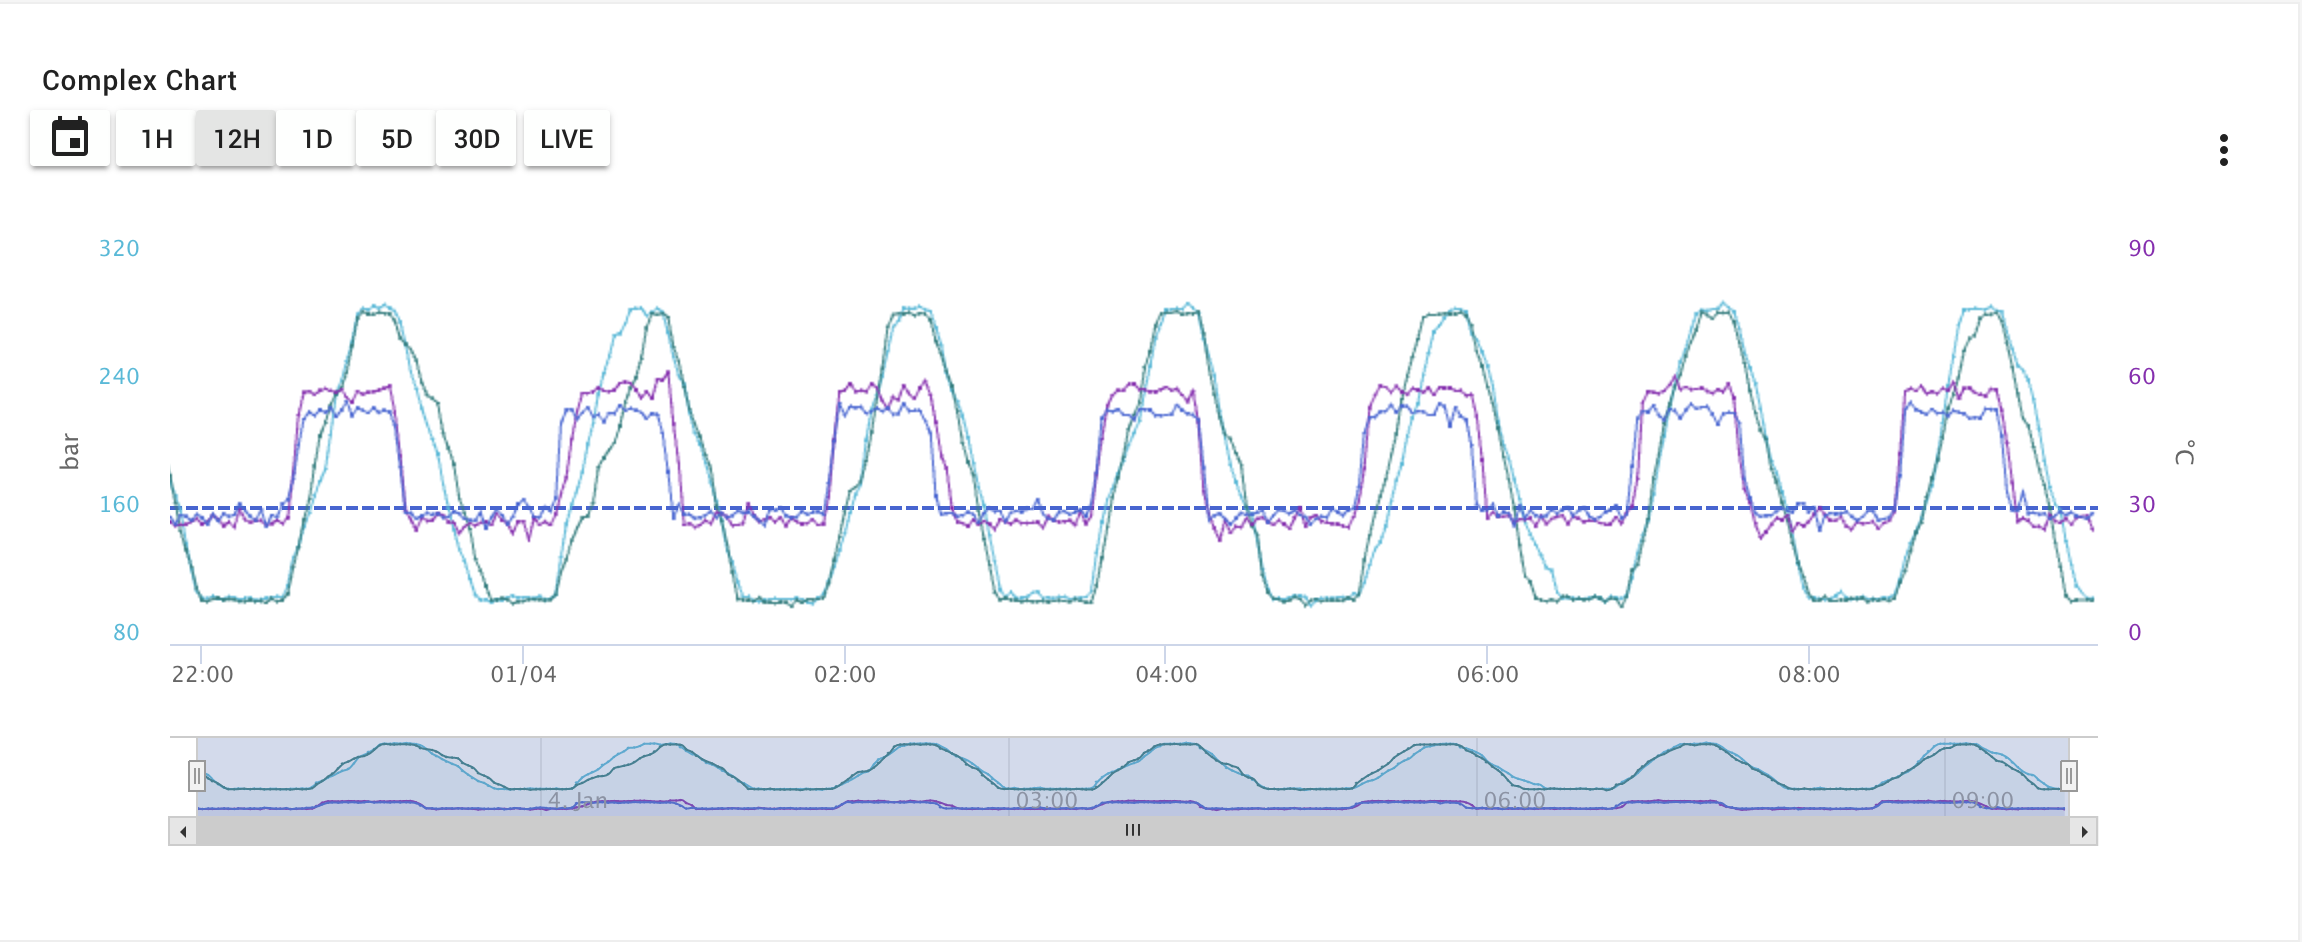 | |
| Bar / Column Chart | Chart | A bar/column chart showing one or more signals using calculations for bars/columns. | 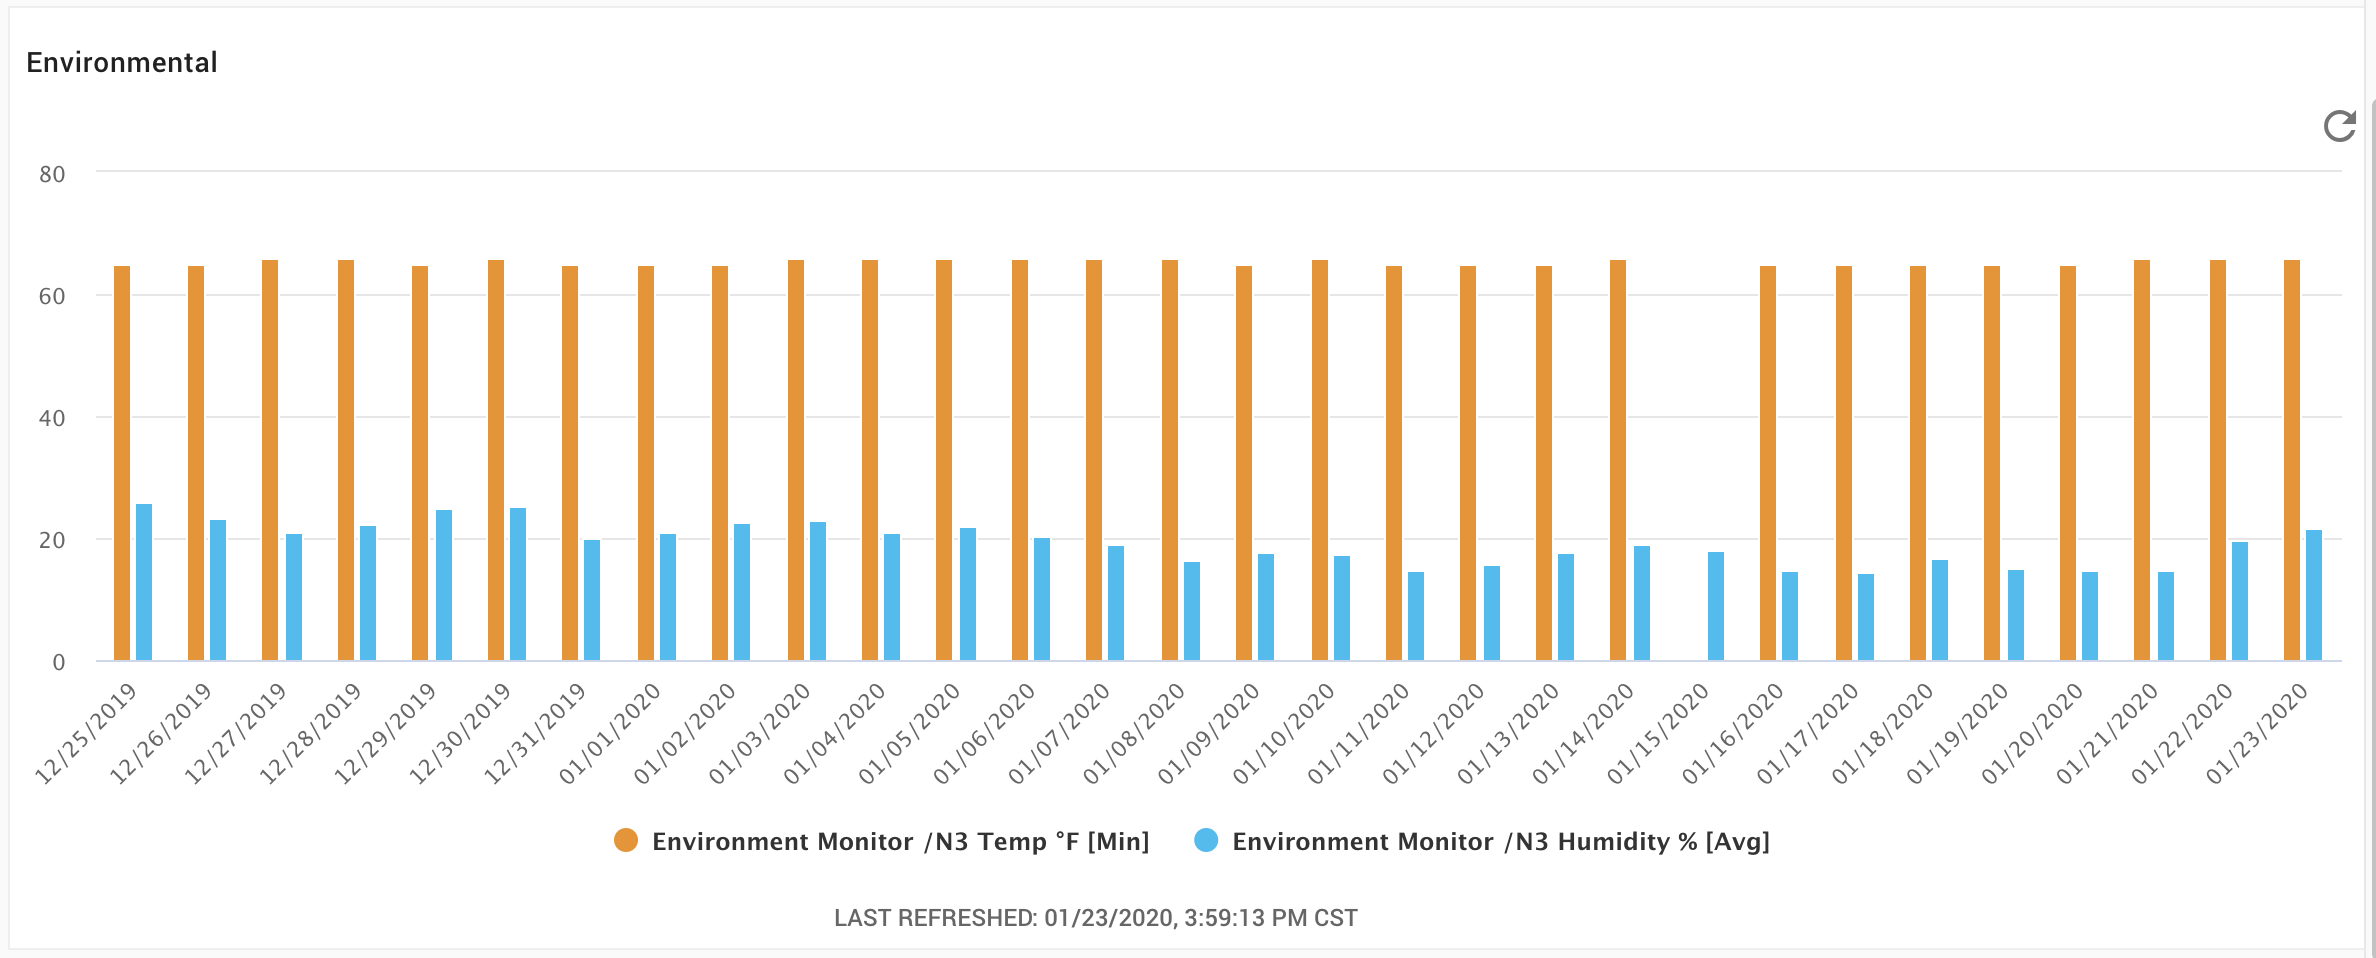 | |
| Array Data Chart | Chart | A 2d (last value) or 3d (history) chart (line, area, scatter, or bar) for array signal data. |  | |
| Operating Plot | Chart | Works with Array data type signals and metadata to plot an array of values as dots or lines. |  | |
| Dial Gauge | Gauge | A signal value as a dial gauge. |  | |
| Horizontal Gauge | Gauge | One or more signals as a horizontal gauge(s). | 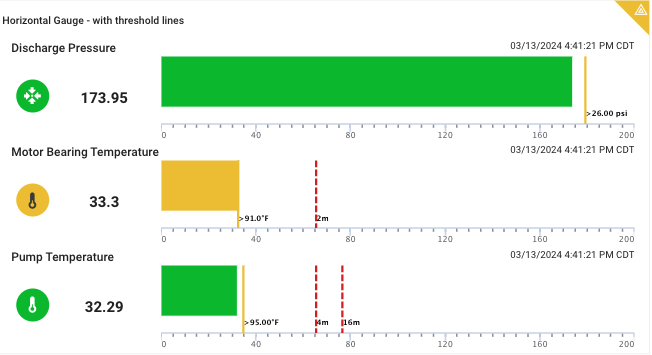 | |
| Vertical Gauge | Gauge | A signal value as a vertical gauge. |  | |
| Key Indicator | Indicator | One or more signals represented as indicators and text. |  | |
| Current Value | Indicator | Shows the latest value of a signal. |  | |
| Metadata | Table | A table that displays asset metadata. | 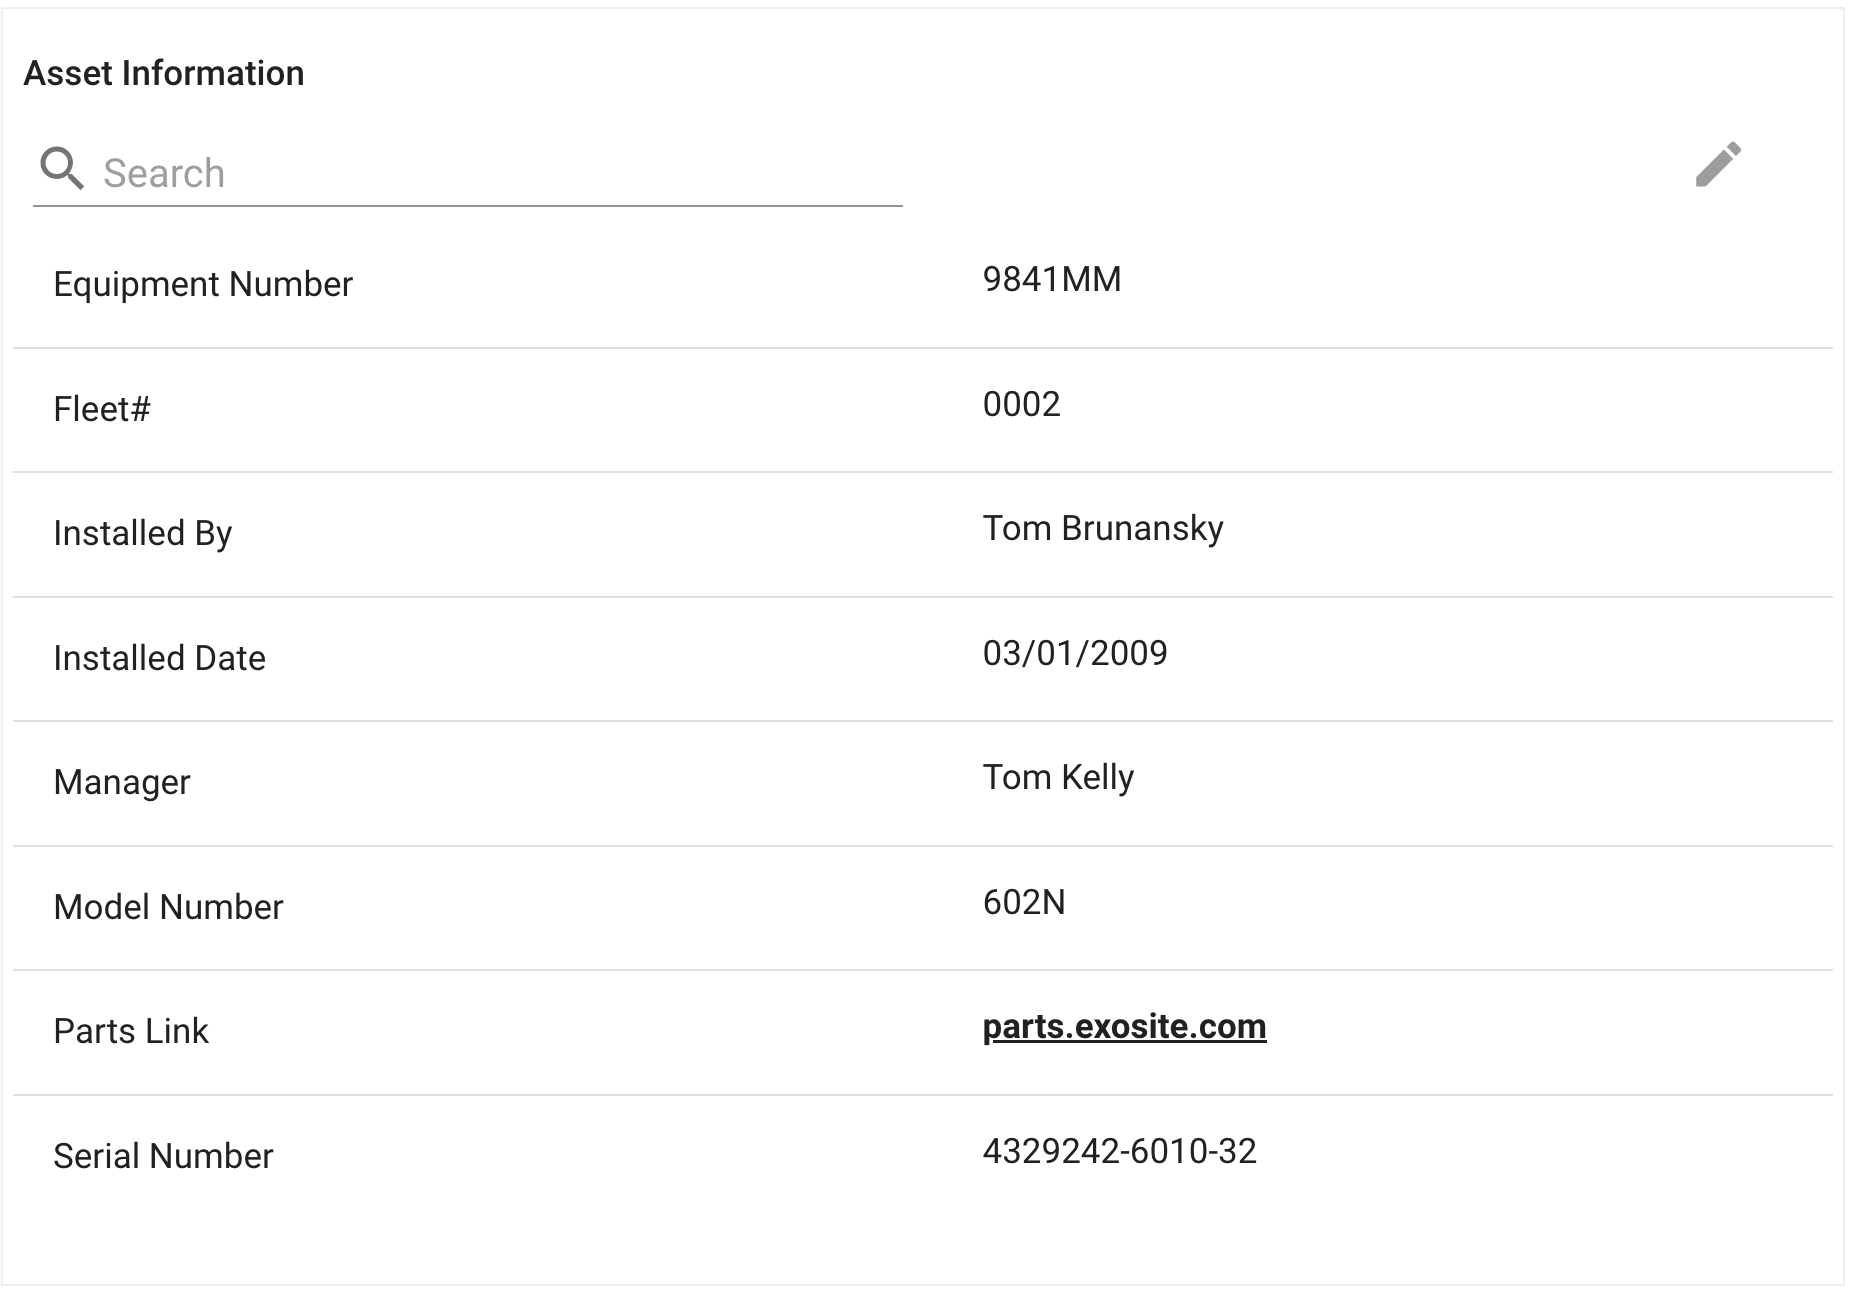 | |
| Data Table | Table | A table that displays multiple signals, current values, and optional aggregations. | 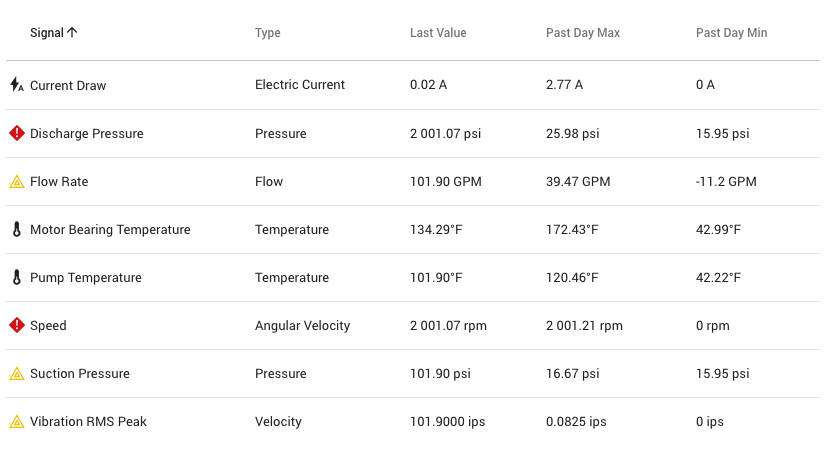 | |
| Signal History | Table | A tabular view of signal history. | 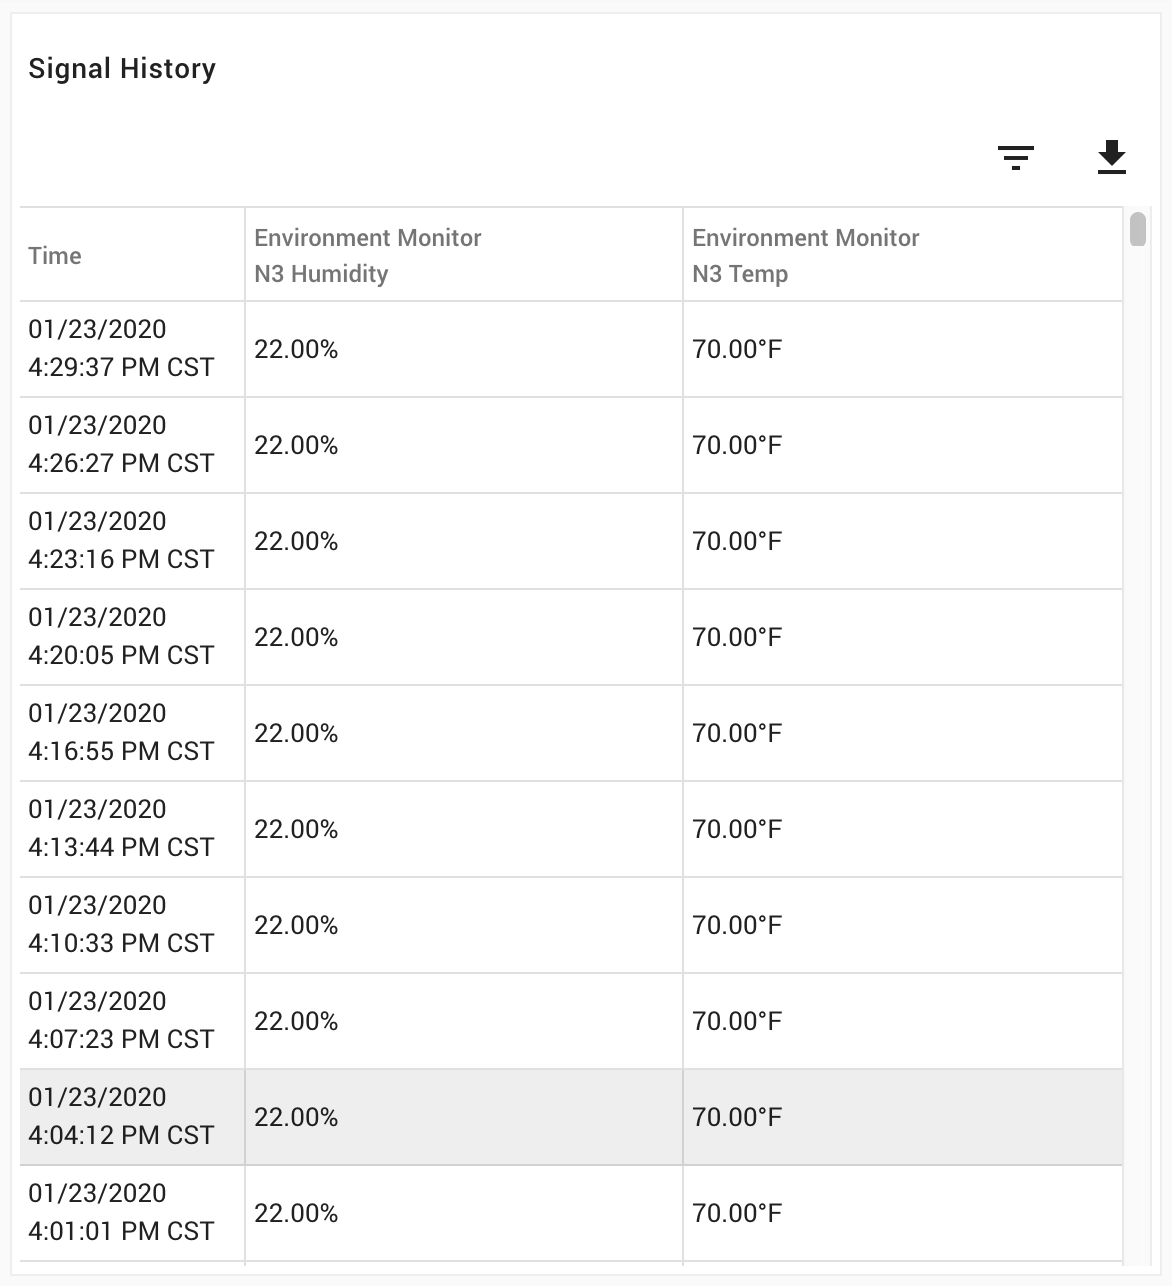 | |
| Event Log | Table | A scrollable list view of event log history. | 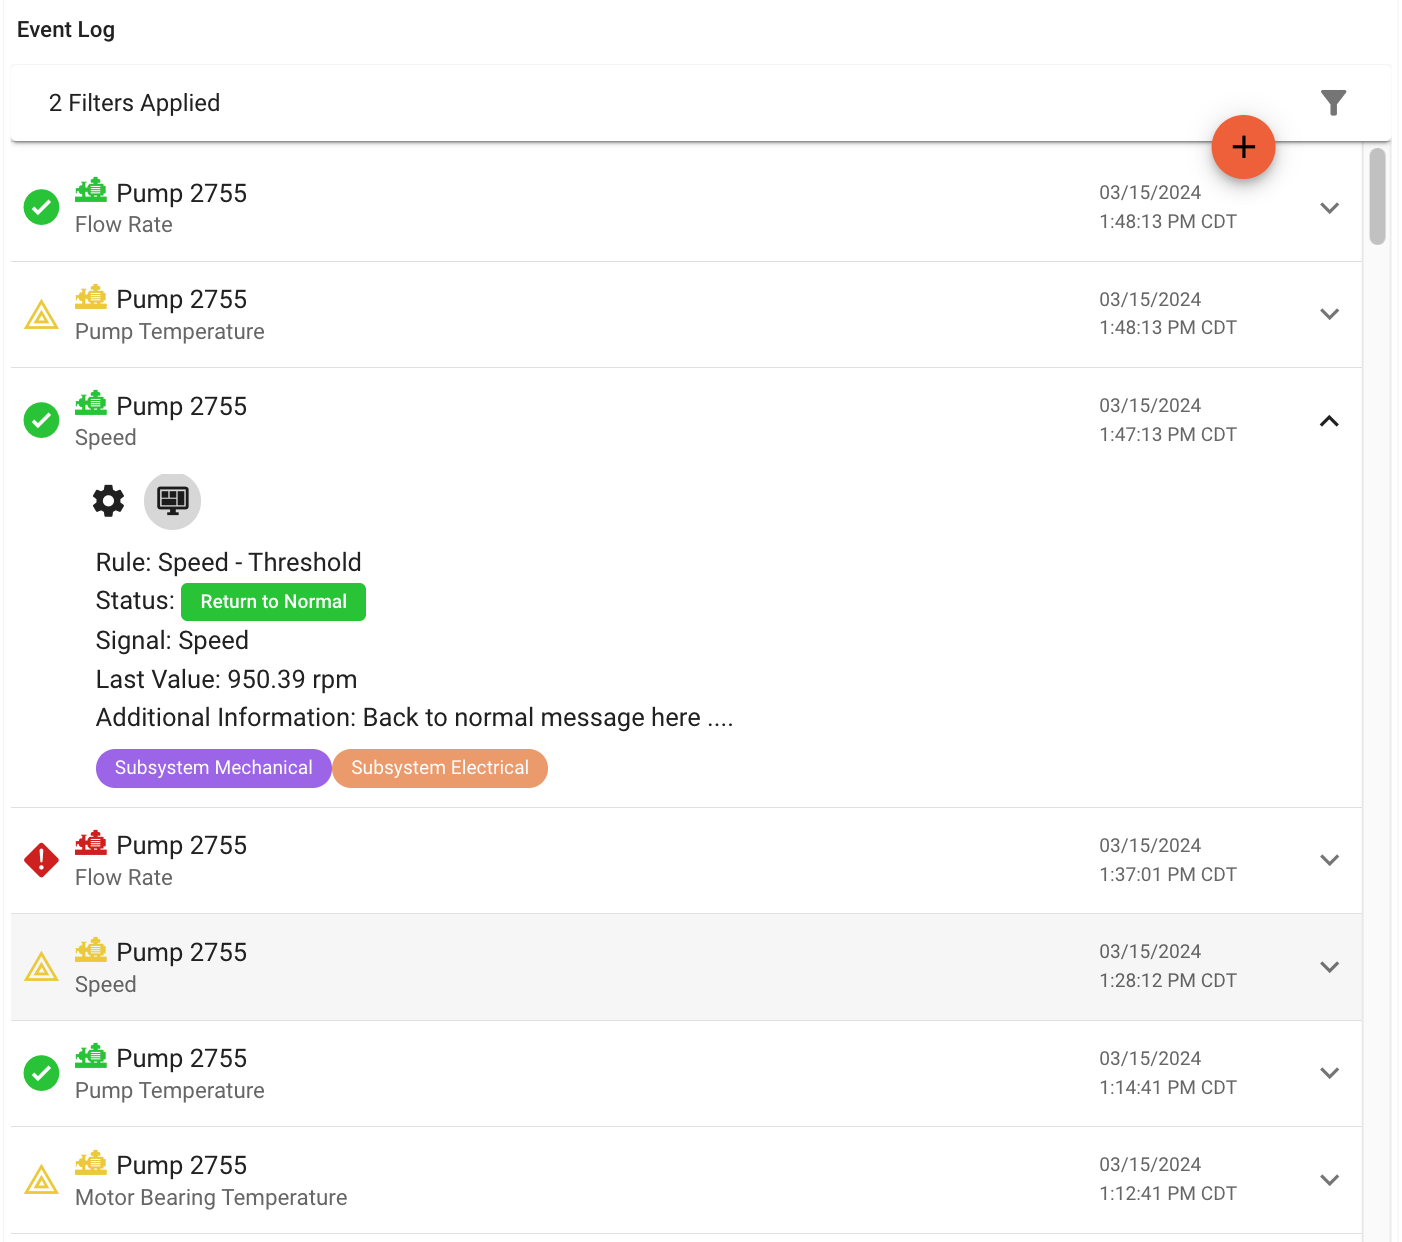 | |
| JSON Table | Table | Displays JSON signal data as a table. | 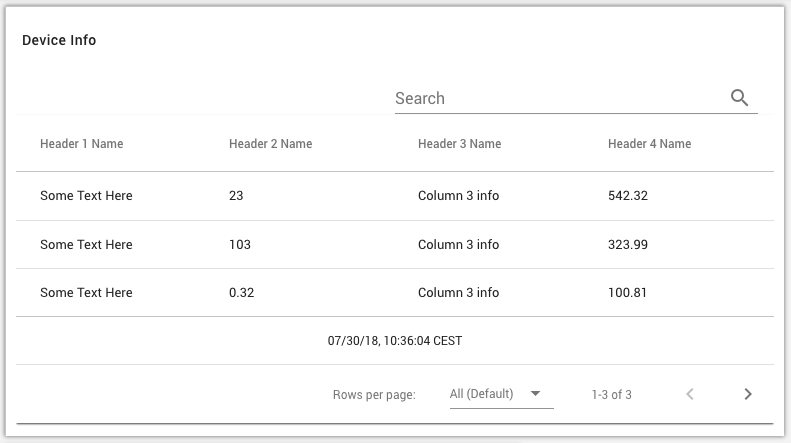 | |
| Markdown | Visual / Static | Allows creating and displaying static rich text and content. | 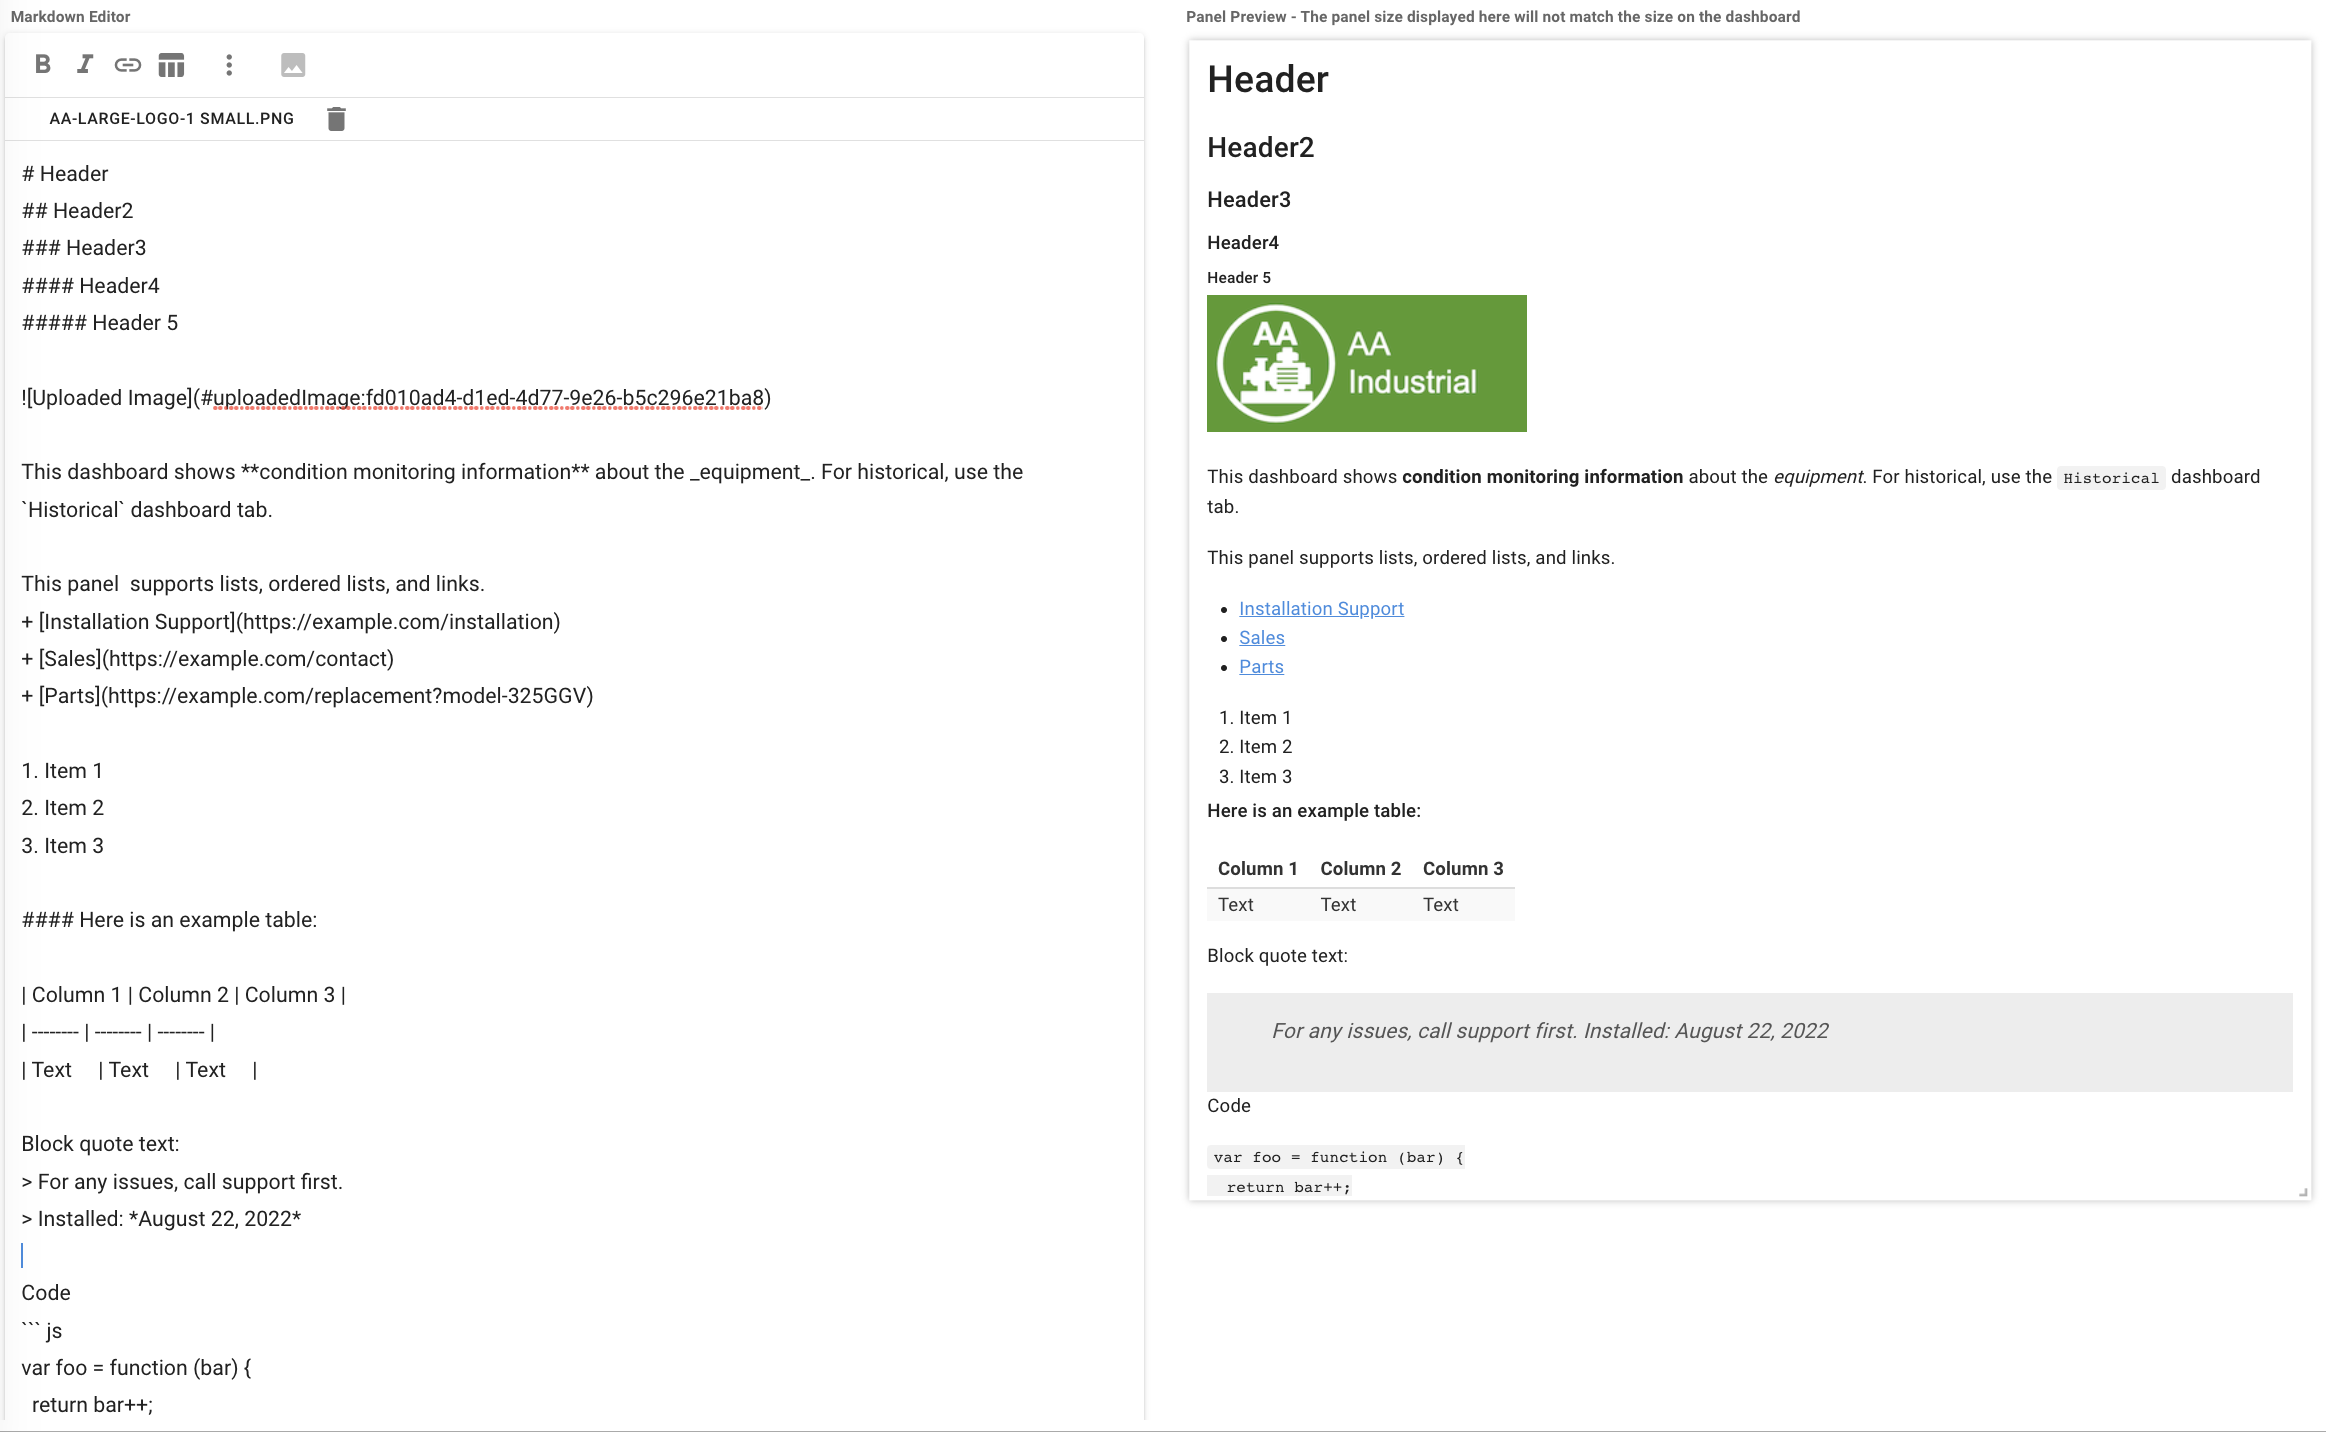 | |
| Image Overlay | Visual | Allows overlaying signal values or asset statuses over an image. |  | |
| Map | Map | Allows overlaying asset locations and status on a map. |  | |
| Dynamic Image / SVG | Visual | Signal data and status / ranges may be embedded in a SVG image to create a dynamic visual. |  | |
| Heatmap | Visual | Signal data is used as a heatmap overlay on an image. | 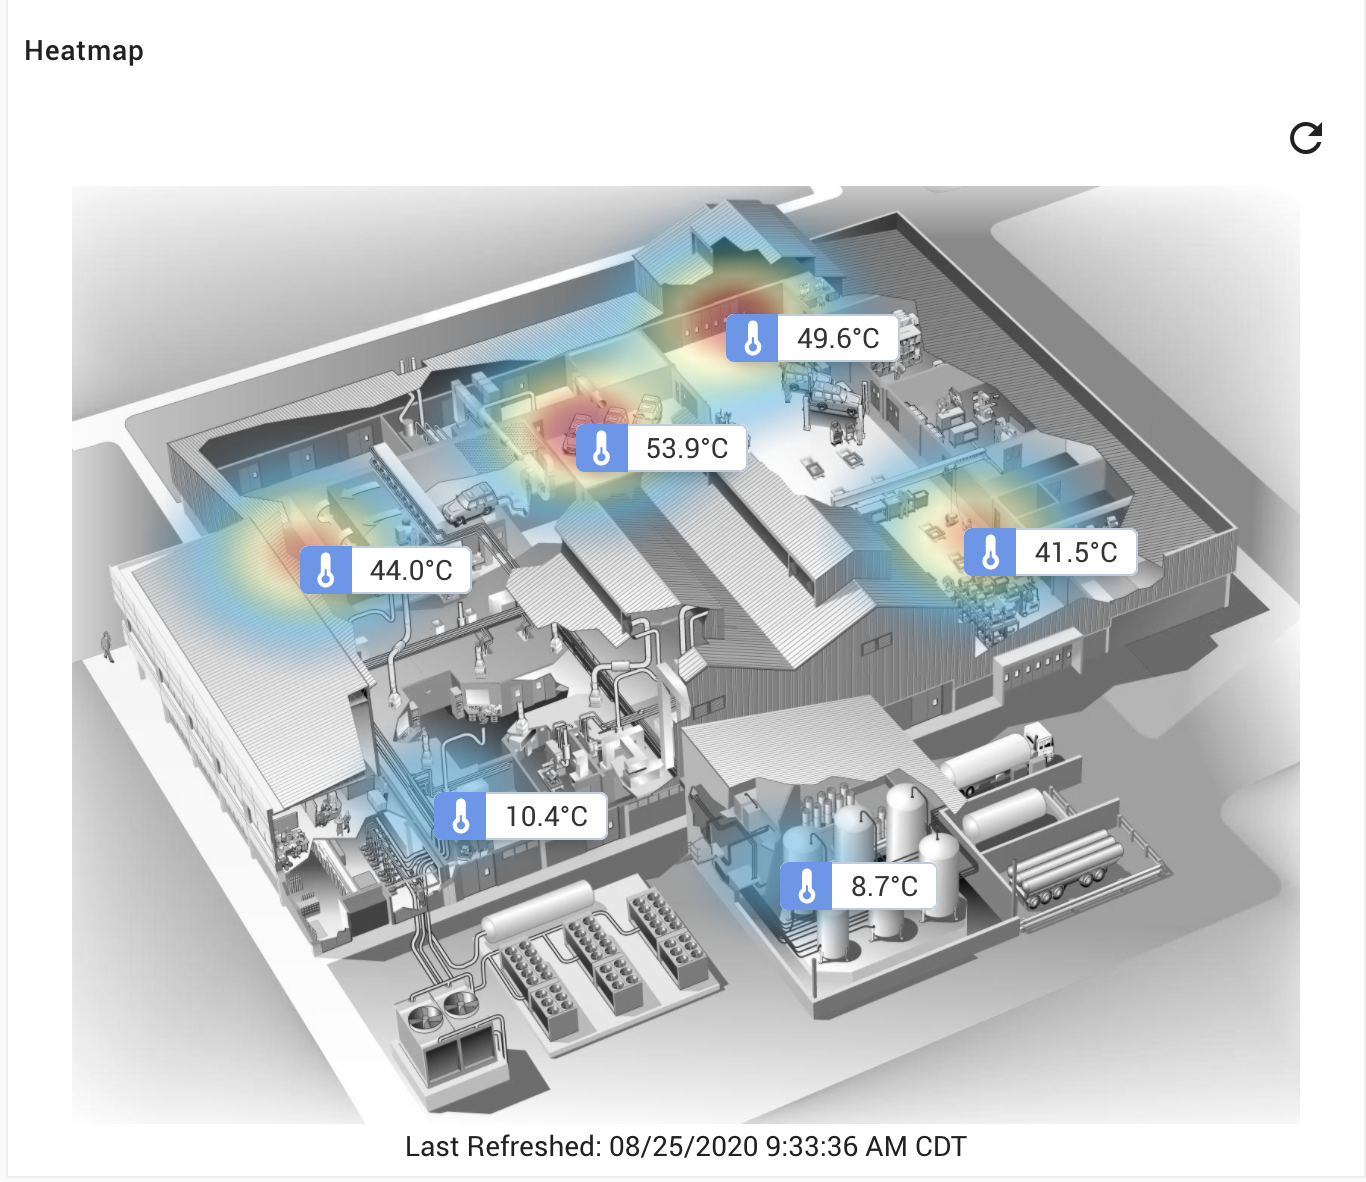 | |
| Content Viewer | Content | Allows a number of ways to display asset such as a list, text viewer, table, and image viewer. | 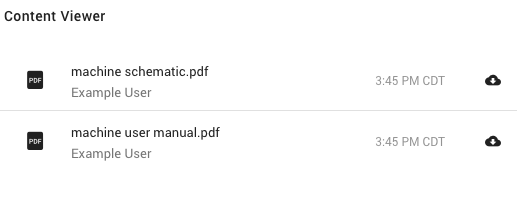 | |
| Content Line Chart | Content | The same content viewer panel but used as a line chart view of csv or json files. | 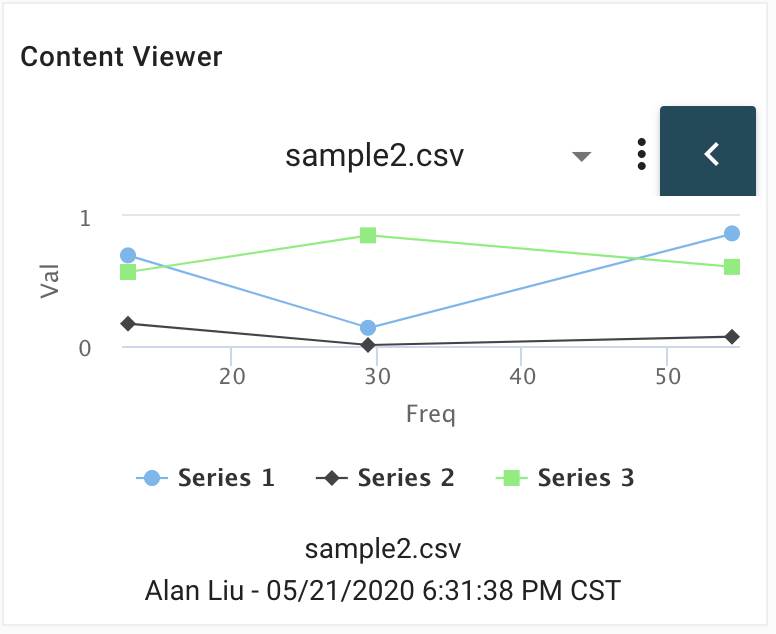 | |
| Content High Resolution | Content | The content viewer panel used to display large high resolution sets of data stored as json content. | 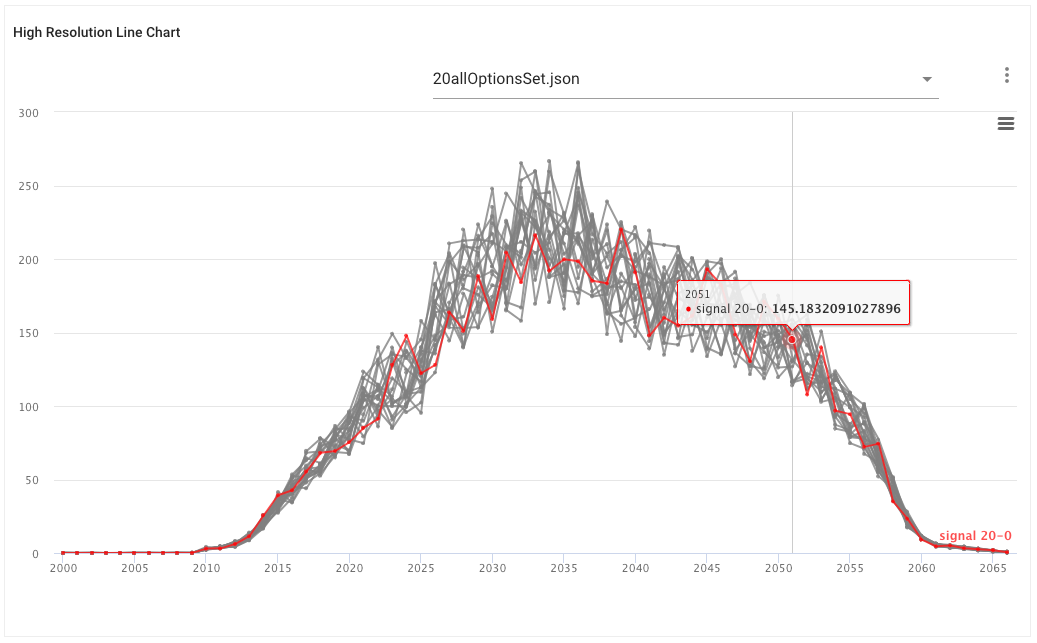 | |
| Content Pie Chart | Content | The Content viewer panel used to display data as a pie chart from content. | 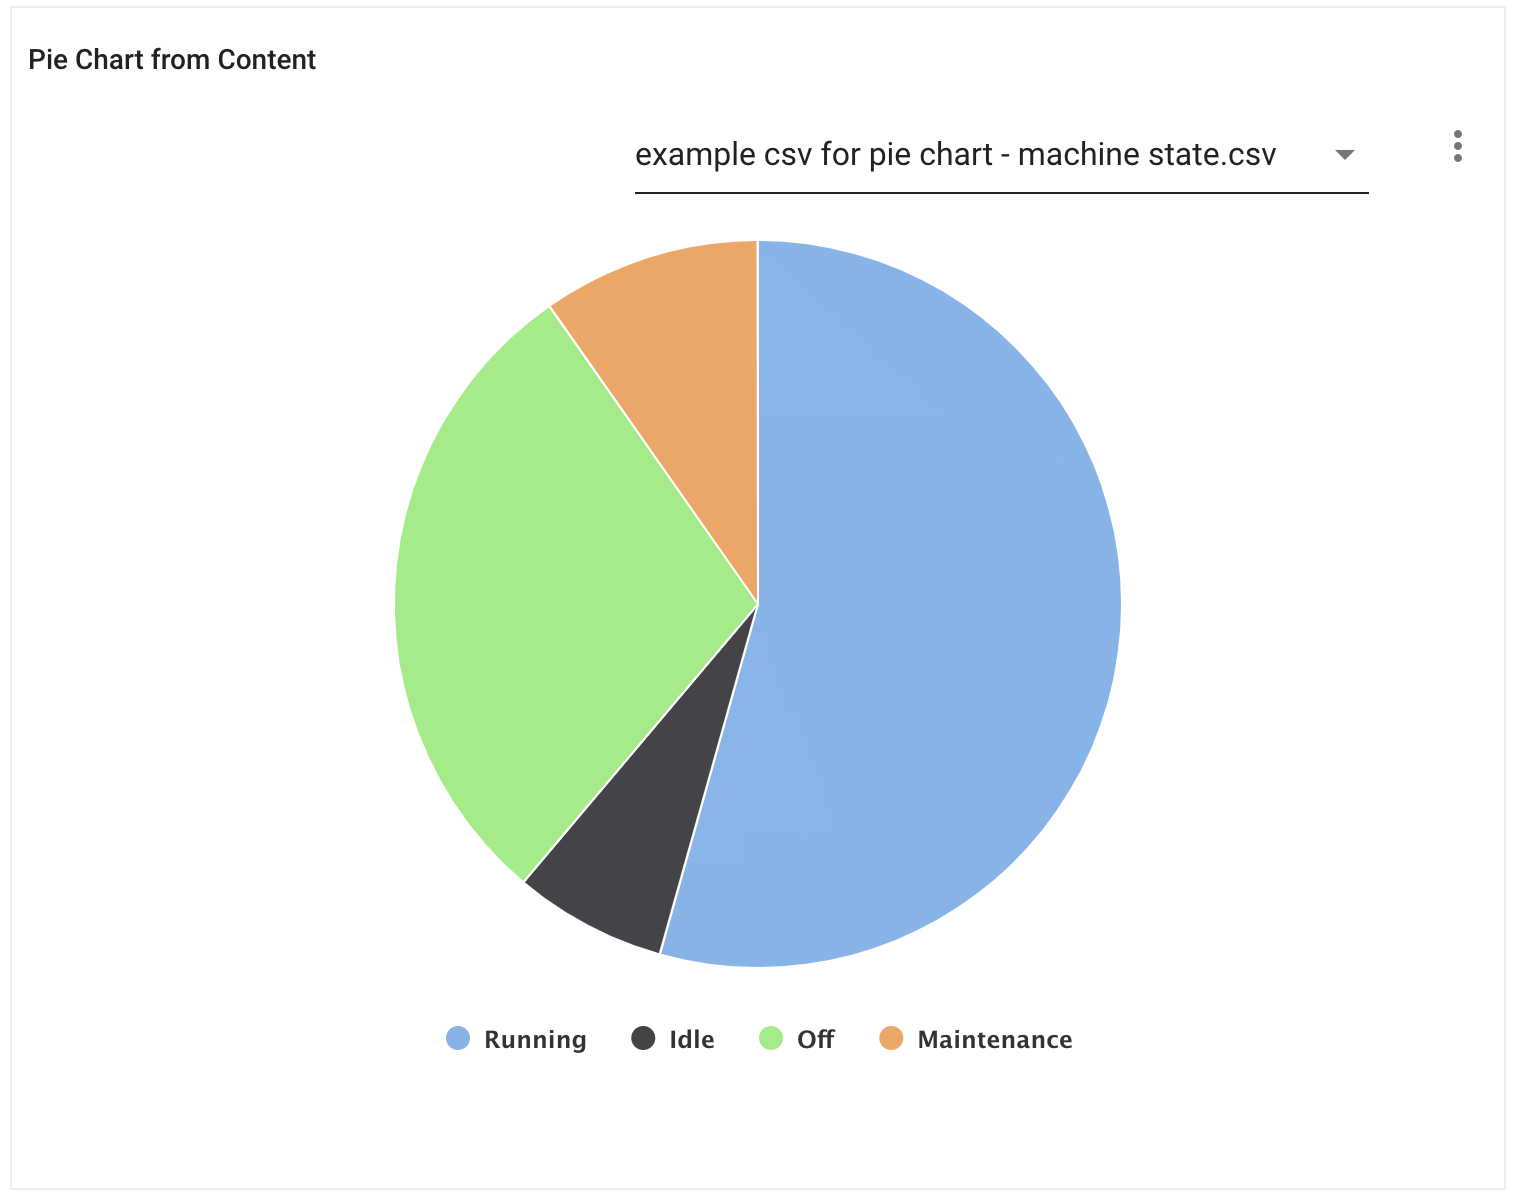 | |
| Device Control | Control / Interaction | Provides a way to send control messages to a device. Requires end to end support. |  | |
| Form Control | Control / Interaction | Provides a way to create a configurable form that allows sending control messages to a device. | 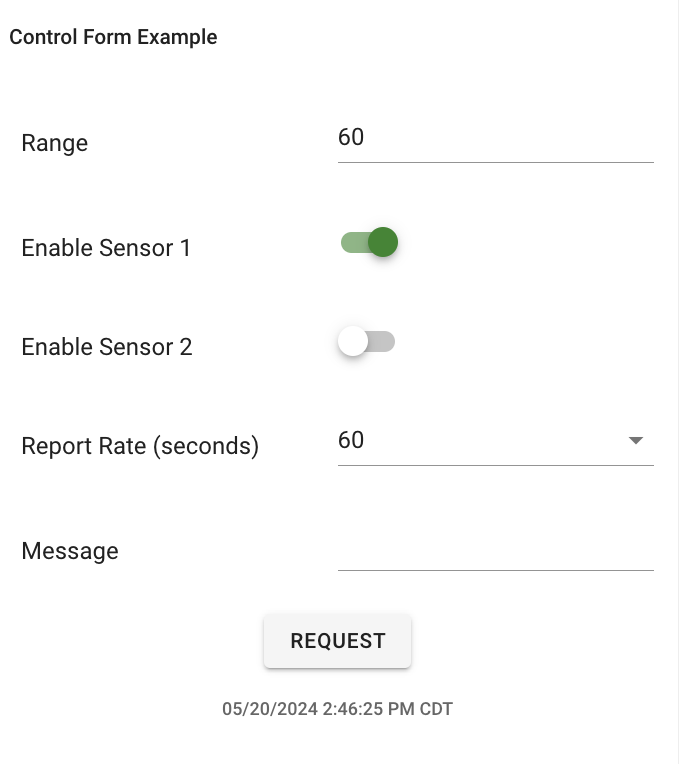 |
Info
How many panels are supported on one dashboard?
Each dashboard supports up to 15 panels.
Layout
The dashboard is made up of a 12 column grid that the panels align to and also that enforces each panels' minimum and maximum width and height.
Dashboards can be edited by any user with access permission rights to do so, including moving panels around, changing the sizes, and adding/removing panels.
To edit the layout and size of the panels, click the Lock icon to unlock the dashboard.
Template Linked Asset Dashboards
Assets that are linked to an Asset Template will have dashboards that are locked, only editable by the template managers. Additional dashboards can be added to these assets.
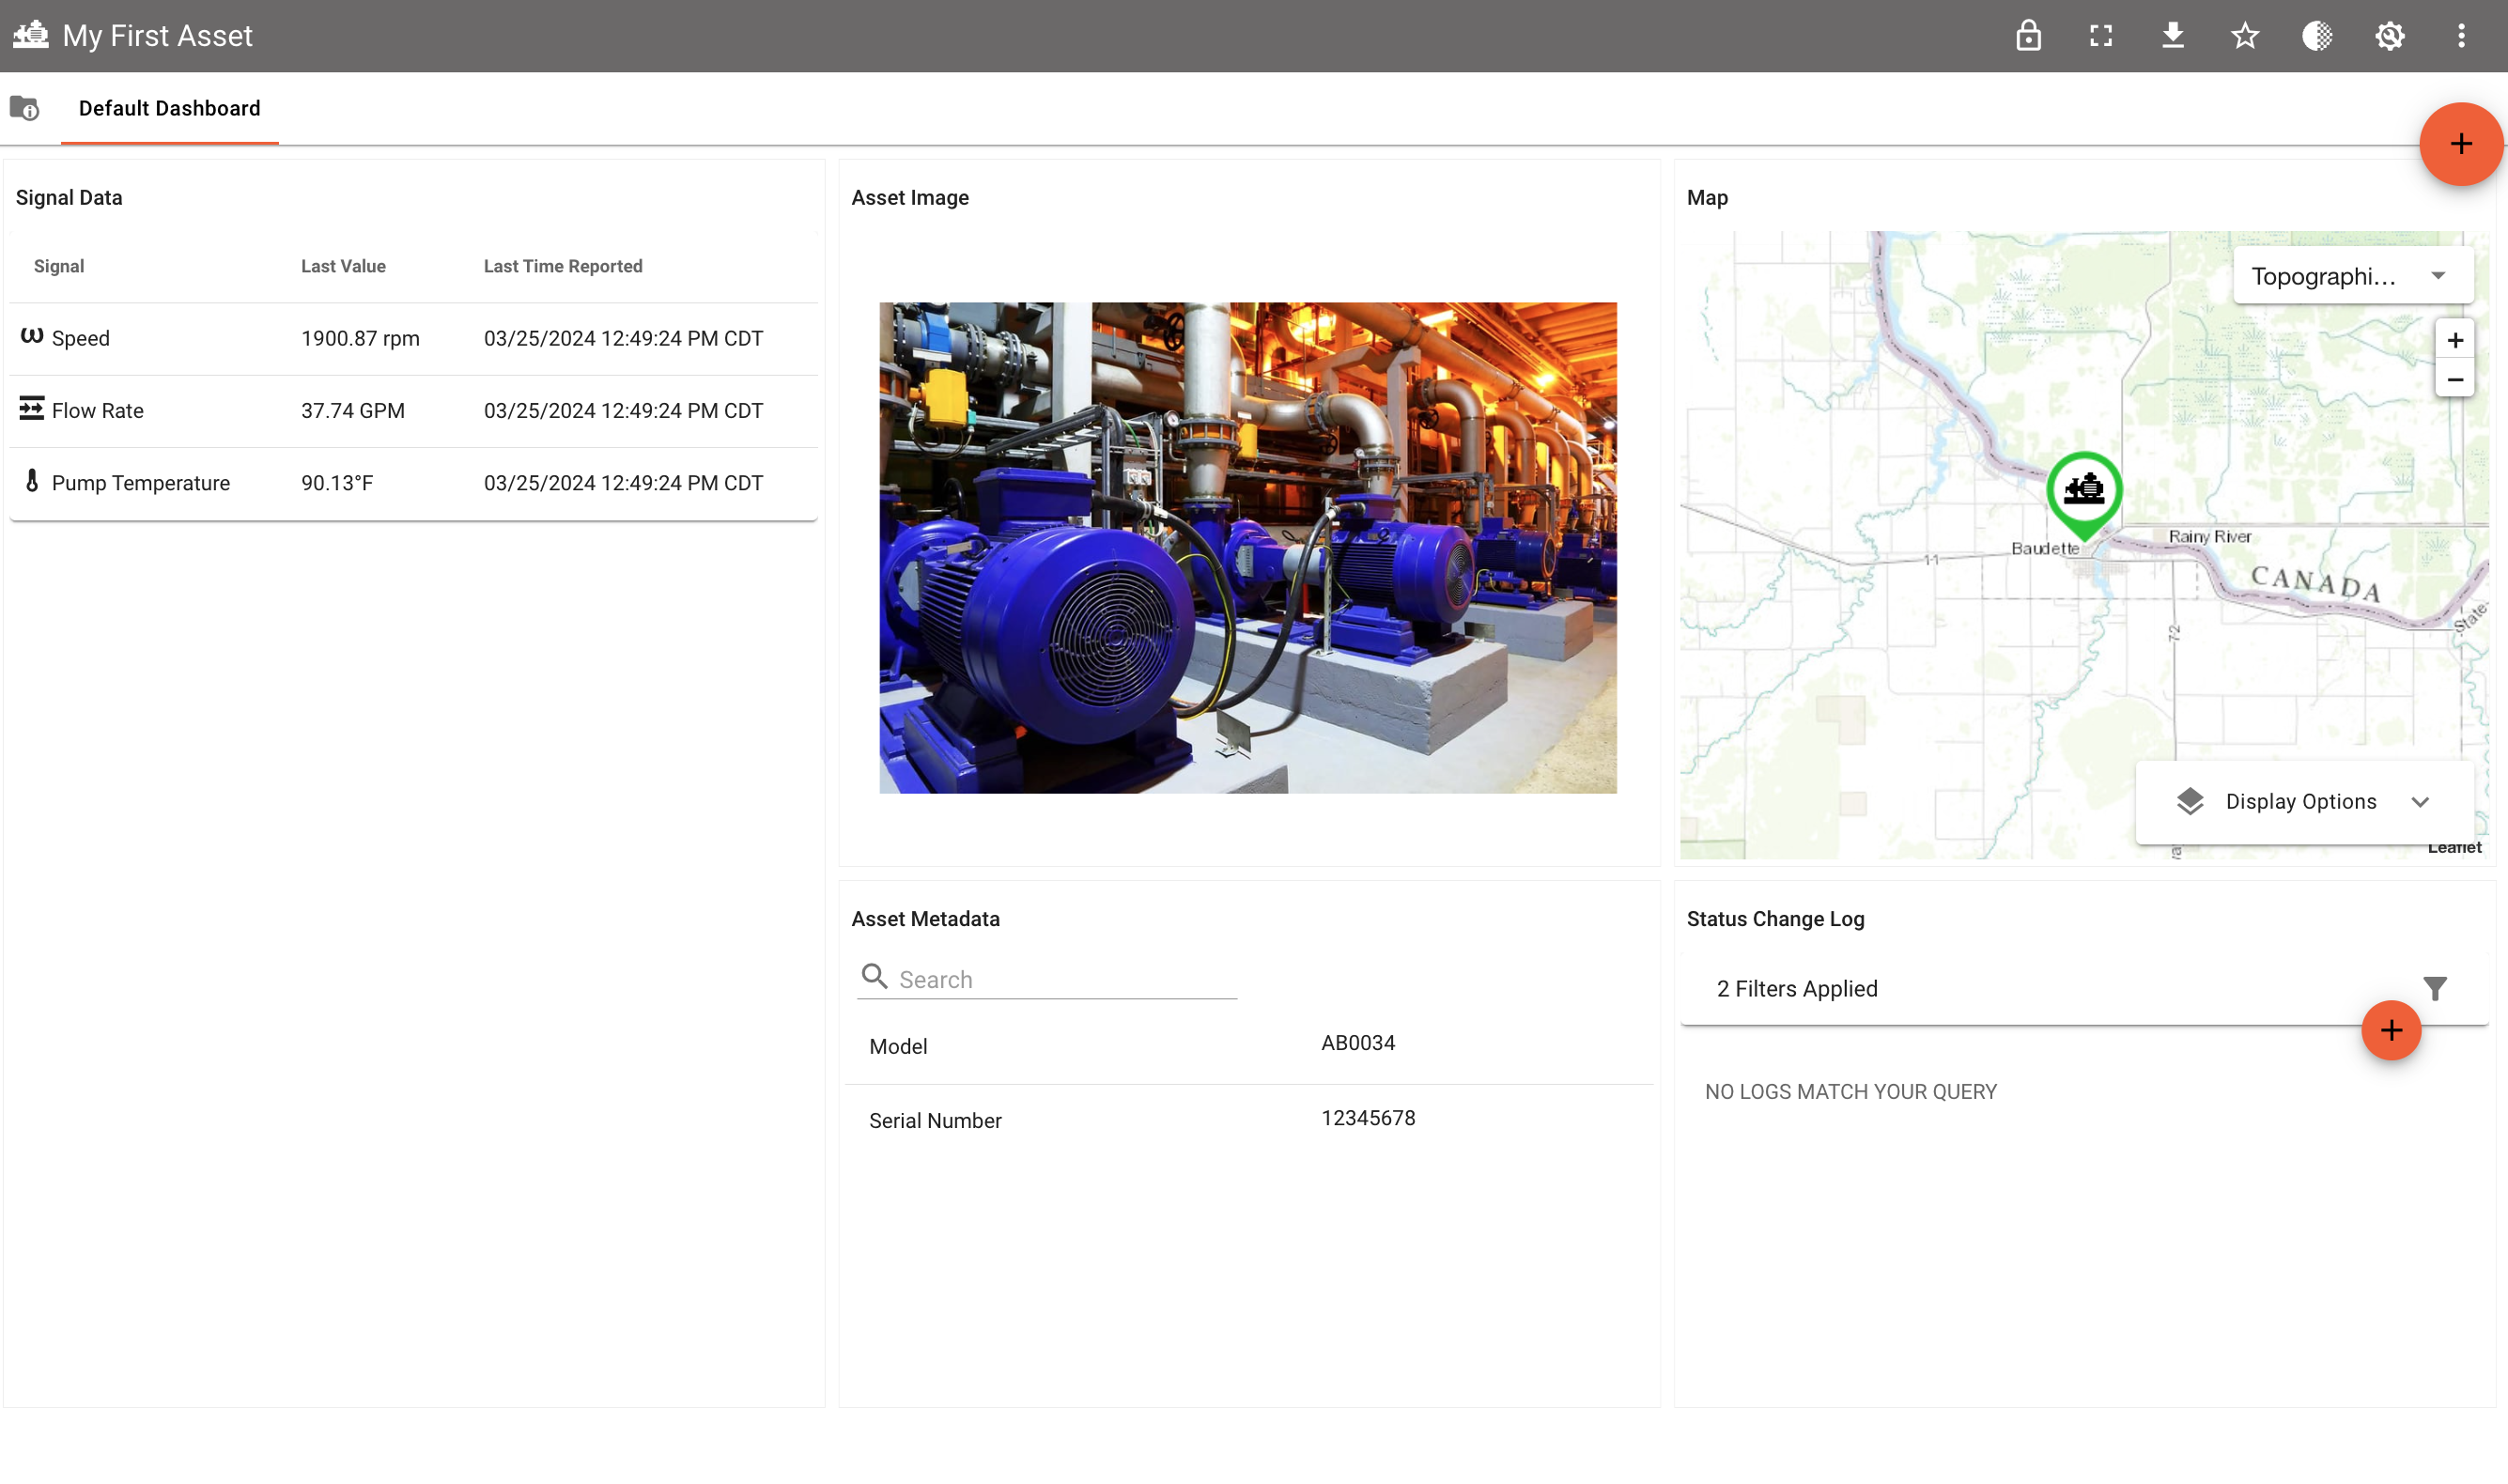
Default Dashboards
For assets created without an asset template, a pre-populated dashboard is created with the data from the asset (i.e. a default dashboard). The dashboard panels will populate as you build out your asset. This default dashboard contains:
| Content | Panel | Description |
|---|---|---|
| Asset Signals | Data Table | All signals currently in the asset. More information about Asset Signal |
| Asset Metadata | Meta Data Panel | All metadata key-value pairs currently in the asset. |
| Asset Image | Content Viewer - Image Viewer | Displays the content, of type image, that has been designated as the "Asset Image". You can set your asset image either in the content tab of the dashboard, or on the Information screen of the Modify Asset area. More information about Asset Image |
| Asset Location | Map | Displays the location of asset. More information about Asset Location |
| Asset Logs | Event Log | All status changes resulting from a rule on the asset or manually added by a user More information about Asset Rules and the Event Log |
As initially configured, these default panels will update as you update your asset (showing all signals, all meta, image, etc). You can edit layout or configuration of the panels at any time.
Exporting & Printing Dashboards
Dashboards can be exported using the 'Export Menu' icon in the upper right hand navigation. The export options include image, print, pdf, and two file output options CSV and JSON. When exporting the dashboard, it will use the current rendered data and visualizations as you see in the browser page.
This feature and specific export options may not be available on all solutions. Contact administrator for more information.
| Export Method | Description |
|---|---|
| The PDF export options allow by default exporting the entire dashboard as a single continuous view into a PDF file, which will be downloaded to your computer via your browser. You can choose in PDF mode to use page breaks and adjust the resolution. | |
| Image | The Image export options exports the entire dashboard as a single continuous image (.jpg). Image quality is adjustable as an option. |
| This will bring up the print dialog for your browser and computer. | |
| CSV | The CSV export will generate a single CSV file. Each signal from each dashboard panel (for the panels that have signal data) is a column and all data at timestamps are rows, with the first column being the timestamps. If the dashboard panel has historical signal data, it will have many values in that column. If a panel has only one value (last value), it will have only one value in the column. |
| JSON | The JSON export will generate a file that contains panel information and data values in JSON format |
CSV Export Format Example
Signal Name,Current Draw,Vibration RMS Peak,Motor Bearing Temperature,Pump Temperature,Discharge Pressure,Suction Pressure,Speed,Pump Temperature,Suction Pressure,Discharge Pressure,Speed,Speed
Asset Name,Pump 2755,Pump 2755,Pump 2755,Pump 2755,Pump 2755,Pump 2755,Pump 2755,,,,,Pump 2755
Panel Name,Vibration vs Speed,Vibration vs Speed,Operating,Operating,Operating,Operating,Speed,Overview,Overview,Overview,Overview,Speed
Panel Type,complexlinechart,complexlinechart,horizontalgauge,horizontalgauge,horizontalgauge,horizontalgauge,linechart,dynamicgraphic,dynamicgraphic,dynamicgraphic,dynamicgraphic,moongauge
Signal Type,ELEC_CURRENT,VELOCITY,TEMPERATURE,TEMPERATURE,PRESSURE,PRESSURE,ANGULAR_VEL,TEMPERATURE,PRESSURE,PRESSURE,ANGULAR_VEL,ANGULAR_VEL
Signal Units,A,in/s,°F,°F,psi,psi,rpm,°F,psi,psi,rpm,rpm
Datapoints,,,,,,,,,,,,
2023-08-04T20:18:26.000Z,2.44,0.0167,,,,,2001.01,,,,,
2023-08-04T20:18:36.000Z,2.46,0.016,,,,,2000.99,,,,,
2023-08-04T20:18:46.000Z,2.47,0.0257,,,,,2001,,,,,
2023-08-04T20:18:56.000Z,2.5,0.0392,,,,,2001,,,,,
2023-08-04T20:19:06.000Z,2.5,0.0383,,,,,2000.97,,,,,
2023-08-04T20:19:16.000Z,2.51,0.0339,,,,,2000.96,,,,,
2023-08-04T20:19:27.000Z,2.31,0.0337,,,,,1900.91,,,,,
2023-08-04T20:19:37.000Z,2.21,0.0322,,,,,1900.91,,,,,
2023-08-04T20:19:47.000Z,2.2,0.0315,91.8,90.19,25.22,16.34,1900.91,90.19,16.34,25.22,1900.91,1900.91
| Signal Name | Current Draw | Vibration RMS Peak | Motor Bearing Temperature | Pump Temperature | Discharge Pressure | Suction Pressure | Speed | Pump Temperature | Suction Pressure | Discharge Pressure | Speed | Speed |
|---|---|---|---|---|---|---|---|---|---|---|---|---|
| Asset Name | Pump 2755 | Pump 2755 | Pump 2755 | Pump 2755 | Pump 2755 | Pump 2755 | Pump 2755 | Pump 2755 | ||||
| Panel Name | Vibration vs Speed | Vibration vs Speed | Operating | Operating | Operating | Operating | Speed | Overview | Overview | Overview | Overview | Speed |
| Panel Type | complexlinechart | complexlinechart | horizontalgauge | horizontalgauge | horizontalgauge | horizontalgauge | linechart | dynamicgraphic | dynamicgraphic | dynamicgraphic | dynamicgraphic | moongauge |
| Signal Type | ELEC_CURRENT | VELOCITY | TEMPERATURE | TEMPERATURE | PRESSURE | PRESSURE | ANGULAR_VEL | TEMPERATURE | PRESSURE | PRESSURE | ANGULAR_VEL | ANGULAR_VEL |
| Signal Units | A | in/s | °F | °F | psi | psi | rpm | °F | psi | psi | rpm | rpm |
| Datapoints | ||||||||||||
| 2023-08-04T20:18:26.000Z | 2.44 | 0.0167 | 2001.01 | |||||||||
| 2023-08-04T20:18:36.000Z | 2.46 | 0.016 | 2000.99 | |||||||||
| 2023-08-04T20:18:46.000Z | 2.47 | 0.0257 | 2001 | |||||||||
| 2023-08-04T20:18:56.000Z | 2.5 | 0.0392 | 2001 | |||||||||
| 2023-08-04T20:19:06.000Z | 2.5 | 0.0383 | 2000.97 | |||||||||
| 2023-08-04T20:19:16.000Z | 2.51 | 0.0339 | 2000.96 | |||||||||
| 2023-08-04T20:19:27.000Z | 2.31 | 0.0337 | 1900.91 | |||||||||
| 2023-08-04T20:19:37.000Z | 2.21 | 0.0322 | 1900.91 | |||||||||
| 2023-08-04T20:19:47.000Z | 2.2 | 0.0315 | 91.8 | 90.19 | 25.22 | 16.34 | 1900.91 | 90.19 | 16.34 | 25.22 | 1900.91 | 1900.91 |
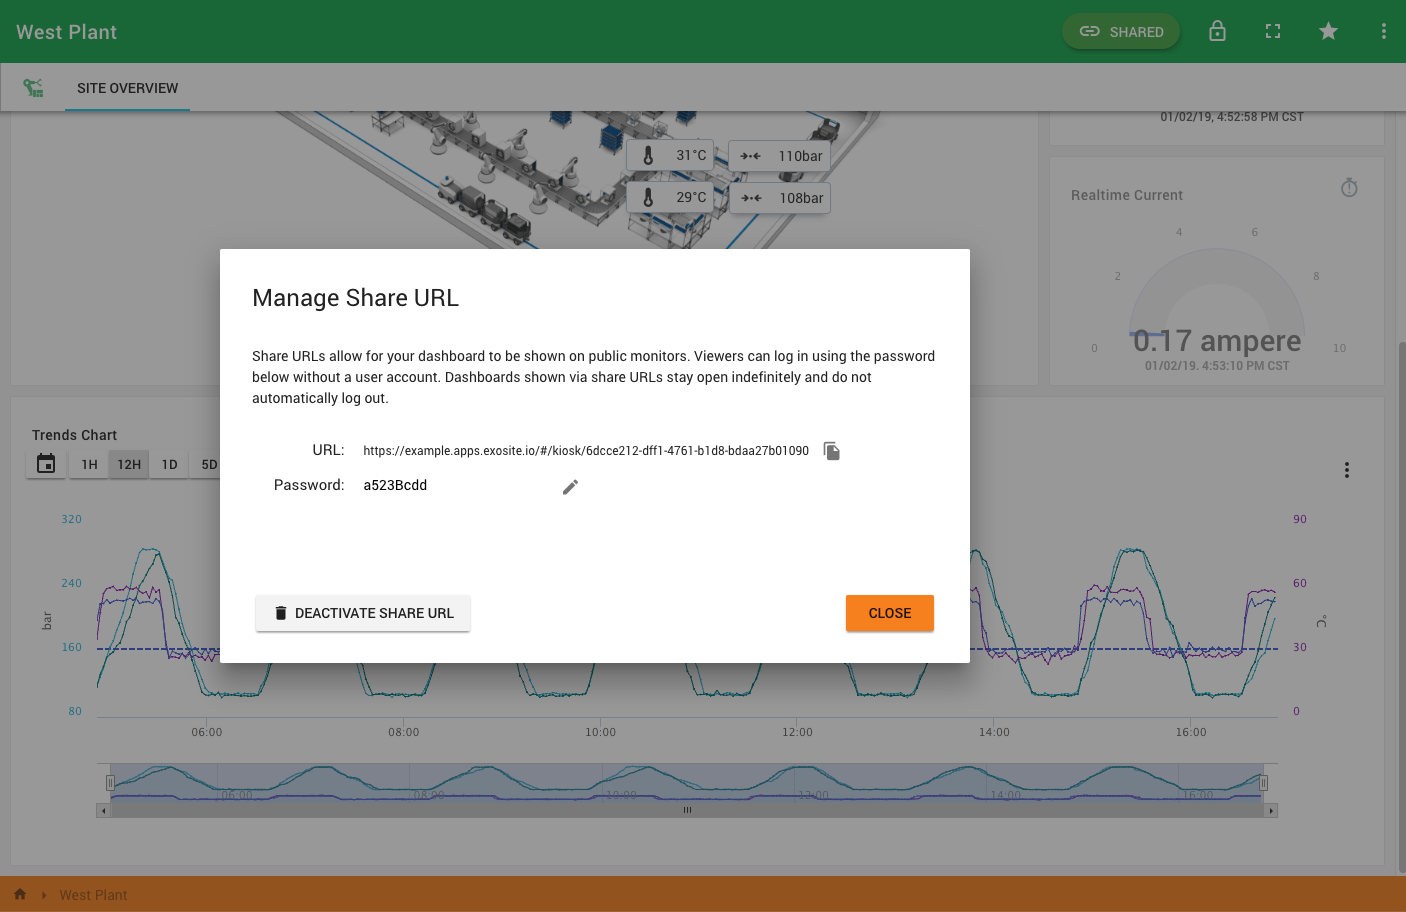
Shared Public URL Dashboards
Dashboards may be shared using a unique URL and a configurable password to allow viewing the dashboard without a normal user log-in. When using this shared dashboard URL, all navigation and editing access is removed.
When to use a public URL dashboard
For most use cases, the recommendation is to provide users with their own log-in and proper user role permissions to see information about your system. User roles can be limited to a specific group of assets and to view only if needed.
A shared public URL dashboard should be use used when necessary for things like kiosk and wall displays where a human logging in can be challenging.
Always use a complex long password.
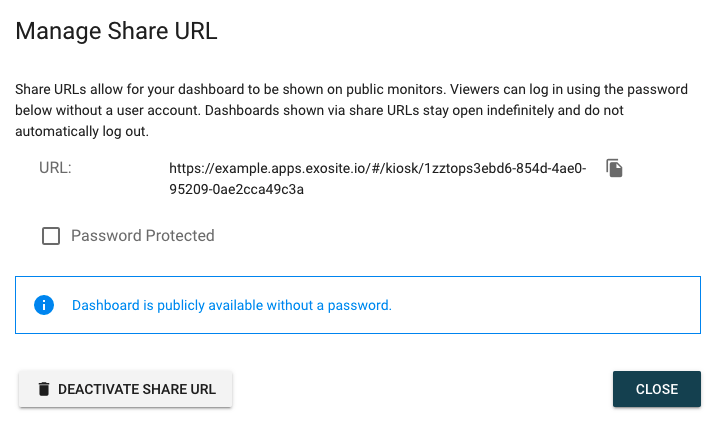
Dashboard Passwords
Shared dashboards require a password to help protect from being viewed by anyone on the public internet. It is also possible to allow dashboards with no passwords. This must be enabled by an administrator.

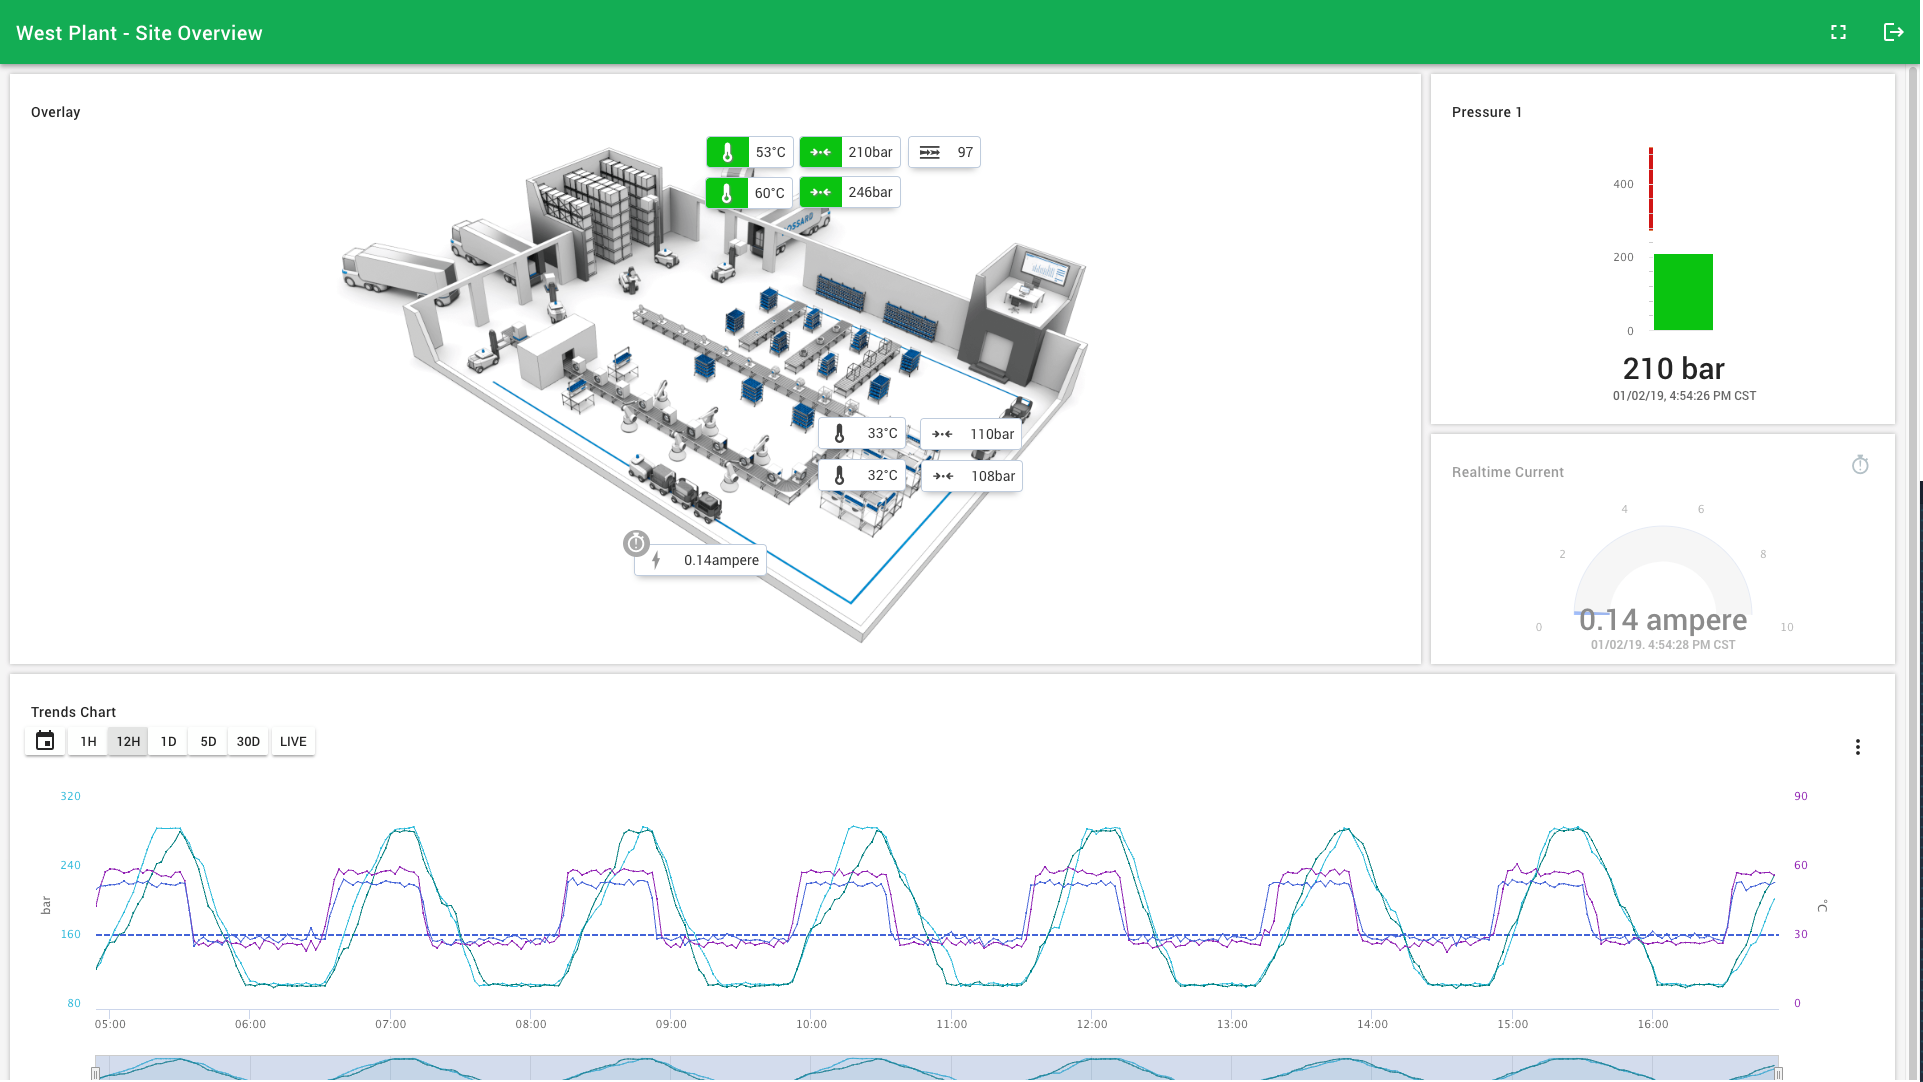
Kiosk / Full Screen
Shared dashboards were also built for supporting kiosk and full-screen mode applications where the entire dashboard filling a screen is required. Shared dashboards auto-refresh the page every 10 minutes, panels receive real-time data updates, and does not require a user to log-in, keeping important user credentials off of computers driving kiosk displays.
Info
ExoSense shared dashboards use the entire browser window. To make full screen, use the specific browser's configuration options including options to hide the browser's URL bar, bookmarks, etc. Commonly known as 'borderless' mode for a browser.
Group Dashboards
Dashboards can also be added at the group level and may contain information from assets within that group.
Shortcuts
Users may specify any dashboard (and most other pages) that they have access to as a shortcut by using the feature in the upper right corner of the header page. These will be listed in the Shortcuts side navigation menu.