Panel: Array Data Chart
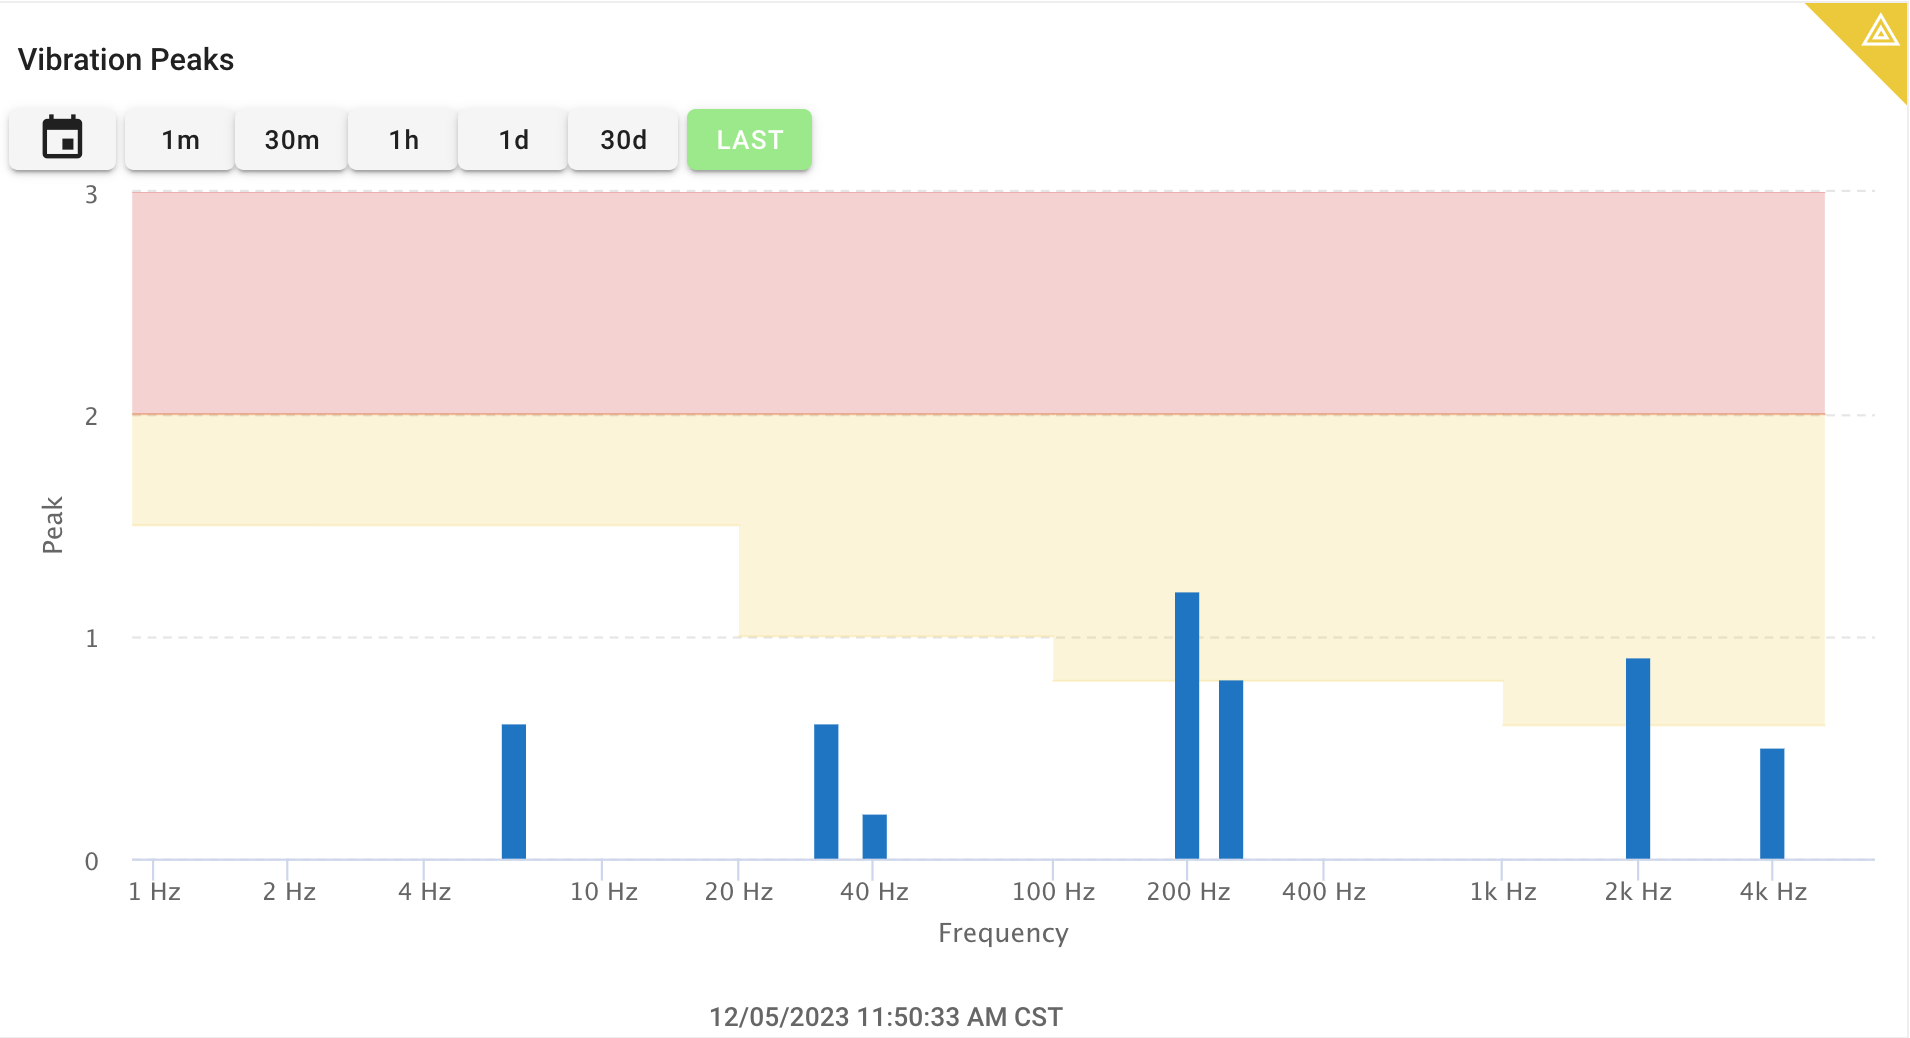
The Array Chart panel is used to chart a full array of points sent in as a Signal value. All signal values are timestamped and the majority of data is visualized based on last value or in the case of a line chart, values over time. This panel allows displaying two dimensional data such as Amplitude vs Frequency at a specific time point.
Data Format for Array Signals
The panel supports both signal types ARRAY_POINTS and ARRAY_NUMBERS, where a single value is an array of data.
Examples:
Array of Points value: [[23, 42],[10,12],[56,98.6]]
Array of Numbers value: [1,2,3,4,5,6,7,8,9,10,11,12]
In the case of an array of numbers, you may specify the 'X' indexes in the panel configuration.
Example: Logarithmic Axis and Rule Display
Example: Plotting Options
Configuration
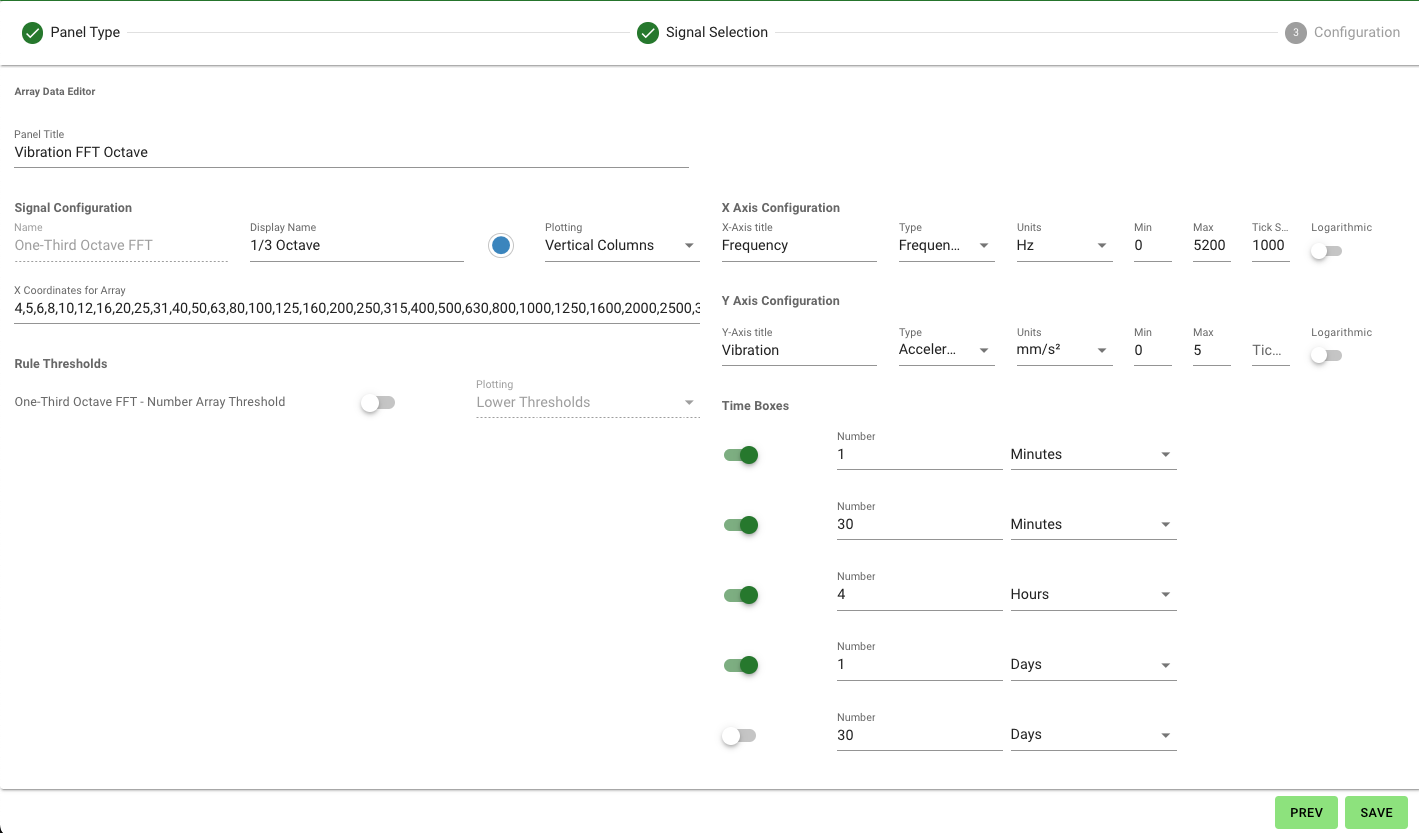
Panel and Signal
| Configuration Item | Description |
|---|---|
| Panel Title | The name the panel will use |
| Signal Display Name | Optional name that will be used for the signal instead of it's name |
| Plotting | How the points will be plotted
|
| X Coordinates for Array | Only used for type Array of Numbers. Specifies the X coordinate indexes for points. |
Axis
The following are available for both X and Y axis.
| Configuration Item | Description |
|---|---|
| Axis Title | Optional title for the Axis |
| Axis Type | Optional data type for this Axis (Default is custom text) |
| Axis Units | Optional units for the Axis based on selected type. |
| Axis Precision | Optional precision setting for values on this Axis. |
| Axis Min / Max | Allows specifying exact min and/or max for this Axis range. Will automatically range if left blank |
| Axis Tick Size | Allows specifying exact tick size for the axis range. Will automatically choose if left blank |
| Axis Logarithmic | Will apply Logarithmic scale (vs default Linear) to axis |
Rules
Array Rules, if found on the signal can be visualized on the panel. Each rule may be enabled / disabled. The Array Rules are a set of X indexes and Y ranges, essentially a 'box'. They can be visualized as either their lower Y threshold, upper Y threshold, area, or both upper and lower Y thresholds.
Historical Time Boxes
Time boxes (up to 5) can be enabled/disabled for allowing the view users to look at arrays over time (history) in a 3D view for the specified time period.
The historical 3d view supports up to 100 array values in the selected time window with no down-sampling or aggregation. Depending on report rate and time window selected, all values in a given time period may not be shown.
| Configuration Item | Description |
|---|---|
| Historical | Enable / disable the historical time boxes option |
| Historical Time Boxes | Allows specifying up to 5 time box windows to present in the panel view |
| Allow user to select specific time and dates | Enable/Disable the time box that allows users to pick a specific time window. |
| Historical Plot Type | How the points will be plotted in the 3D historical view. Options:
|
Usage Tips
How many signals can be plotted?
This panel allows plotting one array type signals at a time.
Size of 2D Array data sets
This panel should be used for array data of 200 points or less. A full resolution FFT as an example with thousands of points is not supported. (High resolution 2D or other relational may fit into content data with the high resolution line chart content viewer panel ) Please contact Exosite support for more information.
Logarithmic Axis Considerations for 0 and negative numbers
If you are planning to use a Logarithmic axis, values of 0 or negative on that axis and rule threshold indexes that use a value of 0 (example 0 to 20) will not display.