Panel: Configurable Signal Log
Overview
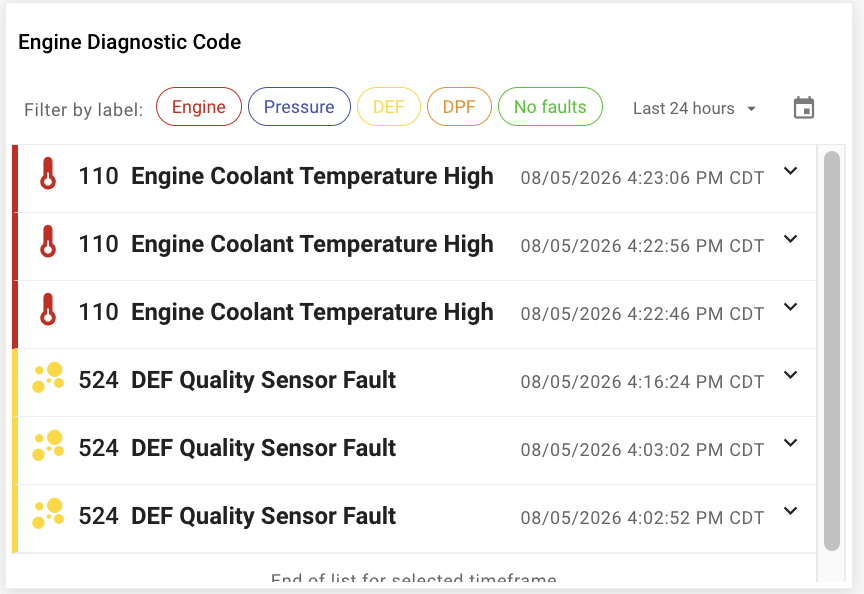
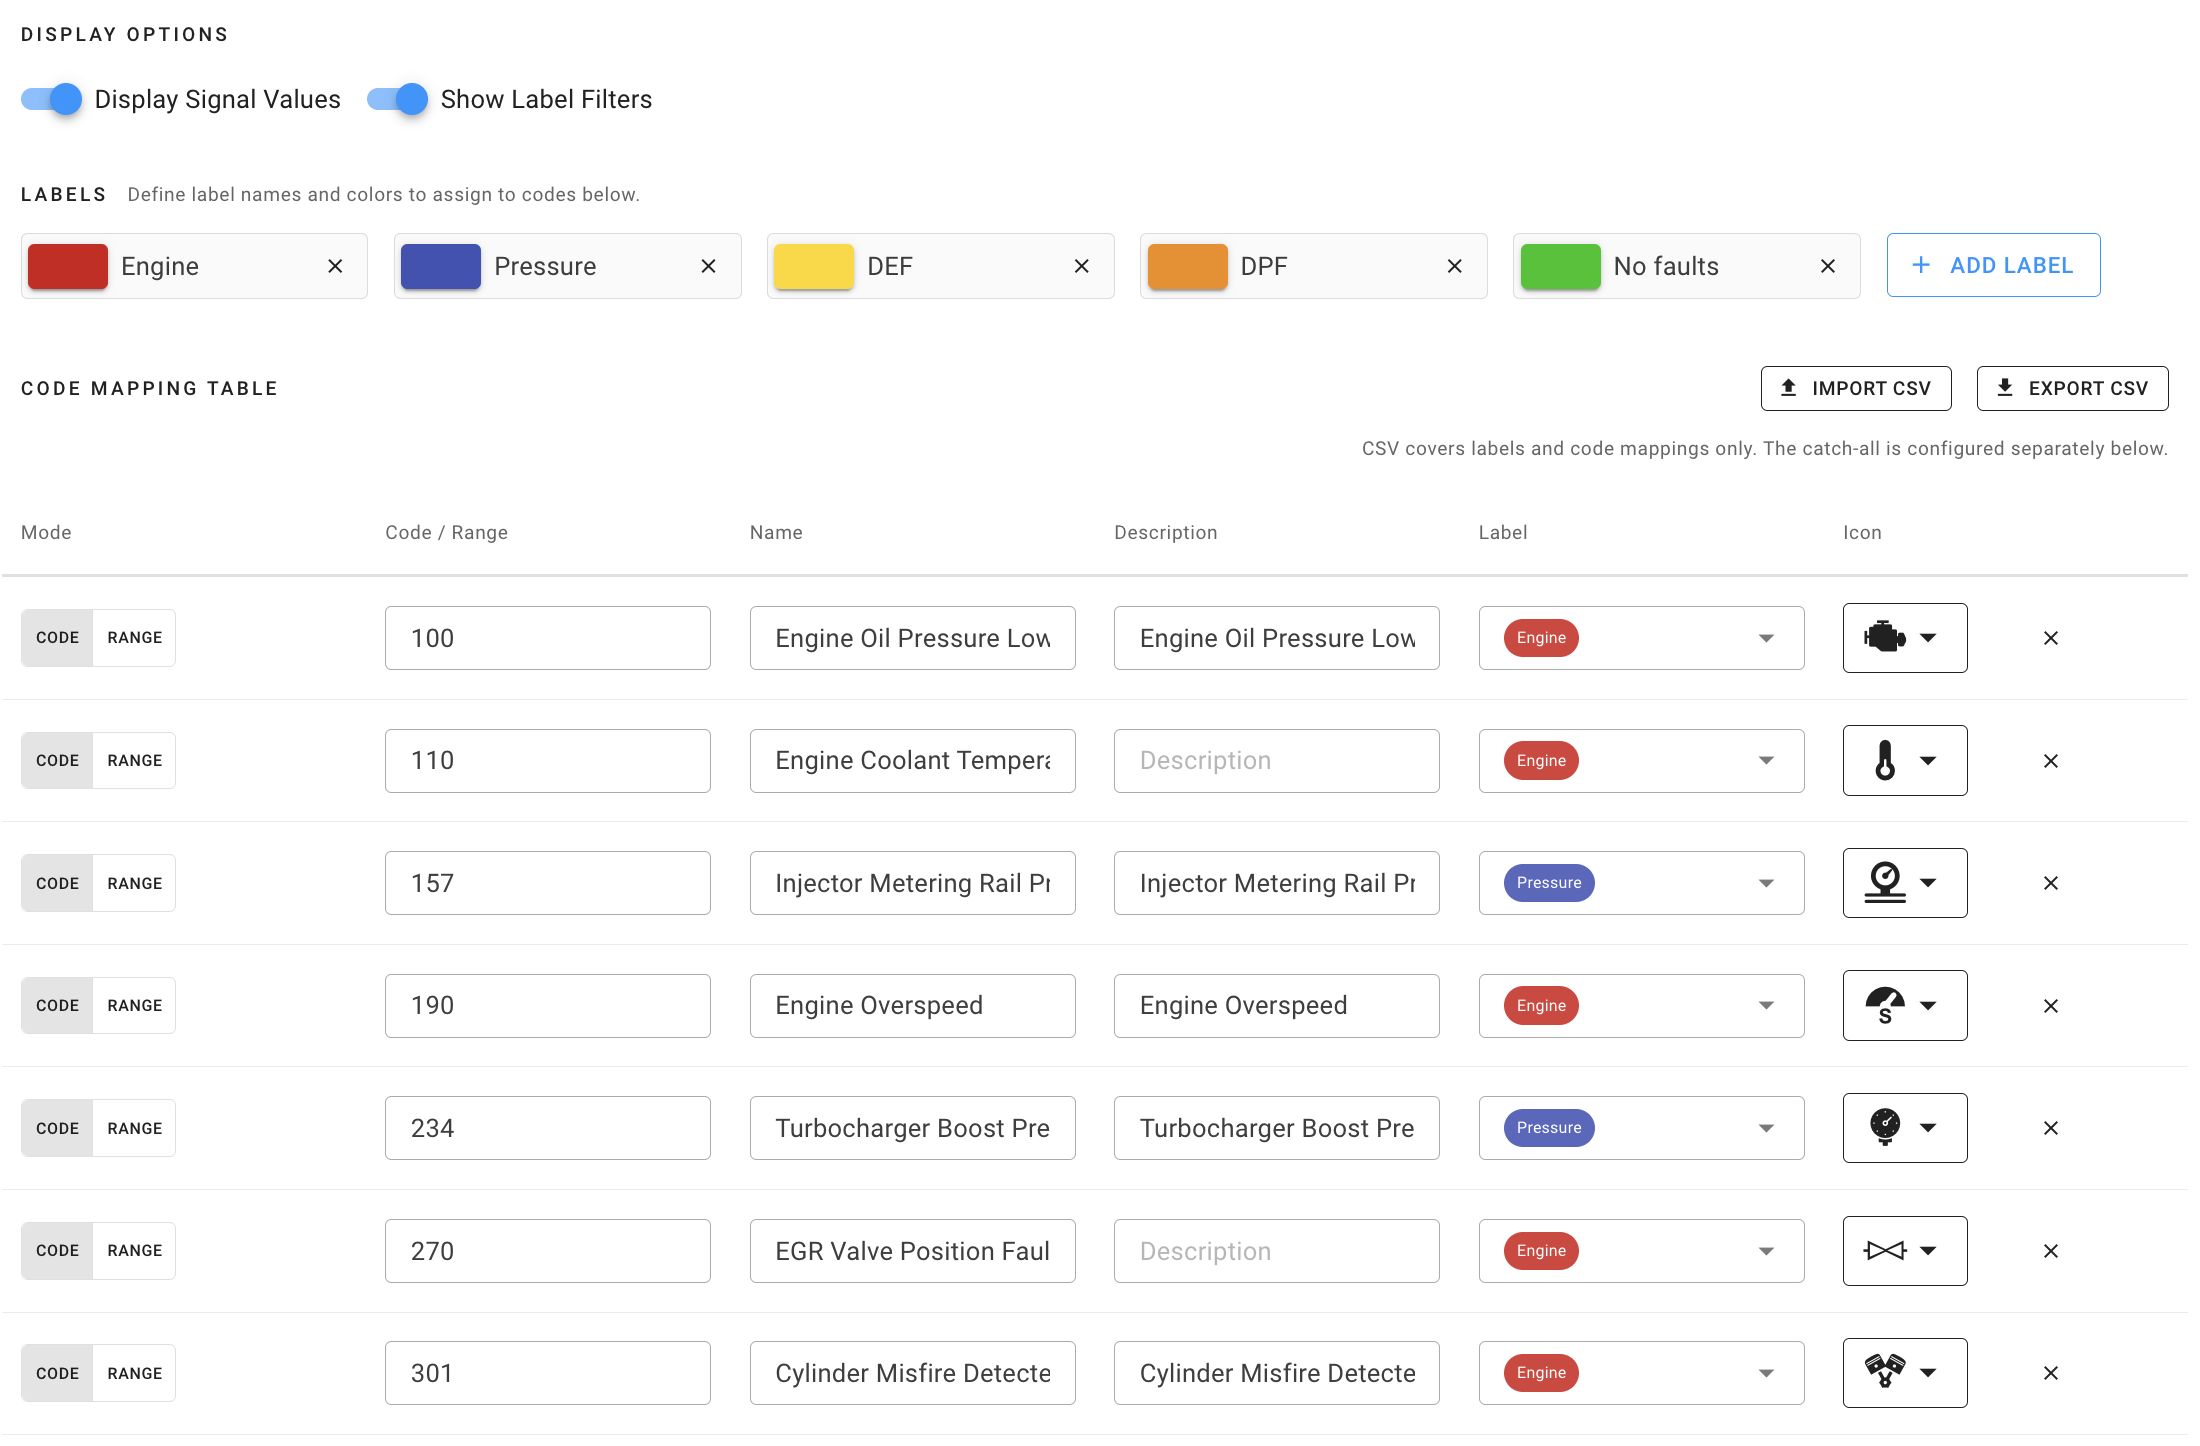
The Configurable Signal Log panel shows a scrollable, filterable log of a single signal's reported values. Each raw value or code can be mapped to a friendly name, description, icon, and color — making it well suited for visualizing fault codes, status codes, and other categorical signal data as they occur over time.
Configuration
Panel Options
| Configuration Item | Description |
|---|---|
| Panel Title | The name the panel will use |
| Signal | The signal to log, chosen on the 2nd step |
| Time Window | The default rolling time window shown when the panel first loads. Users can change this live, or pick a custom date range (up to 7 days). |
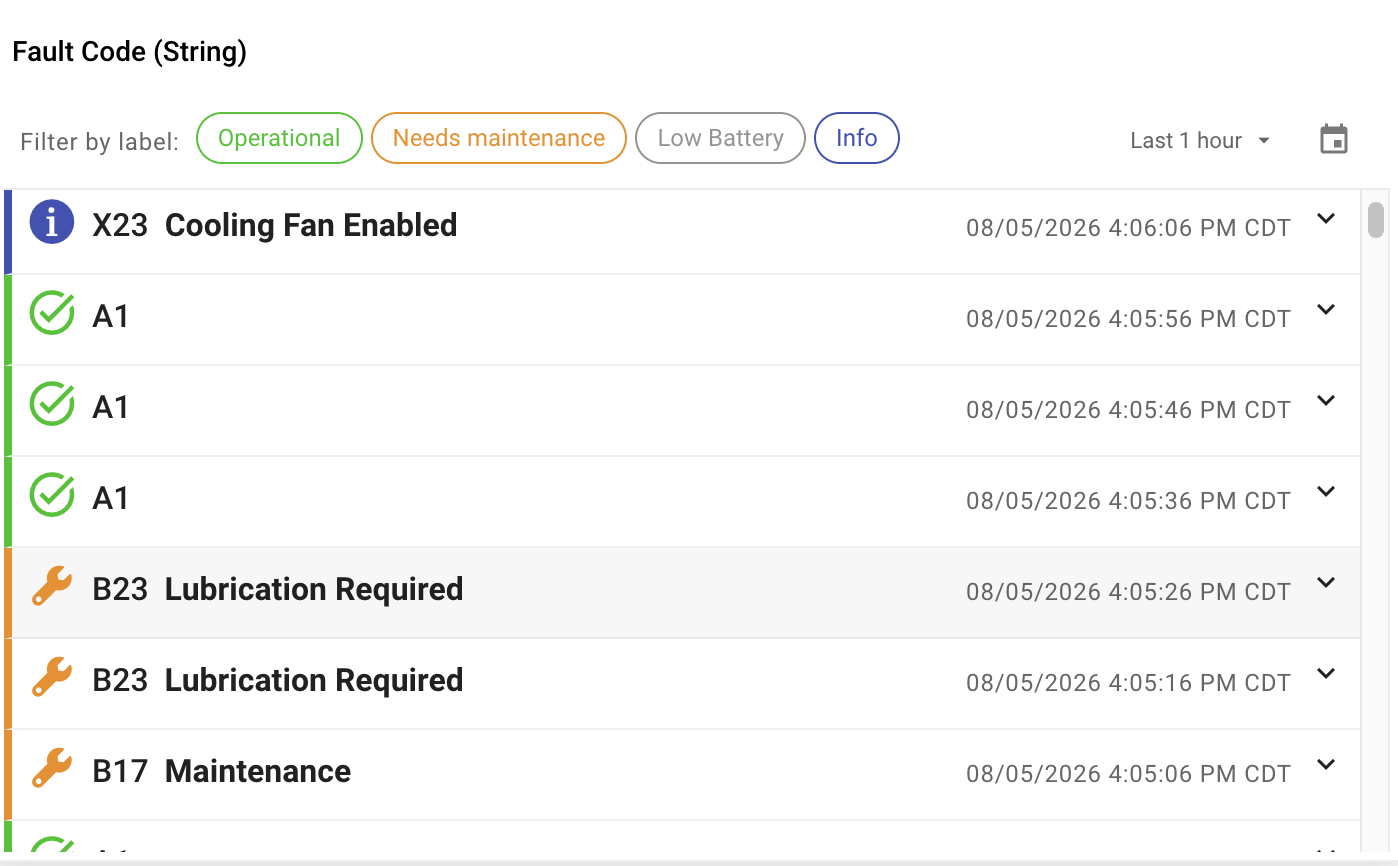
| Display Signal Values | When enabled, each row shows the signal's raw value/code alongside its mapped name |
| Show Label Filters | When enabled, shows the label filter chips and time window controls above the log |
Value Mapping
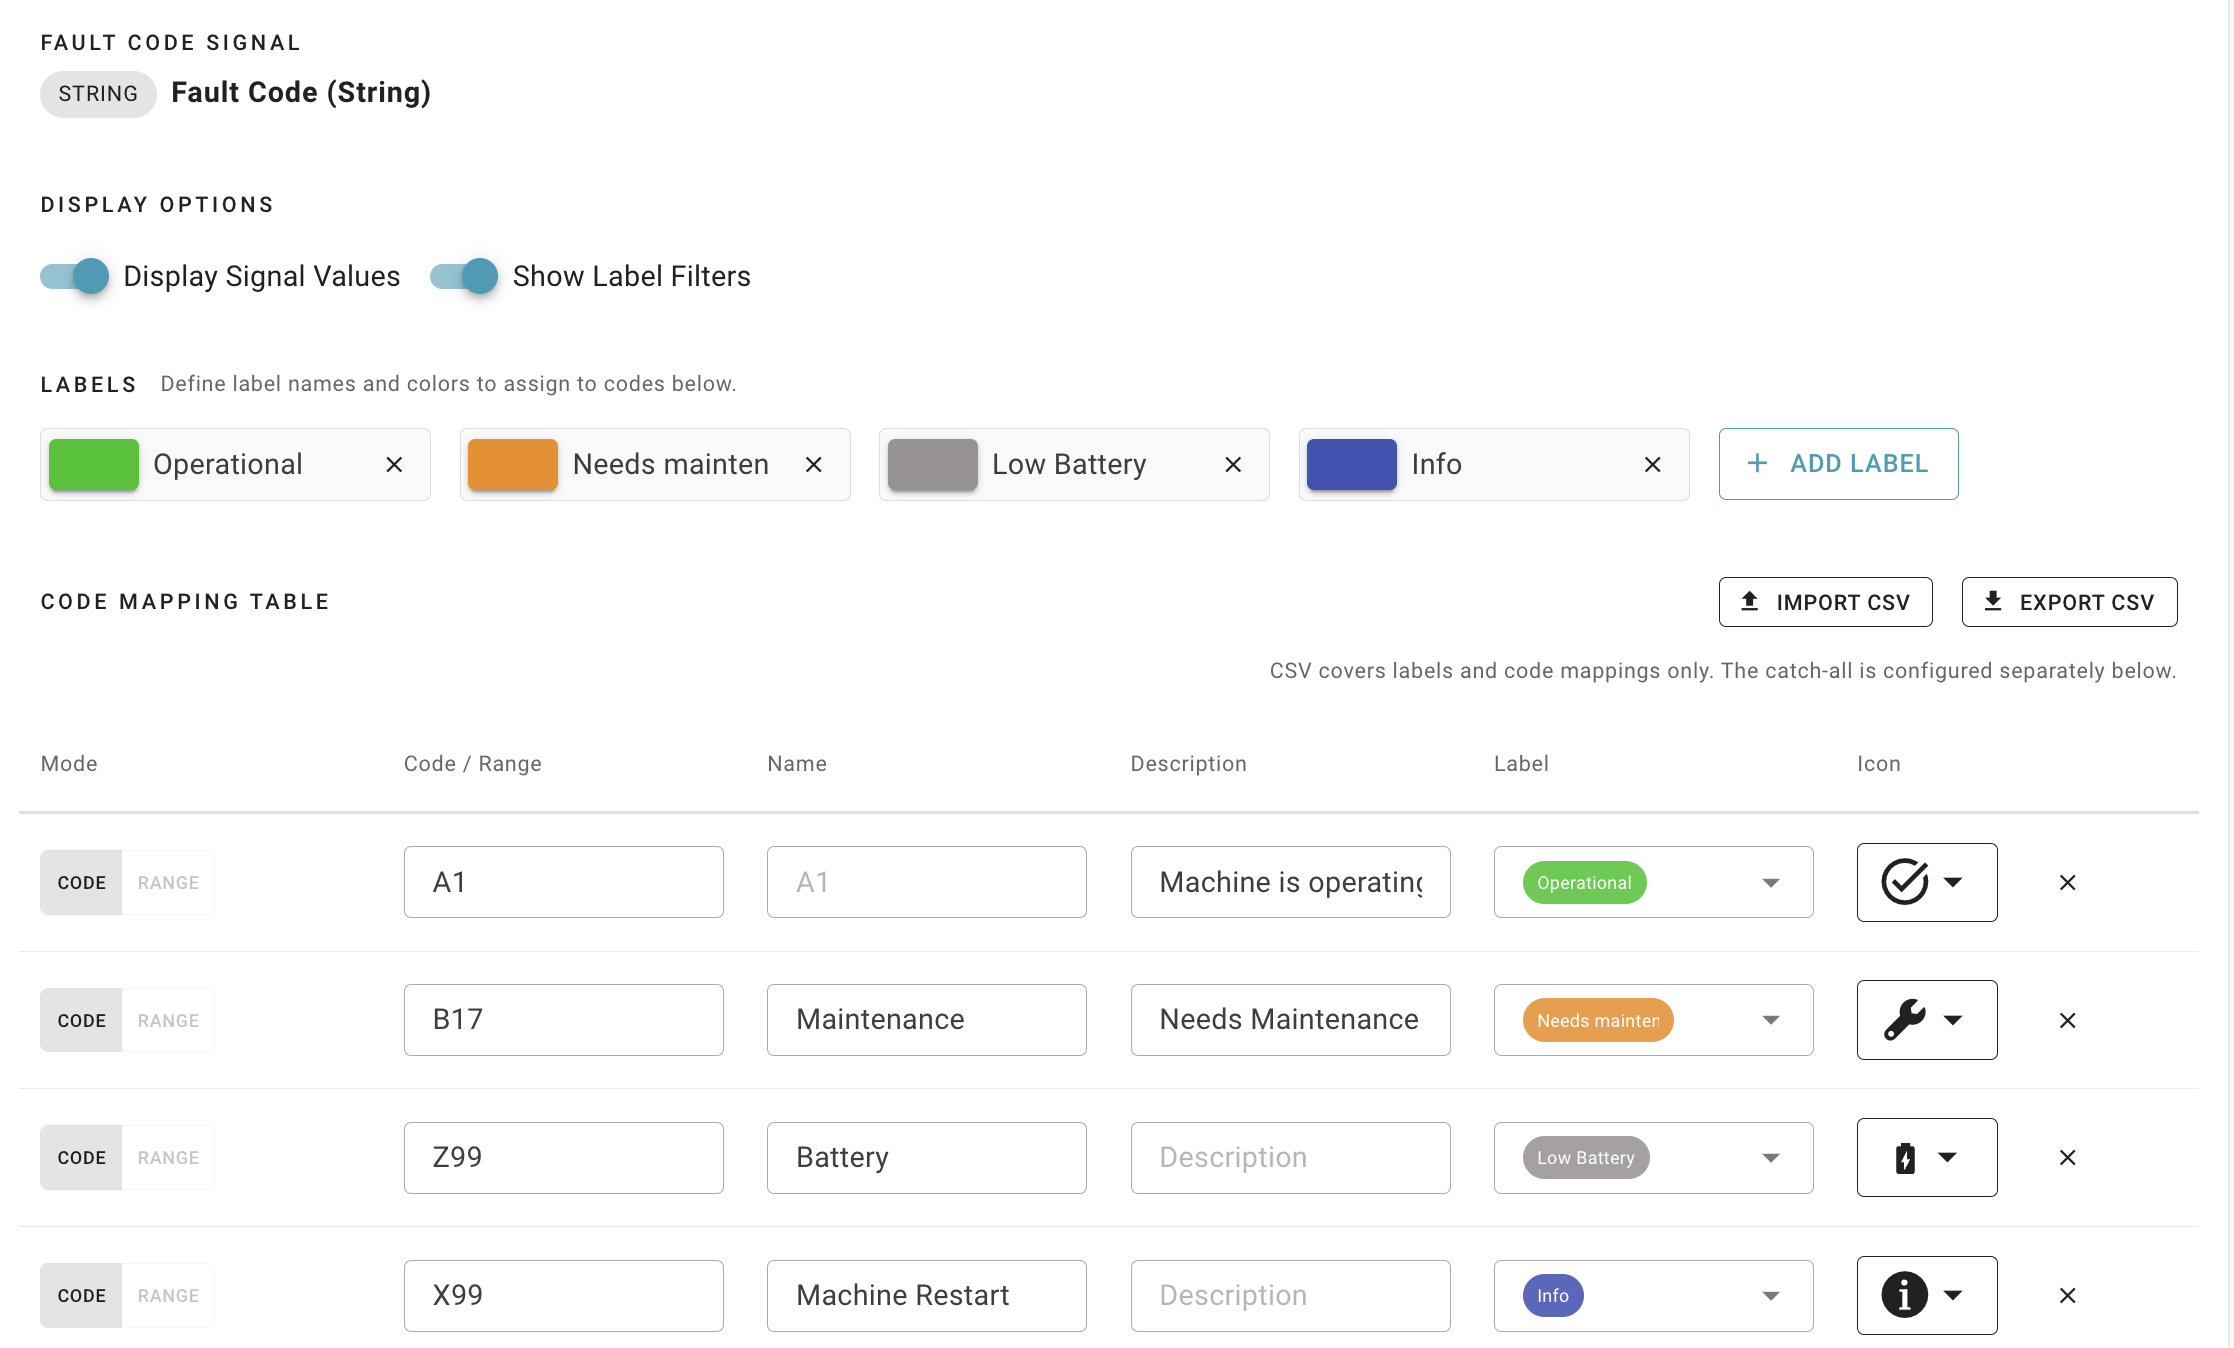
Raw signal values are turned into log rows using a mapping table, similar to the matching used by the Key Indicator panel.
| Match Mode | Description |
|---|---|
| Interpret | Matches a specific value/code |
| Range | Matches when the value falls within a Minimum/Maximum range (numeric signals only) |
Each mapping row has a Name, Description, Label, and Icon. An optional catch-all row can be enabled to handle any value that doesn't match one of the specific rows, with its own Name, Description, and Label.
Labels
Labels group related mapping rows together (for example, several fault codes under a "Critical" label) and appear as filter chips above the log so users can quickly narrow the log to rows carrying a particular label.
CSV Import / Export
The mapping table (labels and code mappings) can be exported to a CSV file for editing outside of ExoSense and re-imported. Importing replaces the existing mapping table. The catch-all row is configured separately and is not included in the CSV.
Using the Panel
Each row in the log shows the mapped icon and name (and the raw value, if enabled) along with the timestamp it was reported. Rows with a Label or Description defined can be expanded to see those details.
Users can filter the log by clicking one or more label chips above the log; clicking Clear removes all active filters. The time window control lets users switch between the configured rolling windows or select a custom date range; picking a custom range pauses live updates until "Back to Live" is selected.
If a signal reports a value with no matching row and no catch-all configured, the row is shown as "Unknown."