Panel: Content Line Chart Viewer
Overview
This highly configurable dashboard panel can display data contained in Asset content files as a line chart.
This option must be selected within the Content Viewer panel as Line Chart Viewer
Note: Data Formatting and Conversion
User number format preferences and unit conversions that are used for signal data values are not applicable to content file data viewed with the content viewer panel.
Line Chart Viewer Mode
As a Chart viewer for CSV files or JSON structured data files. Typically used for applications that require devices to upload high resolution event data or non-standard signal data that isn't necessary to continuously send as a signal.
General usage notes:
- The X and Y axis values need to be numeric. If any value of the pair is empty or not a number, the point will be skipped while rendering.
- If a series containing more than 1 point has the same X, it will random pick Y value from duplicate points.
- The panel can render up to 10 line chart series in a single chart.
This mode supports a few different schema options for CSV and JSON structured data files, as documented below.
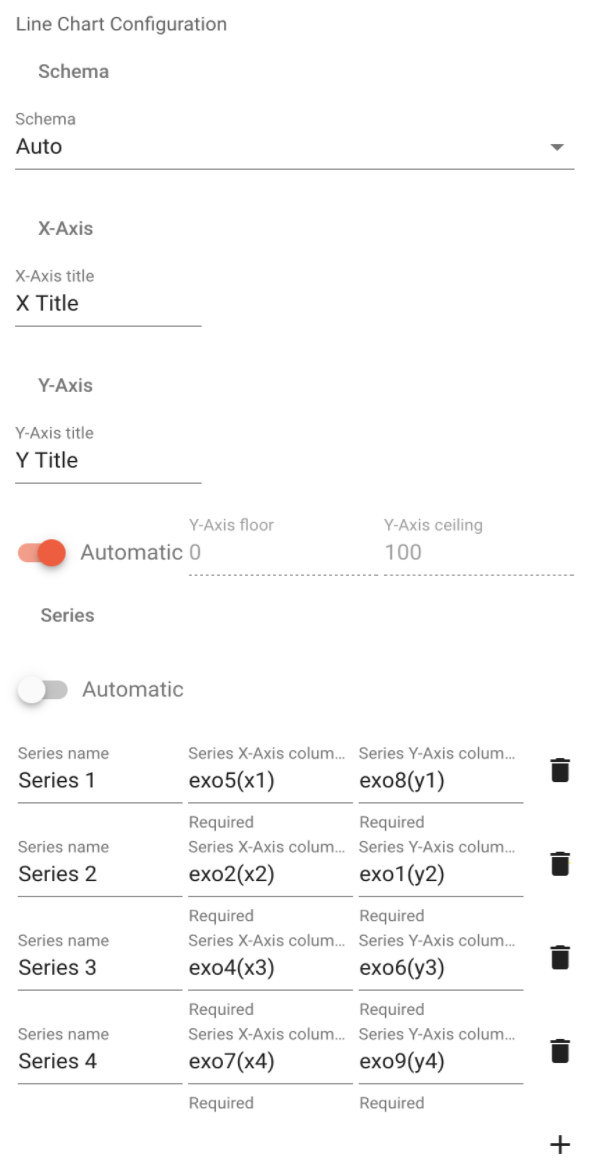
Auto schema mode
Supports a CSV formatted file (.csv file extension) with multiple X/Y Pairs, each series has a dedicated X column and a dedicated Y column. Although the 'Automatic' mode will assume each x,y columns are in order (1,y1,x2,y2), turning off the Automatic option allows the user to specify the exact x and y columns for each seriesThe column does not always ordered as x1,y1,x2,y2.
This schema mode differs from 'CSV' in that it uses a specific column for each X axis and Y axis values of each of the line series instead of only one column for all X axis values.
Example CSV file content for use in 'Auto' schema line chart mode
exo0,exo1(y2),exo2(x2),exo3,exo4(x3),exo5(x1),exo6(y3),exo7(x4),exo8(y1),exo9(y4)
,212,5,,4,3,216,4,209,207
,212,5,,4,3,216,4,209,207
,212,5,,4,3,216,4,209,207
,212,7,,6,7,216,7,209,207
,212,14,,14,14,215,14,209,207
,212,22,,22,22,215,22,209,207
,211,29,,29,29,215,29,209,207
,211,37,,37,37,215,37,209,207
,211,45,,44,44,215,44,209,207
,211,52,,52,52,215,52,208,207
,211,60,,60,60,214,60,208,206
,211,68,,68,67,214,68,208,206
,211,75,,75,75,214,75,208,206
,210,83,,83,83,214,83,208,206
,210,90,,90,90,214,90,208,206
,210,98,,98,98,214,98,207,206
,210,106,,106,106,213,106,207,206
,210,113,,113,113,213,113,207,206
,210,121,,121,121,213,121,207,206
,210,128,,128,128,213,128,207,206
,210,136,,136,136,213,136,207,205
,210,144,,143,143,213,143,207,205
,210,151,,151,151,212,151,207,205
,209,159,,159,159,212,159,207,205
,209,167,,166,166,212,166,207,205

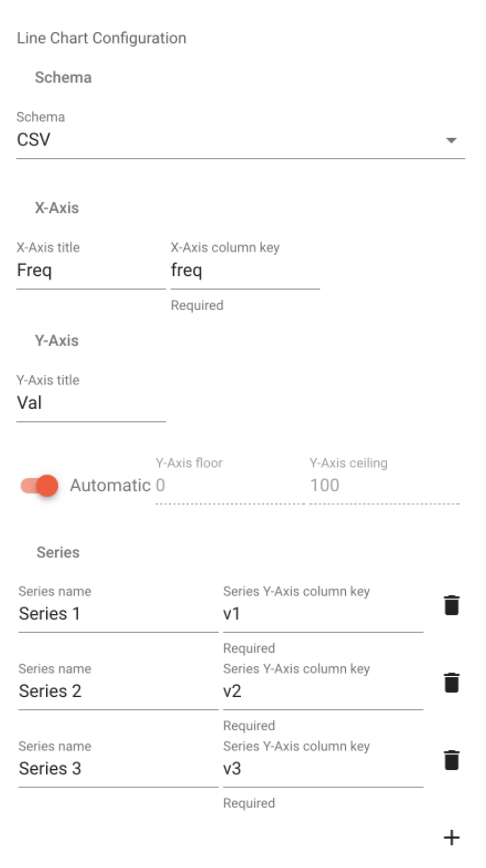
CSV schema mode
Supports a CSV formatted file (.csv file extension) to be displayed as a line chart with 1 or more lines. You specify the column for your X-axis values and then specify one or more columns for the Y-axis values for each series. Note that you can also specify the X and Y axis titles and the series names.
This schema mode differs from 'Auto' in that it uses one column for all of the X axis values of the line series.
Example CSV file content
freq,v1,v2,v3
12.826536,0.697099,0.172224,0.569004
29.418025,0.139836,0.007529,0.850914
54.551056,0.86625,0.071657,0.609019

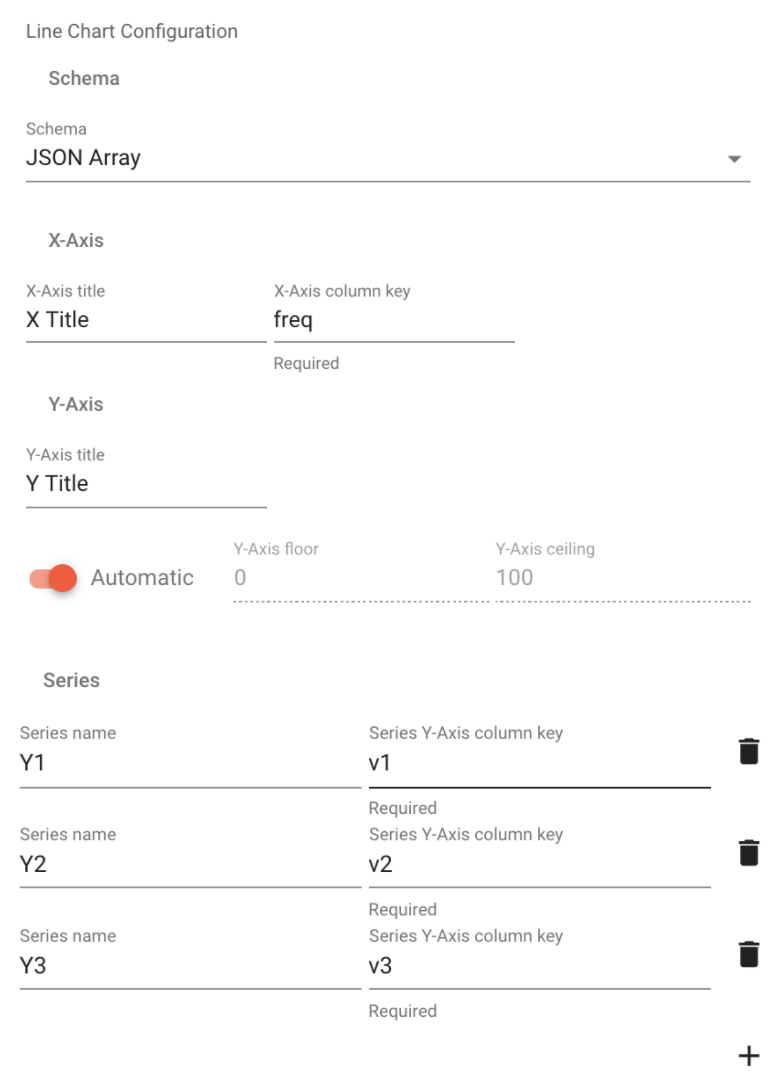
JSON Array schema mode
This schema mode supports a JSON array of objects. The objects need to include the keys defined in the panel. If the key is missing, the data point will be skipped while rendering the chart.
Example JSON Array formatted data for the JSON Array schema mode line chart
[
   {
      "freq": 12.826536,
      "v1": 0.697099,
      "v2": 0.172224,
      "v3": 0.569004
   },
   {
      "freq": 54.551056,
      "v3": 0.609019,
      "v1": 0.86625,
      "v2": 0.071657
   },
   {
      "freq": 29.418025,
      "v2": 0.007529,
      "v3": 0.850914,
      "v1": 0.139836
   }
]

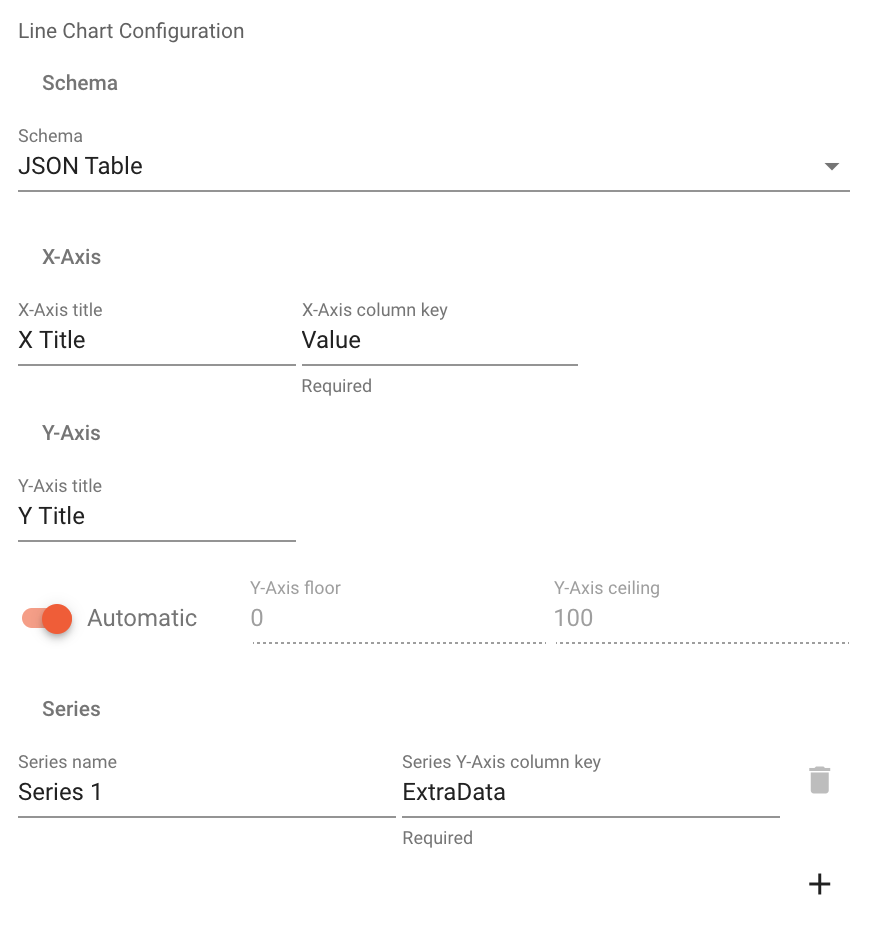
JSON Table schema mode
Can be used with files with a JSON object formatted in the same way as the Panel: JSON Table.
Example JSON formatted data for the JSON Array schema mode line chart
{
  "headers": [
    "Stat",
    "Value",
    "Condition",
    "ExtraData"
  ],
  "values": [
    [
      "stat 1",
      23,
      "ok",
      542.32
    ],
    [
      "stat 2",
      103,
      "warning",
      323.99
    ],
    [
      "stat 3",
      0.32,
      "nothing to see here",
      100.81
    ]
  ]
}