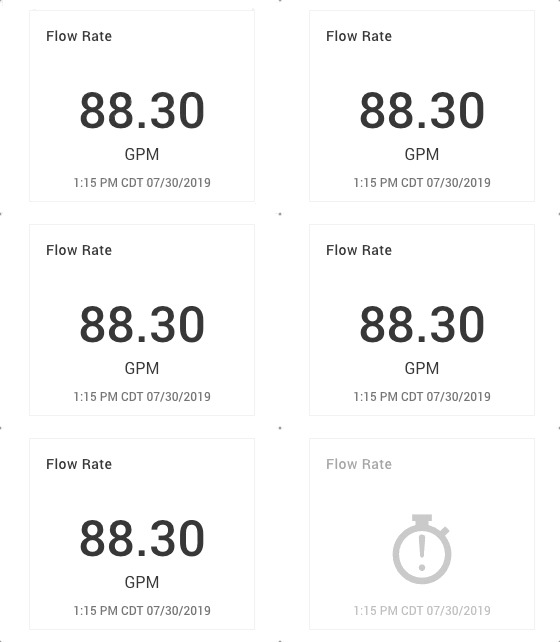
Panel: Current Value
The Current Value panel shows the current value of a signal along with units and timestamp. The value and graphic update realtime based on new data for the signal.
Configuration
Panel Options
| Configuration Item | Description |
|---|---|
| Signal(s) | This panel supports 1 signal, choose on 2nd step |
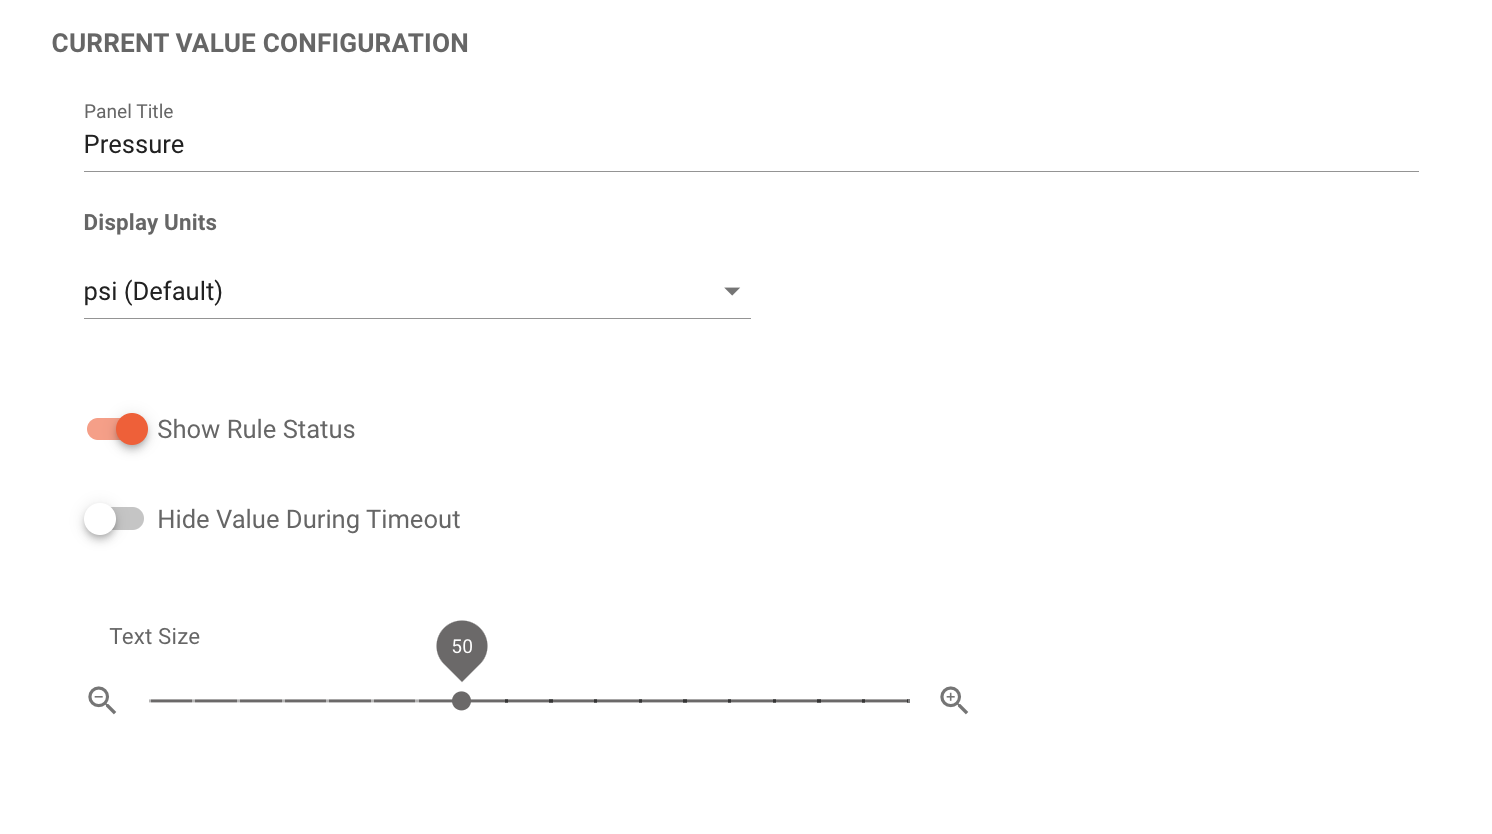
| Panel Title | The name the panel will use |
| Display Units | Use the default Signal Specified Visualization Units (recommended) to dynamically adjust based on the user or choose a specific unit. |
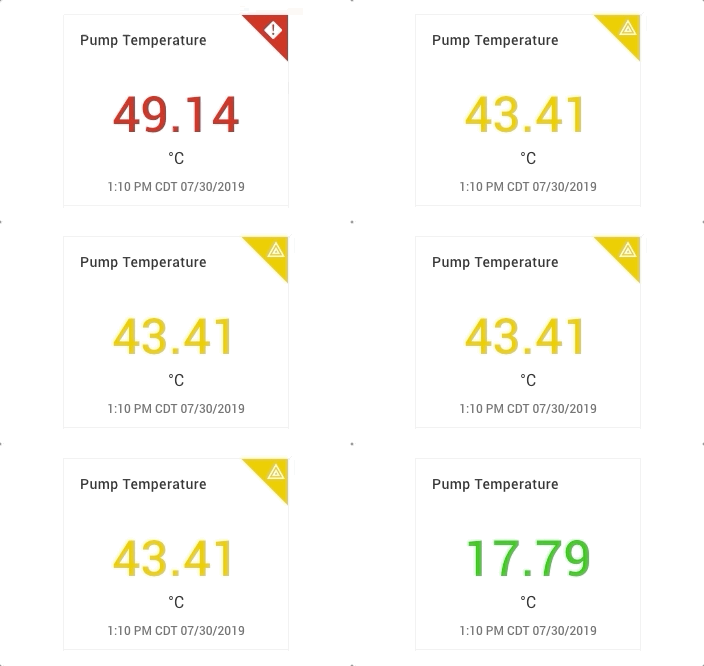
| Show Rule Status Corner Indicator | If there is are any rules on this signal, the value will show the status color and an indicator in the upper-right corner |
| Hide Value During Timeout | If the signal is in timeout and this is enabled, it will hide the last value to not display what could be an incorrect current value |
| Text Size | Allows setting the value text size to properly fit based on different value lengths and sizes of the panel. |
| Aggregation | Display an aggregated value over a historical time window instead of the live last-reported value. See Aggregation below. |
Aggregation
By default, the Current Value panel shows the live, last-reported value for the signal. The Aggregation option instead calculates and displays a value over a historical time window, which is useful for showing running averages, daily totals, or peak values at a glance.
| Configuration Item | Description |
|---|---|
| Aggregation Type | None (Last Value) (default, live value, no aggregation), Avg, Min, Max, Count, Sum, Diff (Max - Min), or Diff (Last - First). Non-numeric (string/boolean) signals may only choose None (Last Value) or Count. |
| Time Window | A positive whole number defining the length of the aggregation window. |
| Time Window Unit | The unit for the Time Window: Seconds, Minutes, Hours, Days, or Weeks. |
| Time Period | Rolling aggregates over a sliding window of the last Time Window/Unit ending now. Current Period aggregates over the current (in-progress) period of that length. |
Timestamp
When an aggregation other than None (Last Value) is selected, the timestamp shown on the panel reflects the end of the aggregation window rather than the signal's true last-reported time.
Indicator Thresholds
When Aggregation is active, any configured indicator thresholds (Interpret, Range, or Configurable Rule Status indicator types, as well as the Rule Status Corner Indicator) are evaluated against the aggregated value, not each individual raw reading.
Indicator Type Options
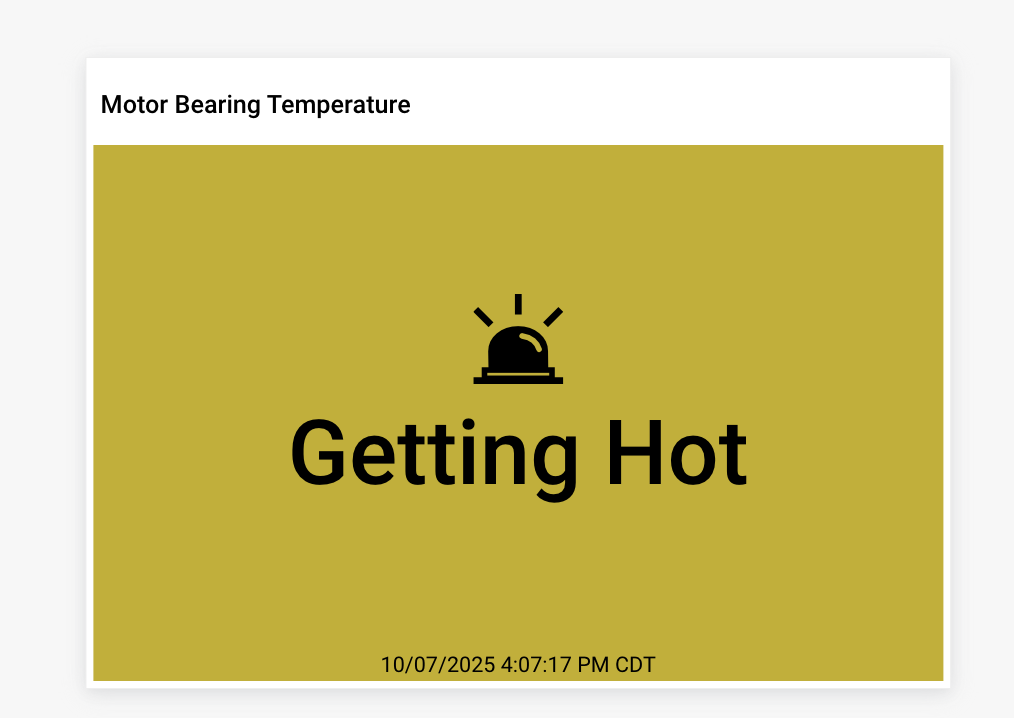
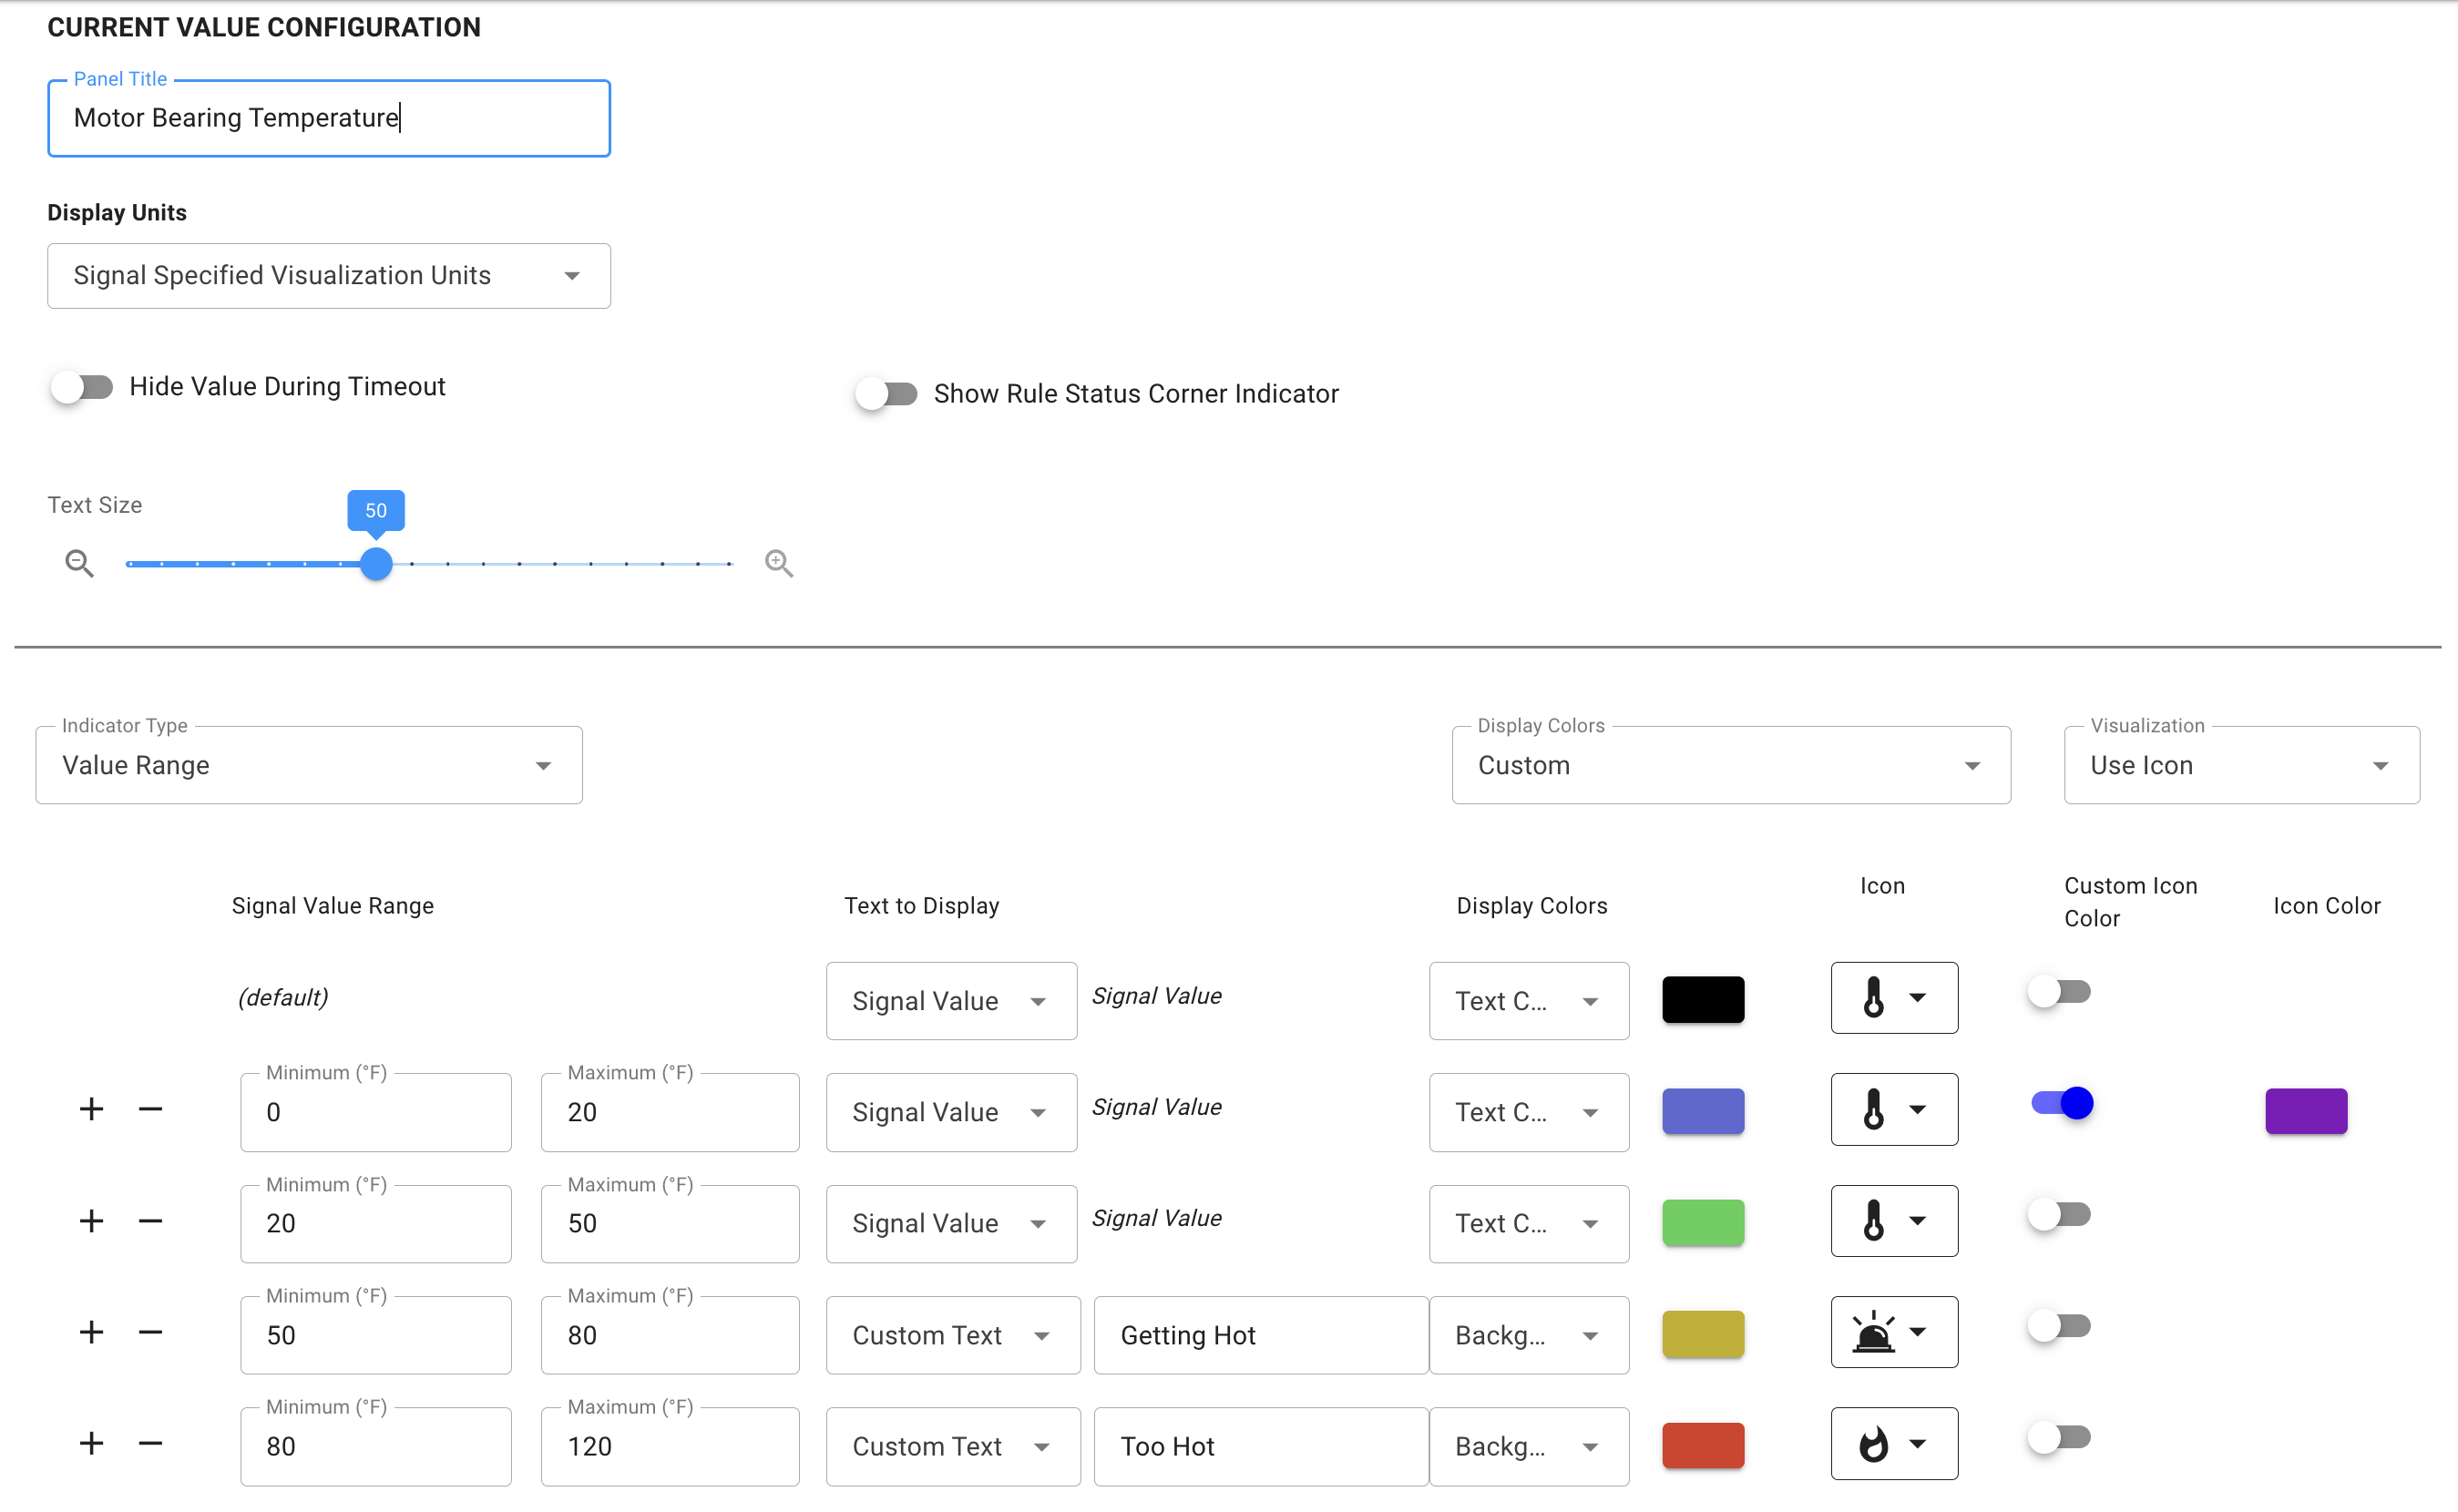
This panel supports interpretation and indicator options for customizing the value shown, text or background color, and displaying an icon or image. Similar to the Key Indicator panel.
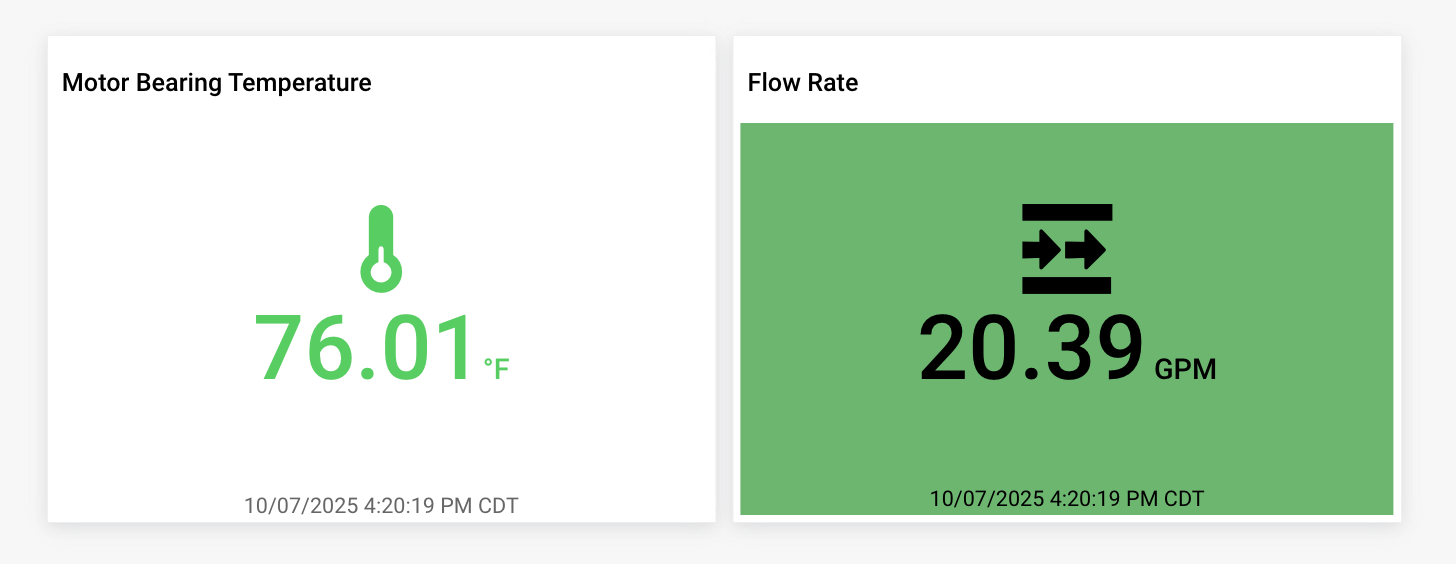
| Indicator Type | Description |
|---|---|
| Current Value | This option (default) displays the current value and optional visualization with no indicator options |
| Interpret | This option allows matching on a single value to display different indicator options |
| Range | This option allows specifying ranges to display different indicator options |
| Configurable Rule Status | This option allows using rule status states to display different indicator options |
| Display Colors | Description |
|---|---|
| No Change | Value does not change color in the panel. |
| Text Color on Rule Status | Value changes the text color based on rule status. |
| Custom | Allows custom color options for Interpret, Range, and Configurable Rule Status indicator types. |
| Visualization | Description |
|---|---|
| None | Panel will display the value/text only, no visualization. (default). |
| Icon | An icon can be specified for the panel for each indicator option. |
| Upload | Images can be uploaded for each indicator option. |
| Indicator Options | Description |
|---|---|
| Text to Display | Option of showing the current signal value or custom text |
| Display Colors | Option of default, Text Color, or Background Color for each matched indicator condition. |
| Icon or Visualization. | Option to specify the icon (icon color), or image (upload) for each matched indicator condition. |
Timeout Handling
The gauge will show timeout conditions with a configuration option to hide the last value.