Panel: Data Table
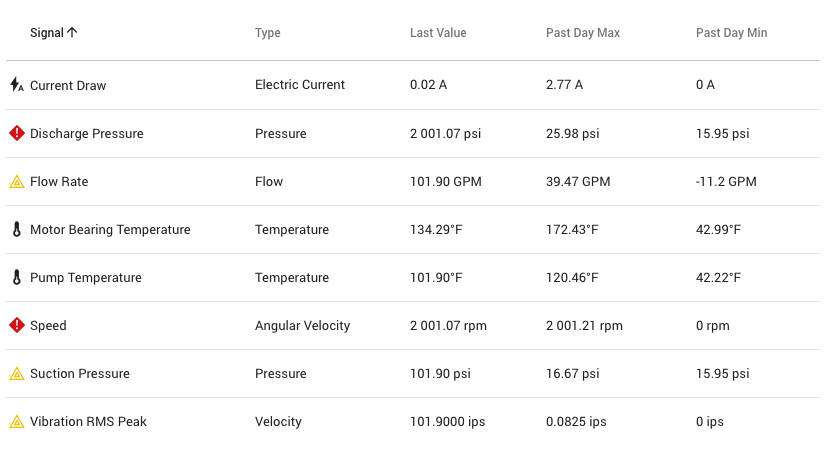
The Data Table panel shows multiple signals from an asset or assets in a tabular format. Configurable columns, allowing last reported as well as average, minimum and maximum across a variety of time frames.
Data to Display
This panel allows choosing either specific signals (max 20) or instead to choose a specific asset which will automatically show all signals of that asset.
Configuration Options
- Display Asset Name
- Display Group Name
- Display Signal Type (default on)
- Display Signal Timeout Status (default on)
- Display Signal Status (default on)
- Display Signal Icon (default on)
Signal Reordering
When specific signals have been chosen, within the Configuration step you may re-order them. This is not available when an entire Asset has been chosen and all signals are automatically on the panel.
Signal Options
- Display Units (Enabled or Disabled)
- Units: Use the default Signal Specified Visualization Units (recommended) to dynamically adjust based on the user or choose a specific unit.
- Choose a Rule to show status for the signal.
Signal Column Options:
- Last Reported Timestamp (default enabled)
- Last Value (default enabled)
- Past Day Avg, Past Day Max, Past Day Min,
- Past Week Avg, Past Week Max, Past Week Min,
- Past Month Avg, Past Month Max, Past Month Min,
- Past Quarter Avg, Past Quarter Max, Past Quarter Min,
- Past Year Avg, Past Year Max, Past Year Min,
- Rolling Day Avg, Rolling Day Max, Rolling Day Min,
- Rolling Week Avg, Rolling Week Max, Rolling Week Min,
- Rolling Month Avg, Rolling Month Max, Rolling Month Min,
- Rolling Quarter Avg, Rolling Quarter Max, Rolling Quarter Min,
- Rolling Year Avg, Rolling Year Max, Rolling Year Min.
Timeout Handling
This panel will show that a signal has timed out if the last reported timestamp is past the signal's timeout property and that 'Signal Timeout Status' option is enabled.