Panel: Dynamic Image SVG
Overview
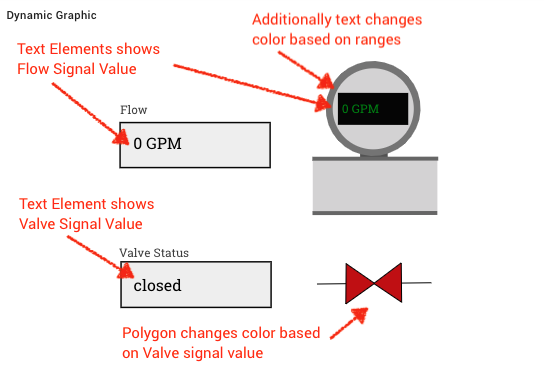
This dashboard panel allows signal values and status to be mapped to elements (Text, Basic Shapes, and Groups) within a SVG image. When signals are mapped to text, the Signal value will be displayed in that text field.
Images can be basic or very advanced for use cases such as:
- Showing a dynamic version of asset / machine schematics
- A dynamic view of a site layout
- An HMI (Human Machine Interface) representation
Info
This panel is not enabled by default as using SVG images is an advanced use. Administrators with feature control access can enable this panel for use by users.

SVG Requirements / Formatting
Info
An SVG file is similar to HTML and CSS. The SVG specification was developed by the World Wide Web Consortium (W3C) and is an open standard. The ExoSense Dynamic Image panel uses this open standard and relies on the browser to display the file correctly.
SVG files can be loaded and displayed by a web browser by default. It's important to note that different browsers will handle the SVG slightly different. The more complex it is, including styles and fonts, the more likely it may look differently on two different browsers.
Those creating SVG images should test and verify on browses they expect to use.
Elements that will be used with signals in the panel must use an element id that begins with the prefix exo-. An example for a text element that will show a temperature signal value might be exo-temperature-value.
When loading the SVG, the panel will look for all elements that have this prefix and provide an option to use it in the panel.
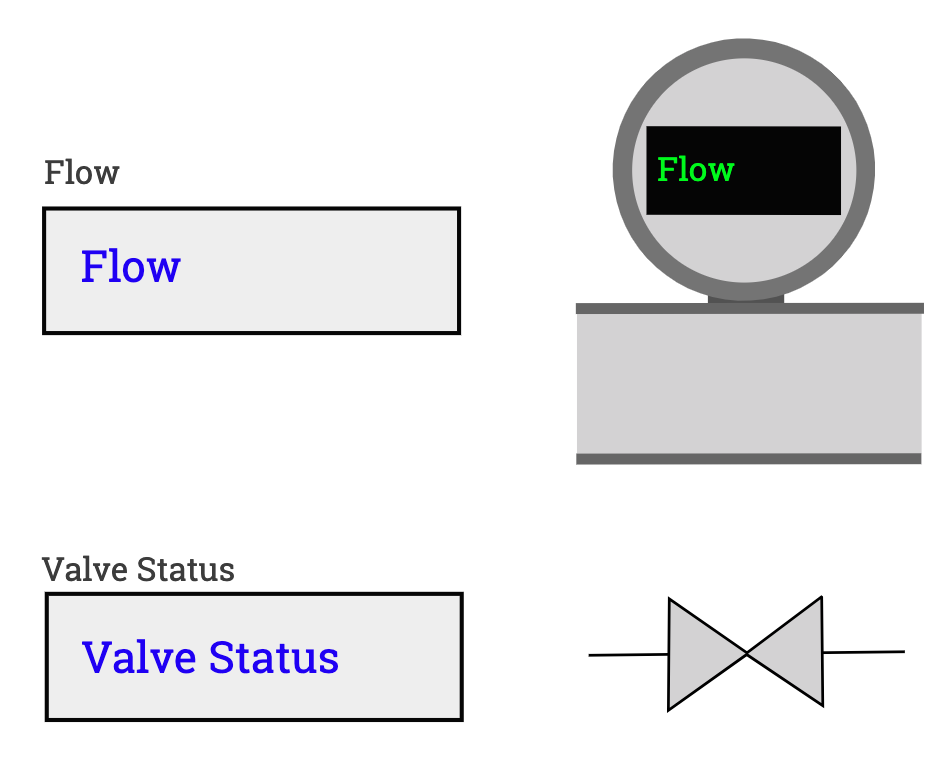
Here is a basic example of the SVG XML
Example SVG XML, note the`exo-` ids.
<?xml version="1.0" encoding="utf-8"?>
<svg viewBox="0 0 390 335" xmlns="http://www.w3.org/2000/svg" xmlns:bx="">
<defs>
<bx:grid x="0.032" y="0.715" width="100" height="100"/>
</defs>
<text style="fill: rgb(69, 69, 69); font-family: "Roboto Slab"; font-size: 12px; white-space: pre;" x="40.432" y="74.776">Flow</text>
<text style="fill: rgb(69, 69, 69); font-family: "Roboto Slab"; font-size: 12px; white-space: pre;" x="39.322" y="219.831">Valve Status</text>
<rect x="41.087" y="84.321" width="150.263" height="44.055" style="stroke-width: 3px; stroke: rgb(5, 5, 5); fill: rgb(240, 240, 240); paint-order: stroke;"/>
<rect x="42.063" y="225.248" width="150.263" height="44.637" style="stroke-width: 3px; stroke: rgb(5, 5, 5); fill: rgb(240, 240, 240); paint-order: stroke;"/>
<text id="exo-flow-value" style="fill: rgb(12, 4, 247); font-family: "Roboto Slab"; font-size: 16px; white-space: pre;" x="53.732" y="110.338">Flow</text>
<text id="exo-valve-status" style="fill: rgb(12, 4, 247); font-family: "Roboto Slab"; font-size: 16px; white-space: pre;" x="53.964" y="253.619">Valve Status</text>
<g transform="matrix(1, 0, 0, 1, -44.901402, 4.439004)">
<line style="stroke: rgb(0, 0, 0);" x1="284.396" y1="242.526" x2="400.032" y2="241.237"/>
<polygon style="fill: rgb(216, 216, 216); stroke: rgb(0, 0, 0);" points="313.879 221.919 313.552 262.682 342.184 242.247 370.021 260.946 369.622 221.284 369.489 221.171 342.296 241.626" id="exo-valve" bx:origin="0.072 0.02"/>
</g>
<rect x="235.218" y="120.922" width="126.054" height="55.933" style="fill: rgb(216, 216, 216); stroke: rgb(113, 113, 113); stroke-width: 0px;"/>
<rect x="283.095" y="111.303" width="27.916" height="9.999" style="fill: rgb(92, 92, 92);"/>
<path d="M 929.918 169.598 m -48 0 a 48 48 0 1 0 96 0 a 48 48 0 1 0 -96 0 Z M 929.918 169.598 m -37 0 a 37 37 0 0 1 74 0 a 37 37 0 0 1 -74 0 Z" style="stroke-miterlimit: 6; fill: rgb(127, 127, 127);" transform="matrix(-0.999001, -0.044687, 0.044687, -0.999001, 1217.674204, 280.310488)" bx:shape="ring 929.918 169.598 37 37 48 48 1@03758c0d"/>
<circle style="fill: rgb(216, 216, 216);" cx="296.401" cy="69.655" r="41"/>
<rect x="490.909" y="59.87" width="71.153" height="32.405" style="fill: rgb(4, 4, 4); stroke-linejoin: round;" id="exo-flow-meter-box" transform="matrix(0.999999, 0.001355, 0, 1.000001, -230.271927, -7.071556)"/>
<line style="stroke-width: 4px; stroke: rgb(113, 113, 113); fill: rgb(190, 190, 190);" x1="234.805" y1="120.166" x2="362.129" y2="120.056"/>
<line style="stroke-width: 4px; stroke: rgb(113, 113, 113);" x1="234.979" y1="175.207" x2="361.128" y2="175.076"/>
<text id="exo-flow-meter-value" transform="matrix(2.2026, 0, 0, 2.144399, -444.360199, -48.549152)" style="fill: rgb(8, 246, 4); font-family: "Roboto Slab"; font-size: 5.59597px; line-height: 8.95356px; white-space: pre;" x="321.869" y="56.927">Flow</text>
</svg>
Configuration Options
- Select signals (up to 80)
- Upload the SVG
- Turn on elements that you want to map to signals / signal status
- For Each element
- Pick a signal
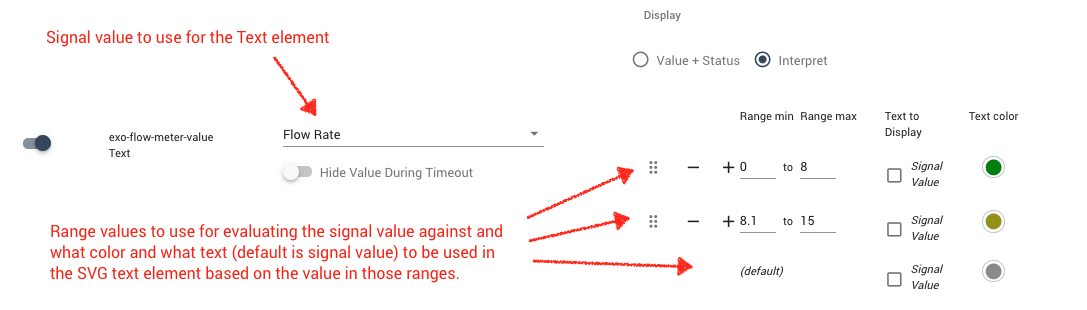
- Text Elements
- Display the value or Interpret using a range
- The color to use when interpreting
- The text to show - default is the signal value but can be mapped to other text
- When using the signal value, specify the units with either the default Signal Specified Visualization Units (recommended) to dynamically adjust based on the user or choose a specific unit.
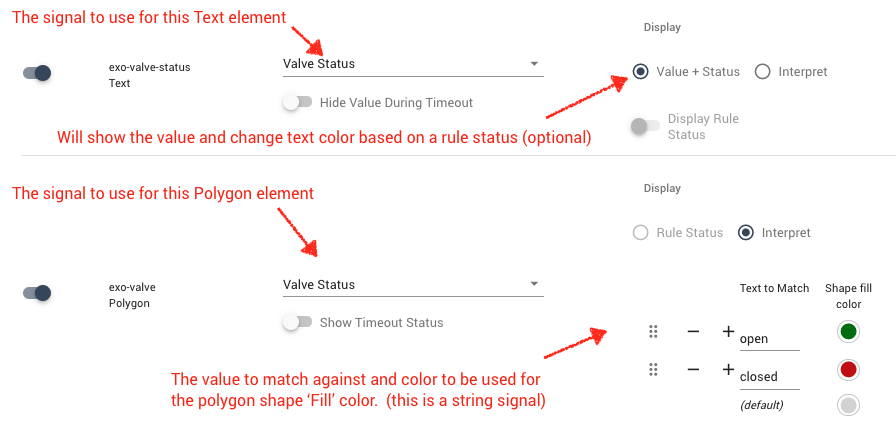
- Polygon / Shapes
- Rule status or Interpret
- Matches based on rule status or value matches
- The color to use when interpreting
Info
If you make updates to your SVG source file and re-upload it, the panel will use any existing elements that have the same id as before.
Timeout Handling
When a signal has not reported in the expected timeout setting period, the Dynamic Image panel will show a grey value or a "--" when the 'Hide Value During Timeout' option is enabled.