Panel: Heatmap
Overview
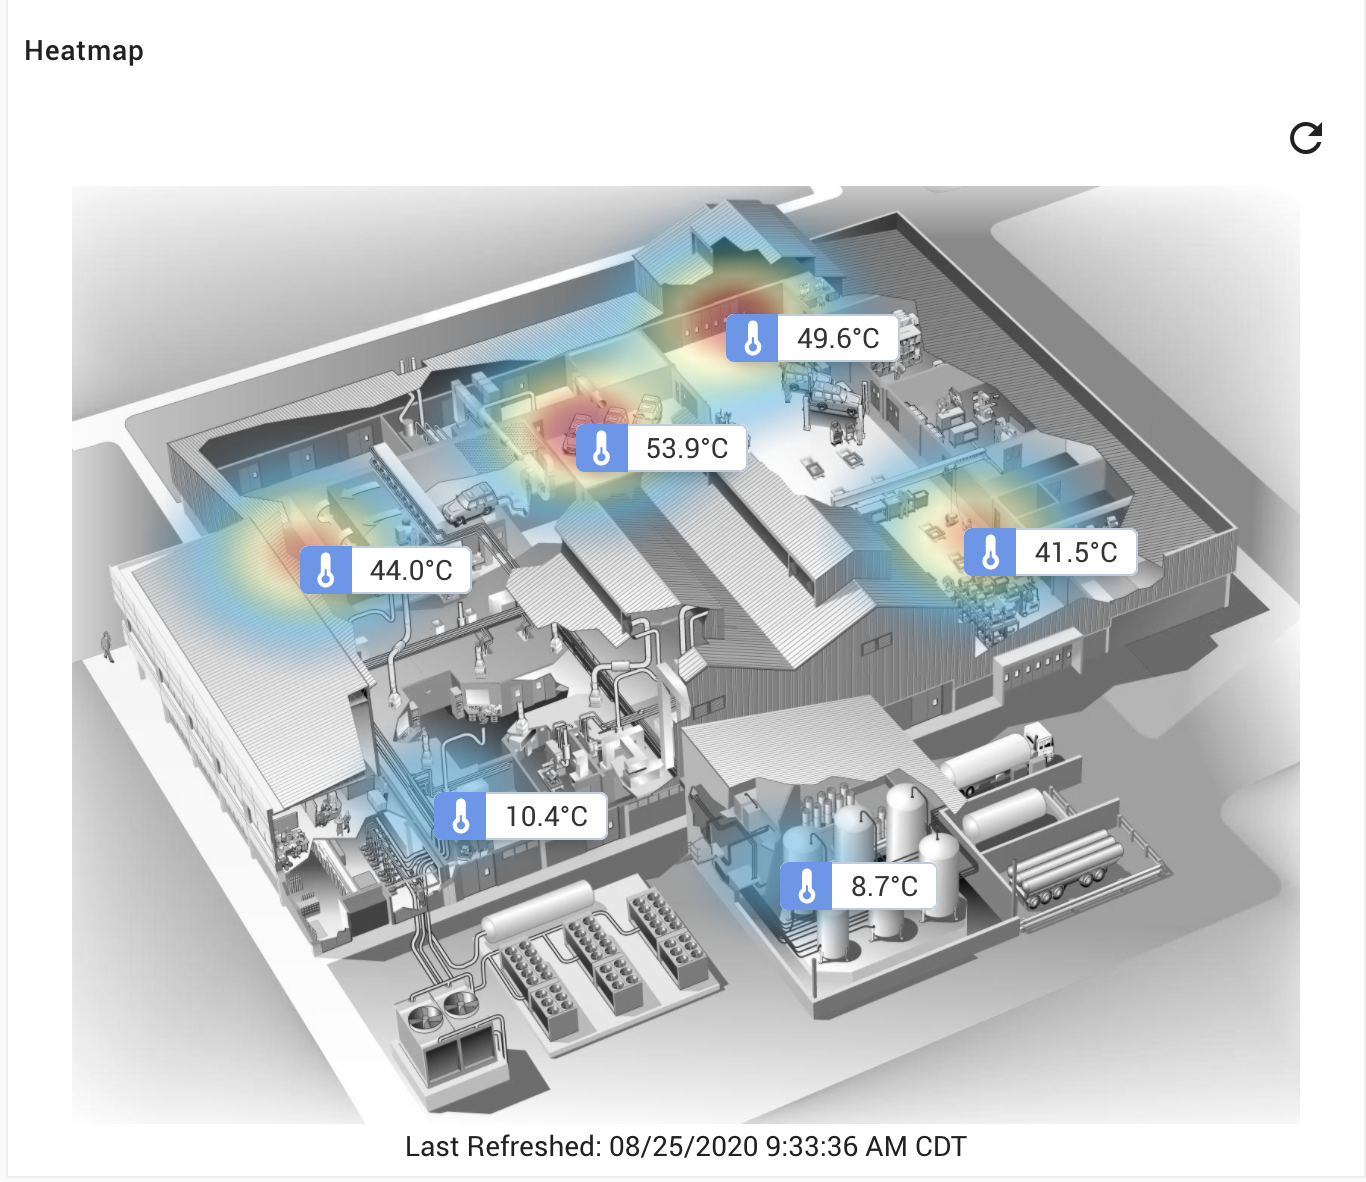
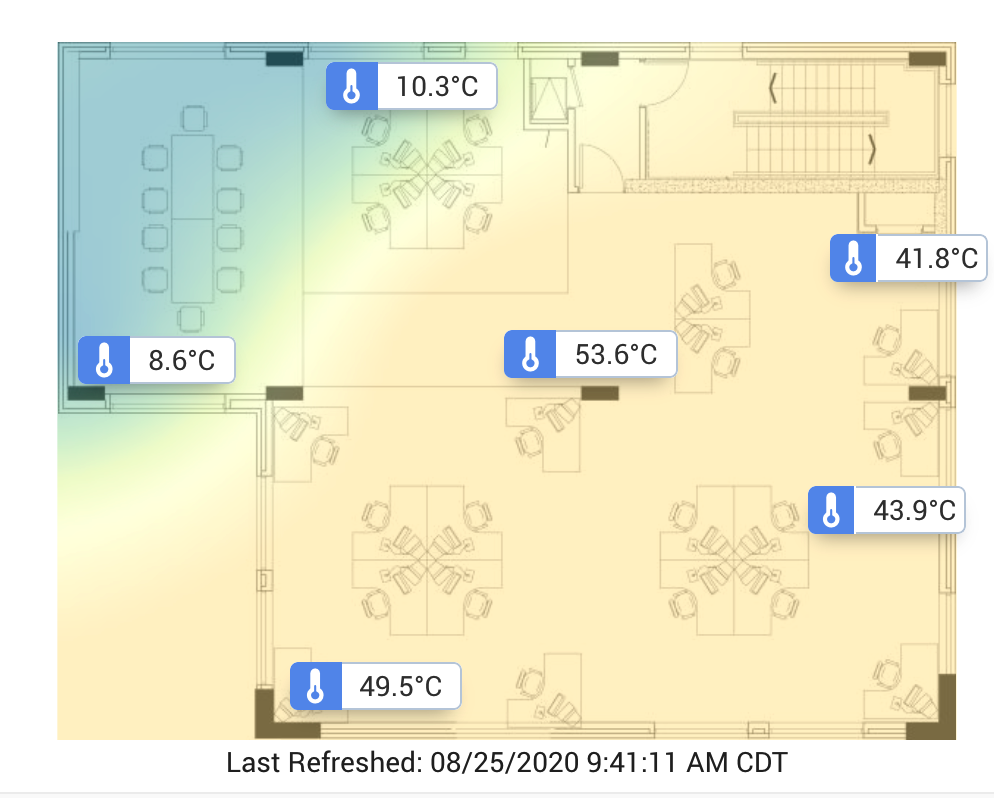
This panel allows users to visualize a color gradient that is overlaid on an image based on signal values and their x,y location on the image. It works similar to the Image Overlay panel for configuration. It provides different methods for drawing this gradient along with customizable color value map.
Important Note: The chart loads data when the dashboard loads but does not automatically refresh - the minimum refresh rate is 60 seconds.. A refresh button is provided for the user to refresh the chart manually also.
Configuration options
This panel supports displaying multiple asset signals on top of an image. When the dashboard is unlocked, the signals can be moved around the image. The location of each signal provides the x,y coordinates that are used by the color overlay mapping function.
| Option | Default | Description |
|---|---|---|
| Refresh Interval | 60 seconds | Time period for automatic refresh of the color gradient. |
| Method | linear | Specifies the method function for drawing the overlay color gradient over the entire image based on the signal values and x,y locations. |
| Radius | 0 | Used with the 'gaussian' method |
| Enable Transparency | Off | Set the min and max values in which any value below the min and above the max will be transparent in the overlay color heat map. |
| Value Colors | Specify an array of values and colors that are used by the overlay color heat map. On creation, provides 0 to 100, with increments of 10 with a color mapping. These colors and values can be edited, deleted, and added. |