Panel: Image Overlay
This dashboard panel displays asset data overlaid on an image. Great for displaying signal health and key performance indicators across floor plans, as well as associating sensor readings on images of multi-sensor assets. Configurable position of signals, coupled with their battery and signal strength where appropriate. Capable of displaying up to 50 signals.
What it looks like
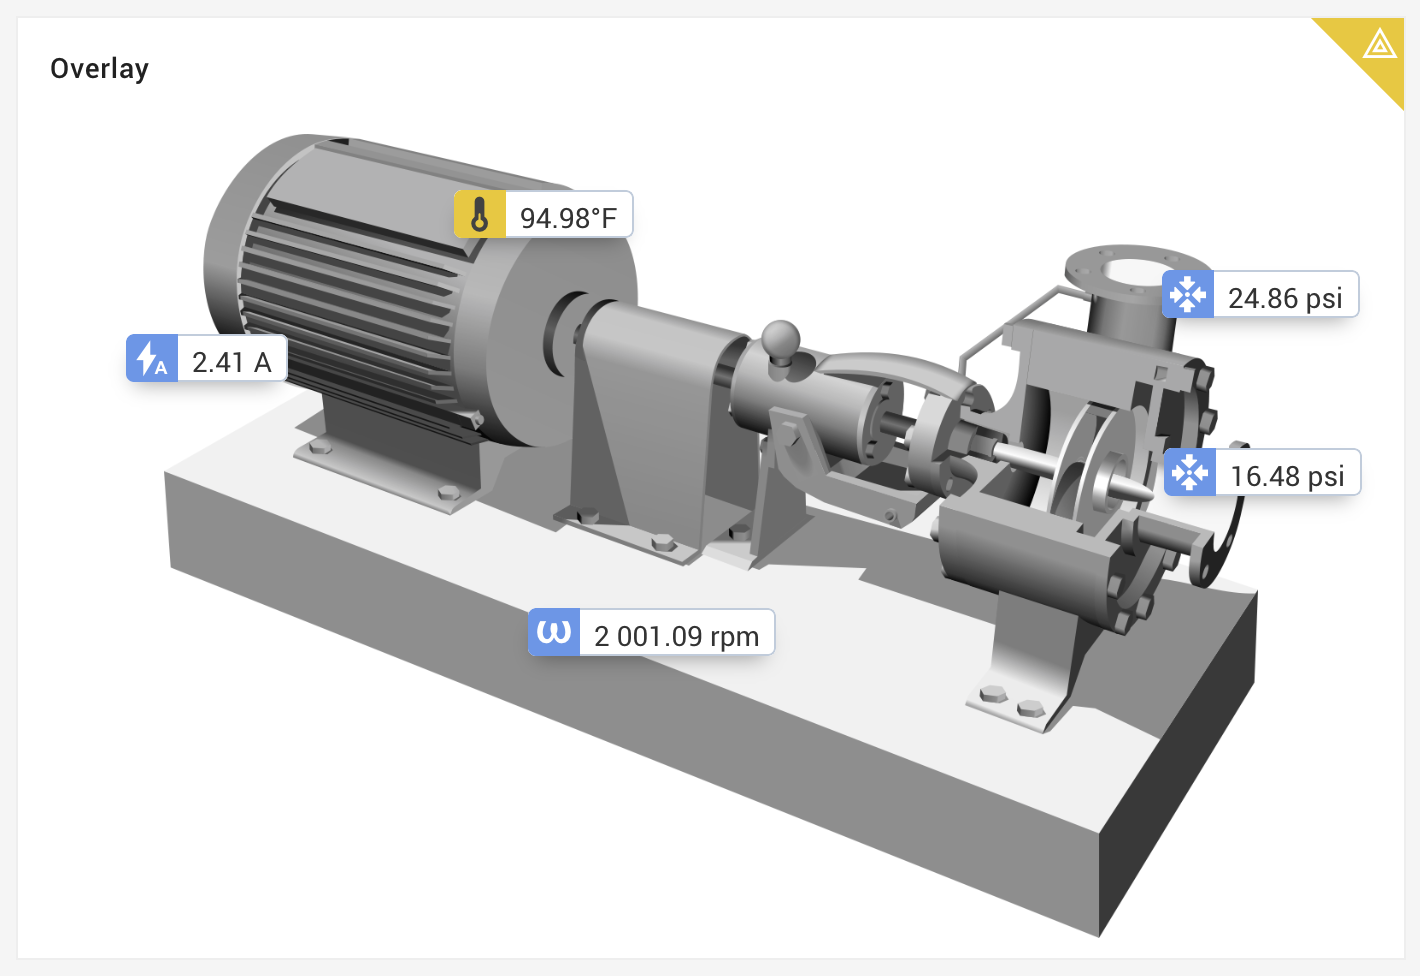
The overlay panel is an image based visualization that has the ability to display signal values or asset statuses on top of an image. This provides a user with immediate feedback on the value and state (critical, warning, etc) of the signal. Use cases for typical usage include for a machine image or system diagram with sensor data displayed at the measurement points on the physical asset.
Optional configuration allows for displaying condition states for signals based on associated condition rules. Values and graphic update realtime based on new data for the signal(s).
Configuration options
| Configuration Item | Description |
|---|---|
| Signal(s) / Asset(s) | This panel supports up to 50 signals and/or assets, choose on 2nd step. |
| Panel Title | The name the panel will use. |
| Background Image | The background image to display. Supports PNG, BMP, TIFF, GIF, and JPEG, as well as SVG and DXF. |
| Icon Size | Size of the signal card elements (Huge, Large, Compact, Tiny). Tiny will only show a colored circle (status only). |
| Signal Units | Use the default Signal Specified Visualization Units (recommended) to dynamically adjust based on the user or choose a specific unit. |
| Signal Status | When available, use a rule to show status of the specific signal. |
Location of Signal/Asset Elements
When viewing the dashboard in edit mode, you may move the location of the signal and/or asset elements on the image. To move, click and hold on an element and move it to a new location.
Example with Status Values
Example when using Timeouts
Using with Assets
When selecting assets to show on an Image Overlay, clicking on the asset will show a card with up to 4 signals. If the Asset has any signals (up to 4) marked as a Favorite, these signals will be shown. If the asset has no Favorite signals marked, the card will show any 4 signals in no specific order.
Asset Template Overrides
Although dashboards that are a part of a template typically are locked from editing, the Image Overlay panel is an exception that does allow some configuration while maintaining the link to the template.
If you do not see this option on the image overlay panel when linked to a template, have the Asset Template owner save a new version of the template and migrate assets to it.
Existing Asset Templates need to be saved as a new version and a migration for all assets is required to use this new functionality.
The image overlay panel will show an icon next to the panel's name. When clicking this, the override options to save a new image, save the configuration, and to clear back to the template will be shown. The image and the location of signal value cards may be edited.