Panel: Operating Plot
Overview
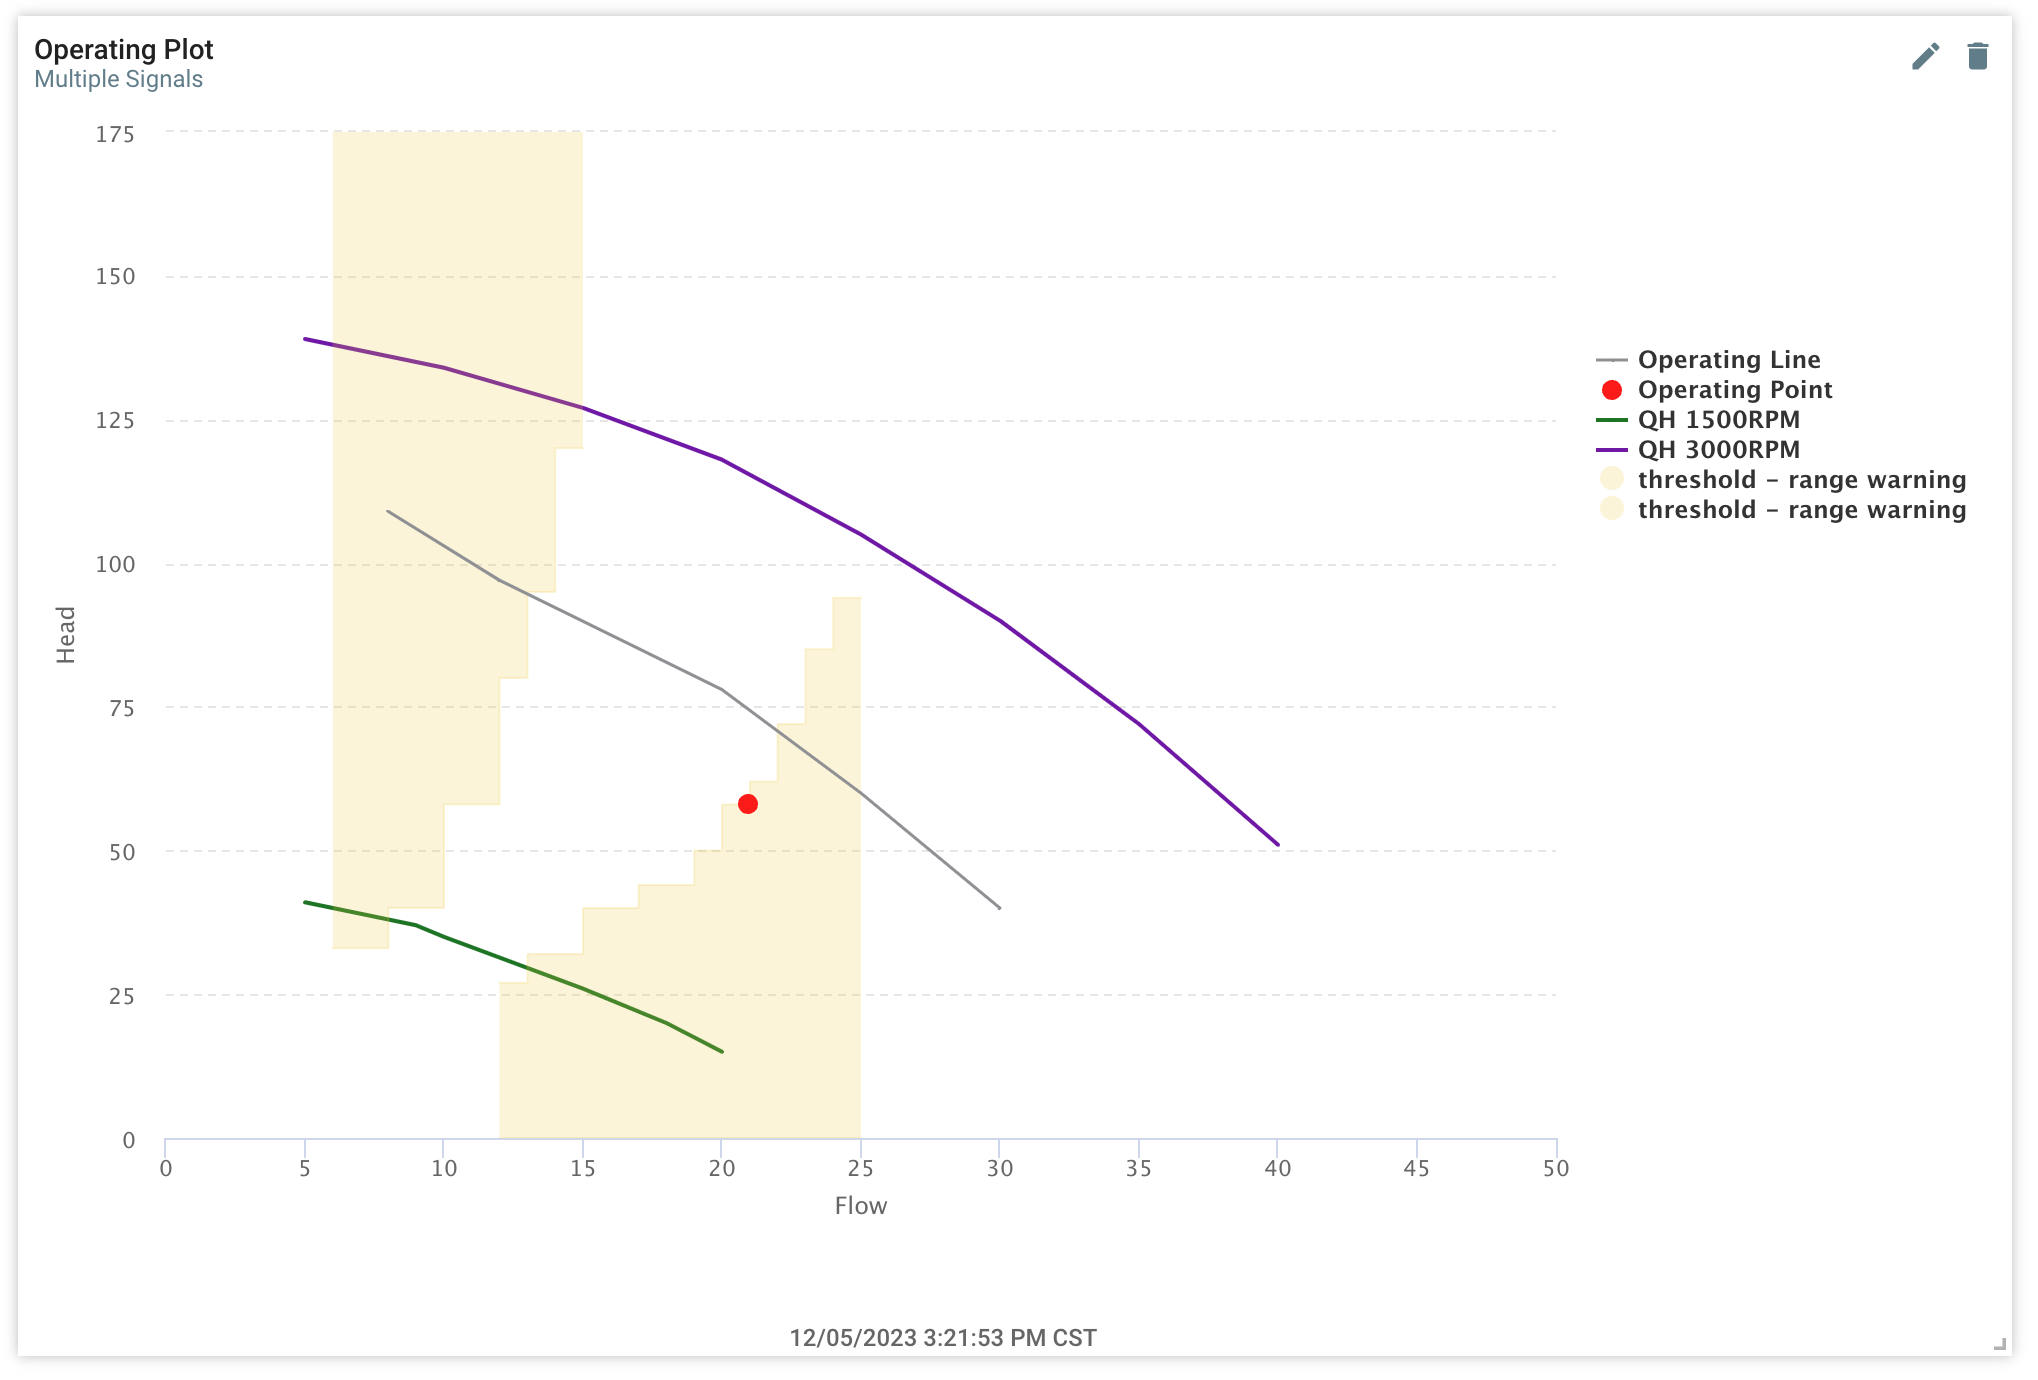
The Operating Plot panel is used to plot lines and points on a chart using sets of data in a array, typically for visualizing current operating states of equipment that use 2D data sets.
This panel allows displaying two dimensional data (i.e. X vs Y) such as Head vs Flow for a pump at a specific time point.
Sources of Data / Formats
The panel supports providing a Point or Line (connected points) in three ways.
- Signals of the type
ARRAY_POINTS, where a single value is an array of points, 1 or more. - Metadata fields that contain a string that use the same format as the
ARRAY_POINTSsignals. - Statically defined string in the panel configuration using the same format.
Examples:
Array of Points value for a line: [[10,12],[23,42],[56,98.6]]
Array of Points value for a point: [[20.5, 160.3]]
Configuration
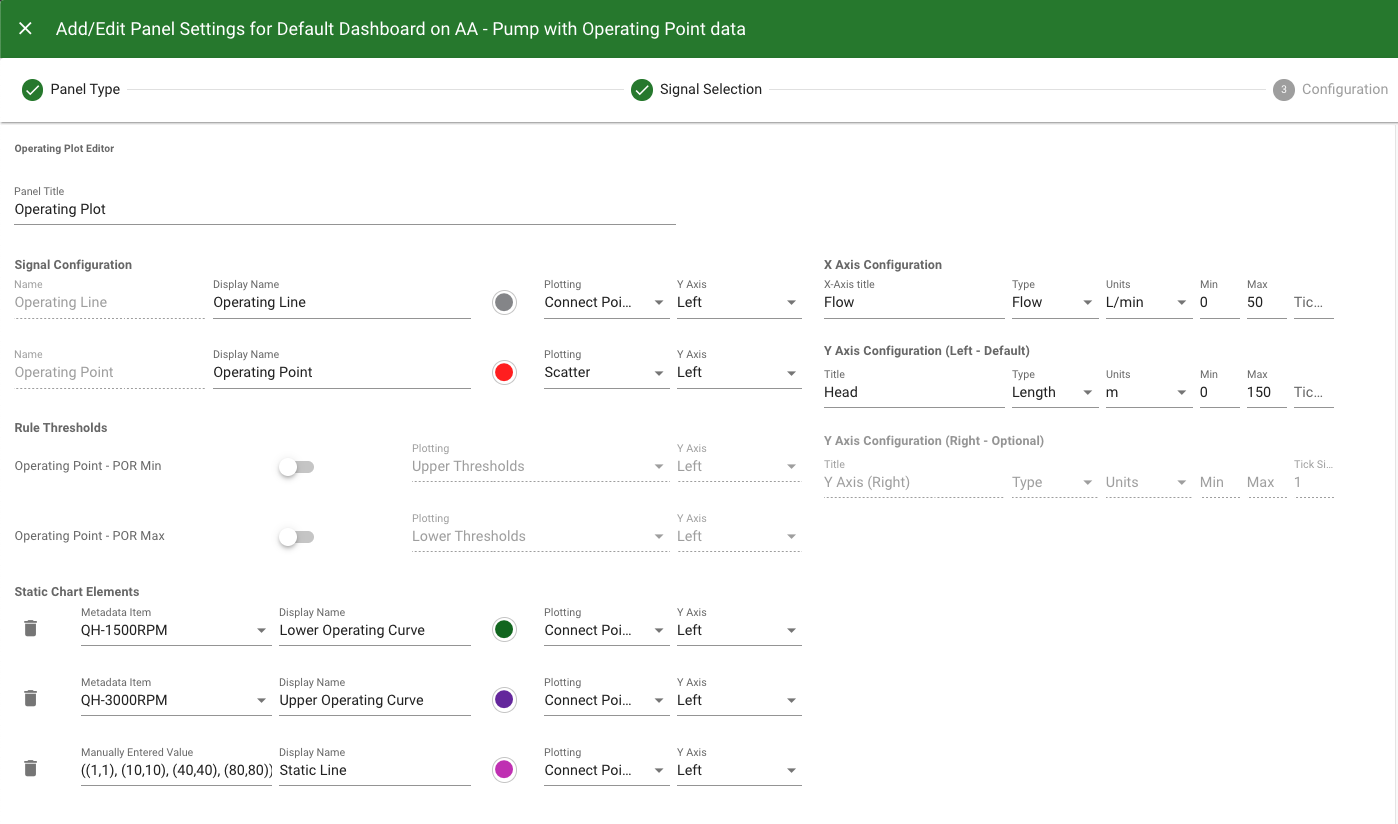
Panel and Signals
| Configuration Item | Description |
|---|---|
| Panel Title | The name the panel will use |
| Signal Display Name | Optional name that will be used for the signal instead of it's name |
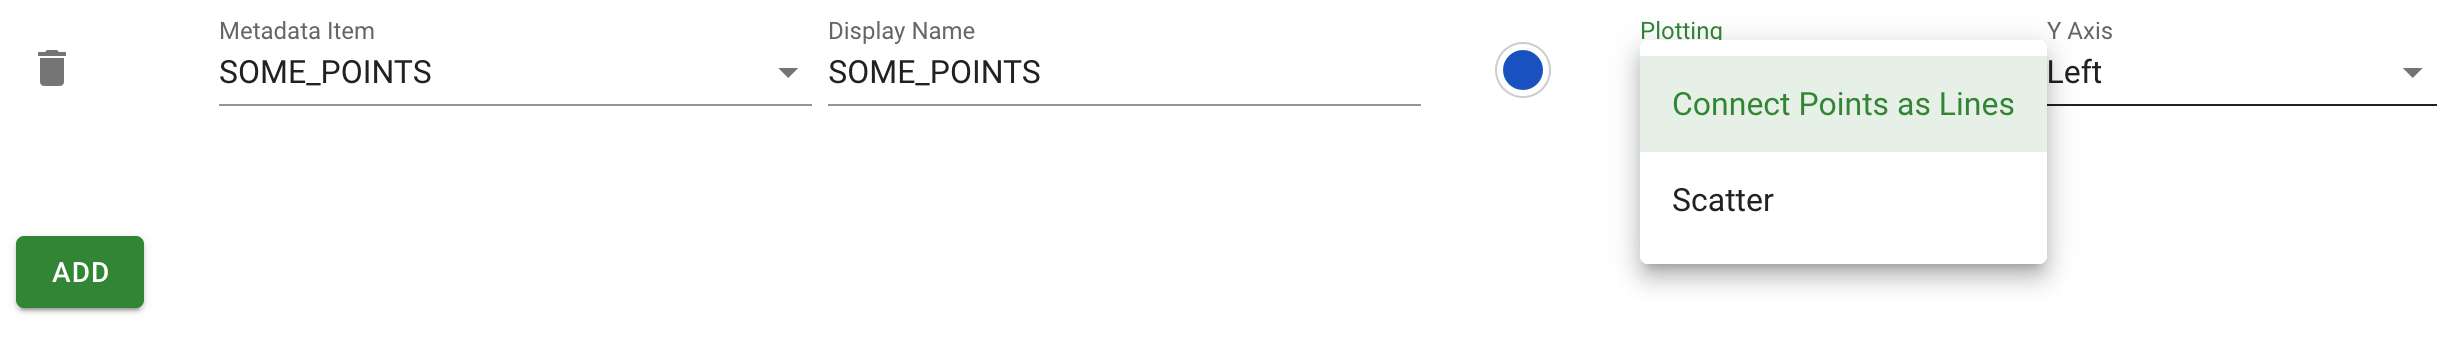
| Color | Using the color selector you can choose which color will be used for the points / line. |
| Plotting | How the points will be plotted
|
| Y Axis | Defaults to Left Y axis. A Right Y axis can also be set up and used. |
Axis
The following are available for the X and both Y (right, left) axis.
| Configuration Item | Description |
|---|---|
| Axis Title | Optional title for this Axis |
| Axis Type | Optional data type for the Axis (Default is custom text) |
| Axis Units | Optional units for this Axis based on selected type. |
| Axis Precision | Optional precision setting for the values on this Axis. |
| Axis Min / Max | Allows specifying exact min and/or max of the Axis range. Will automatically range if left blank |
| Axis Tick Size | Allows specifying exact tick size for the axis range. Will automatically choose if left blank |
Line vs Point
If the element has only one point, it will be displayed as a single point on the plot. If the element has multiple points defined, it will be displayed as either a Connected Line or as a Scatter of individual points depending on the 'Plotting' setting.
Rule Thresholds
Array Rules, if found on any signals can be visualized on the panel. Each rule may be enabled / disabled. The Array Rules are a set of X indexes and Y ranges, essentially a 'box'. They can be visualized as either their lower Y threshold, upper Y threshold, area, or both upper and lower Y thresholds.
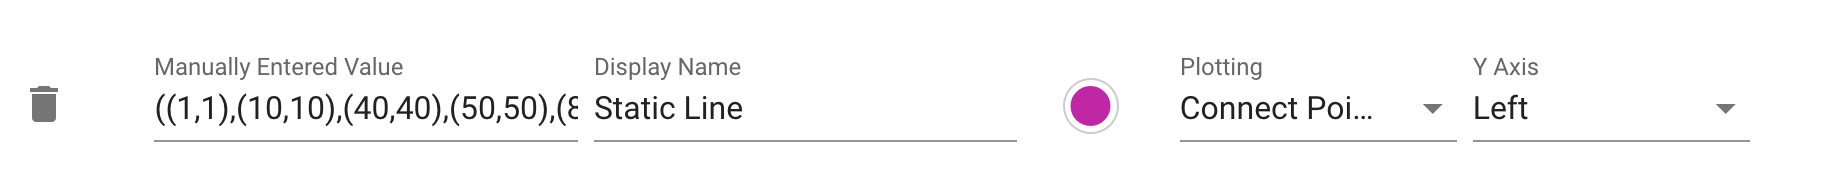
Static Chart Elements
This panel allows using static data sets, in the form of metadata fields or manually entered data into the panel. These elements behave the same as a signal, using the same format of data. The same plotting options are available including color, name, plotting view, and Y axis.
Static Points and Line Data
The value entered of ((1,1),(10,10),(40,40),(50,50),(80,80)) would draw a straight line on the chart.
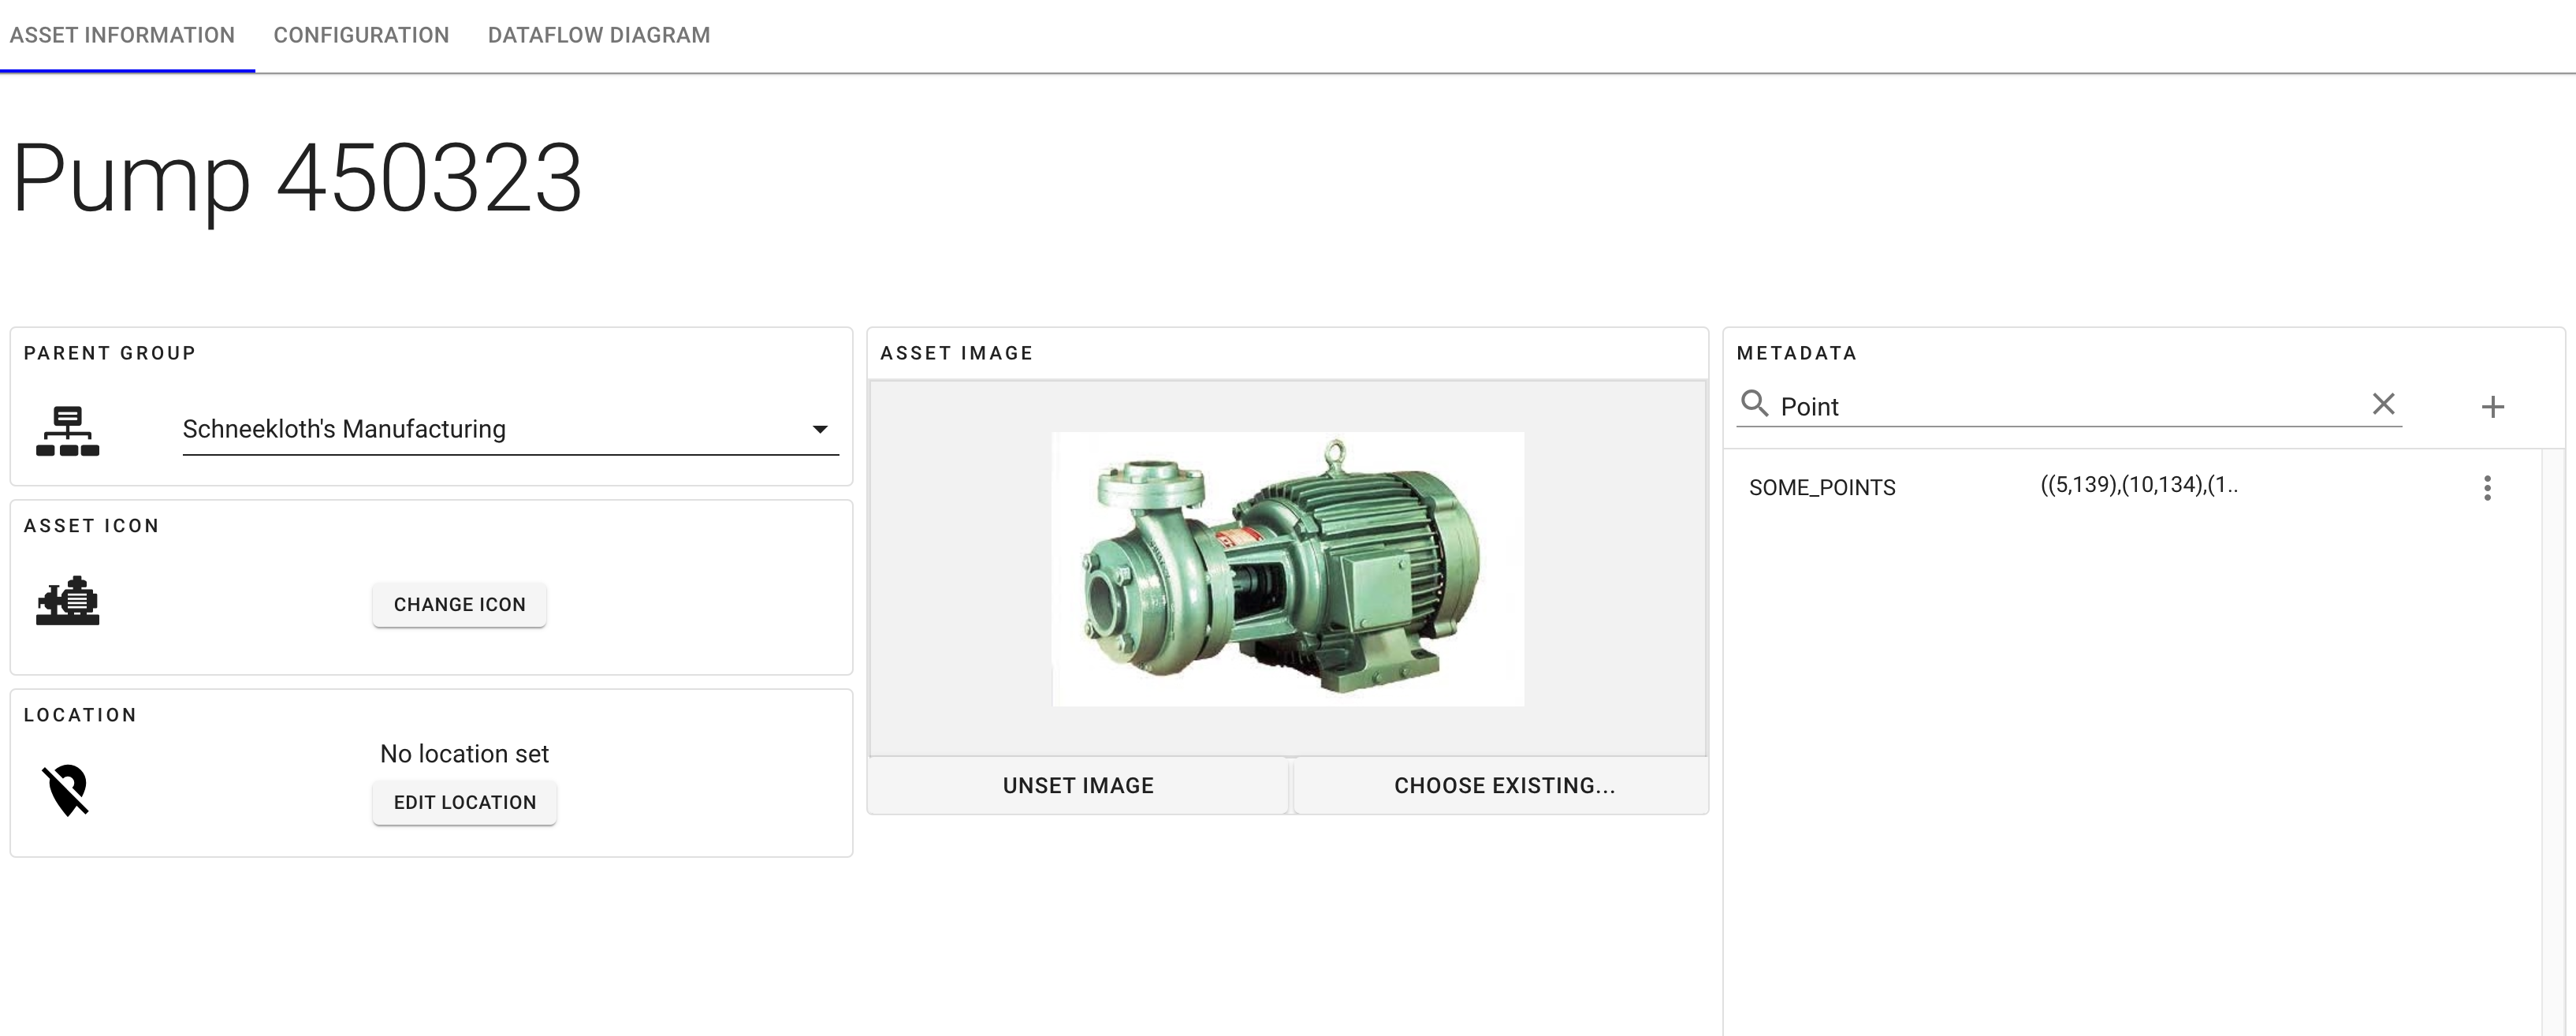
Metadata for Points and Lines
Metadata must be created in the Asset Configuration.
Usage Tips
How many lines and/or point sources can be plotted?
- This panel allows plotting multiple Array of Points signals at a time.
- This panel allows plotting multiple metadata fields containing Array of Points strings.
- This panel allows plotting multiple static fields containing Array of Points strings.
Size of 2D Array data sets
This panel should be used for array data of 200 points or less.