Panel: Signal History
Overview
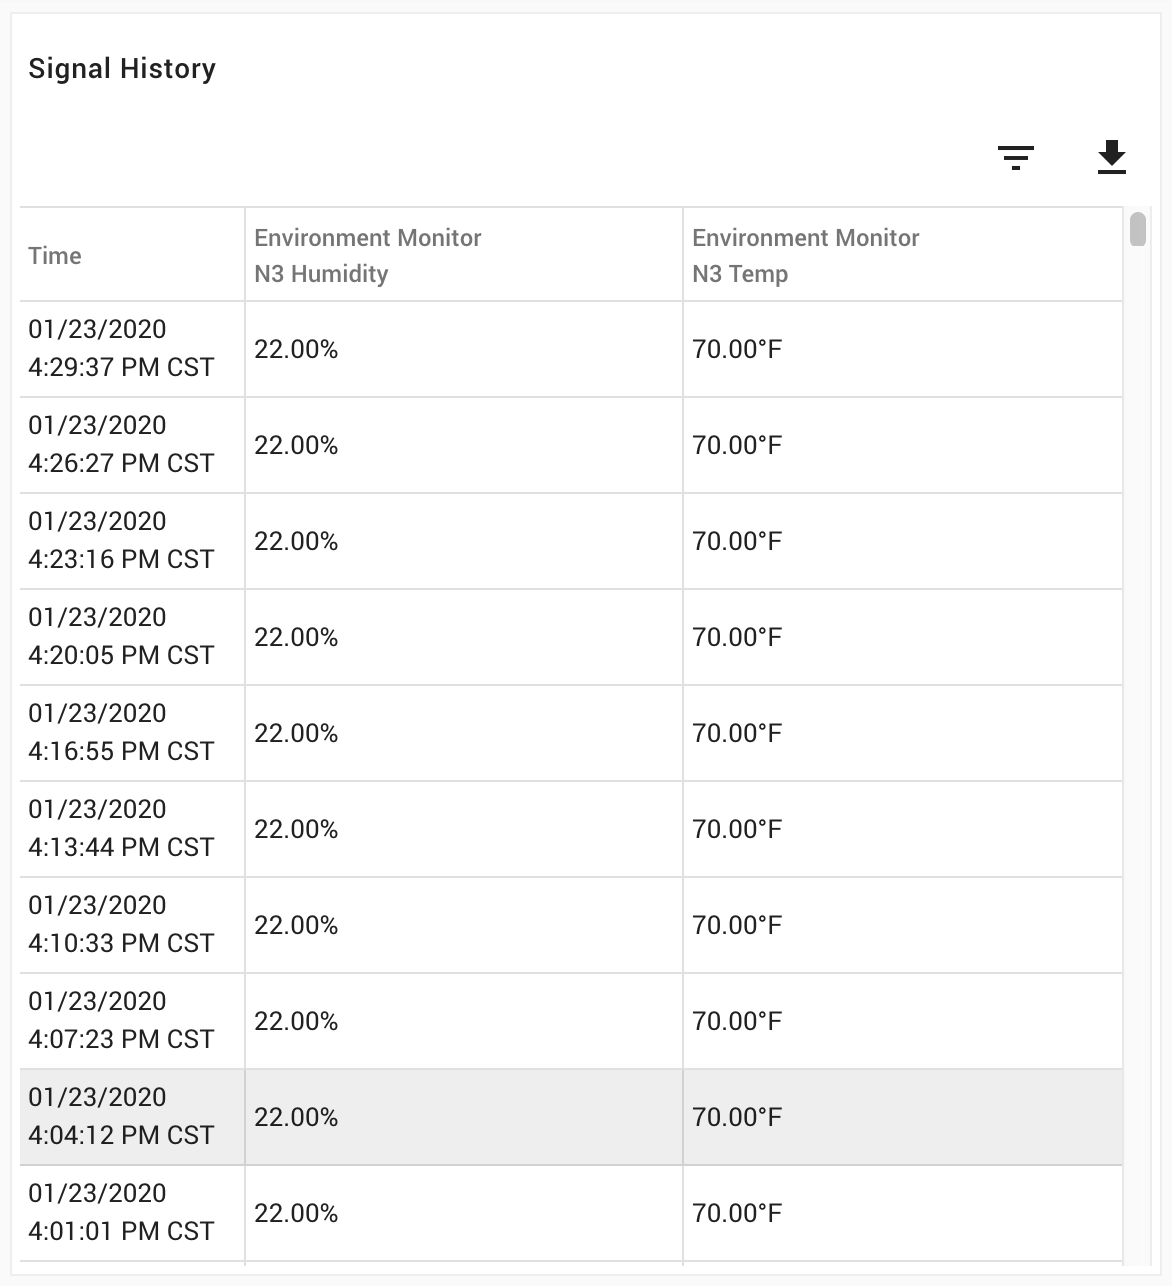
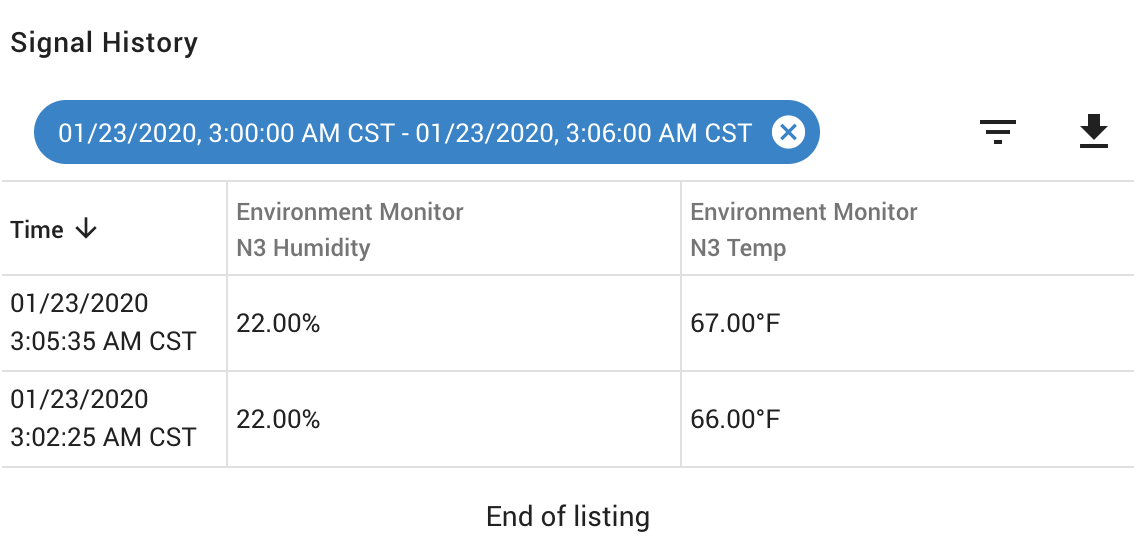
This dashboard panel provides users with a tabular view of historical data for one or multiple signals. Each value is shown at its timestamp. When using multiple signals, if a value does not exist for a signal but does for another, a blank will be shown. Users may filter the date/time to look for a specific time period of values.
A link button is provided for the Reports page to generate an export of the signal data that the user is currently looking at. When clicked, the user will be brought to the Reports page with all the information already filled out, ready to click 'Queue Report'.


Configuration options
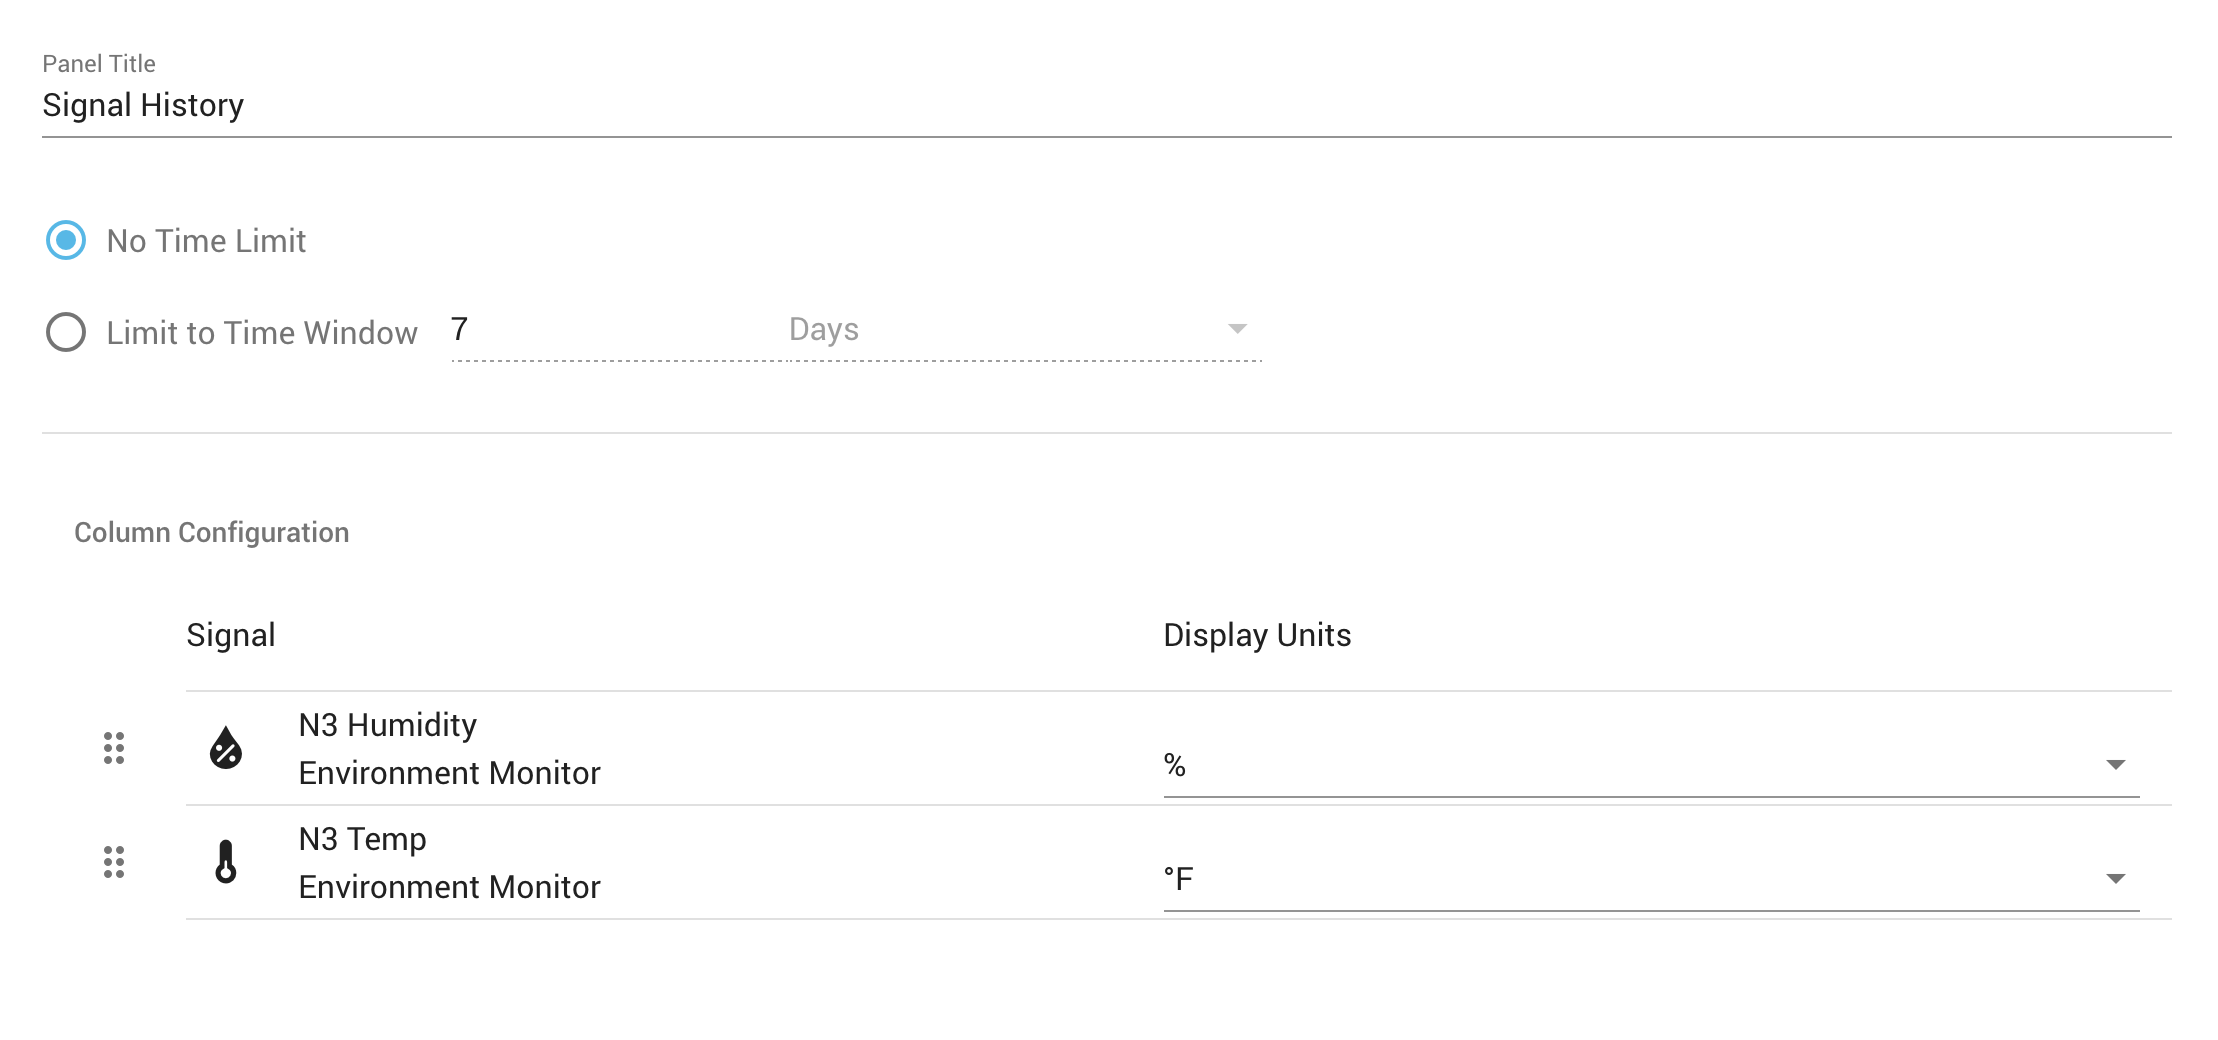
- Asset signals to display (max 5)
- Time limit
- No Time Limit - Will continue to load historical data as the user scrolls. User can filter for specific time period
- Limit to Time Window - Only will load the time period specified and will not allow going farther back in time.
- Signals
- Display units - Use the default Signal Specified Visualization Units (recommended) to dynamically adjust based on the user or choose a specific unit.
