Panel: State Timeline
Overview
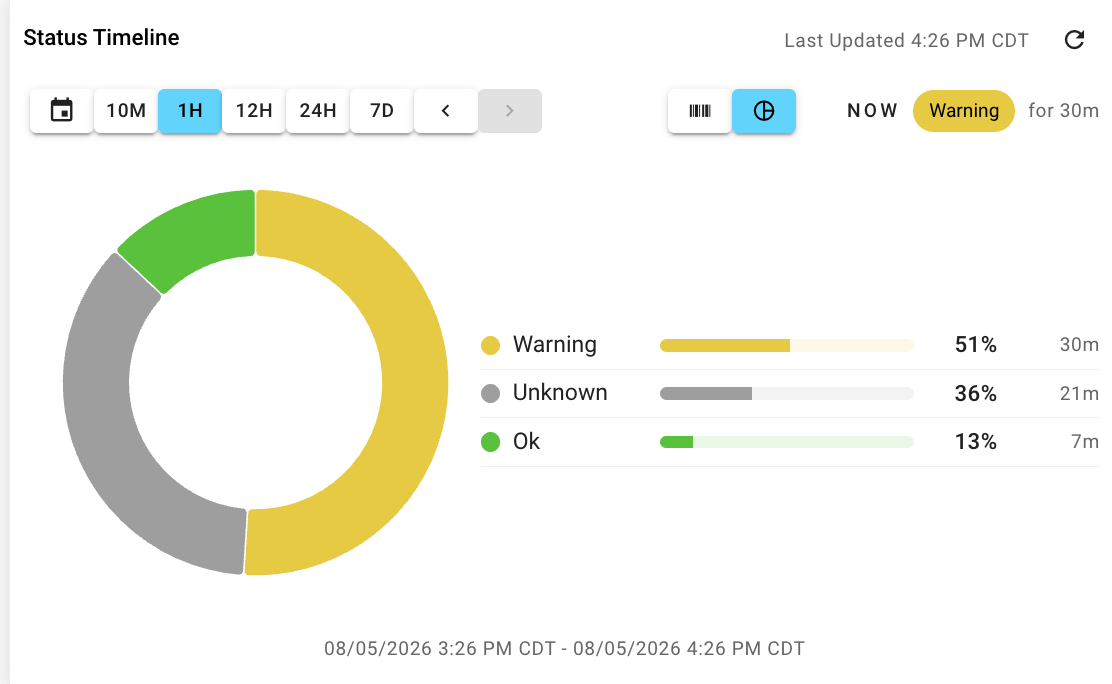
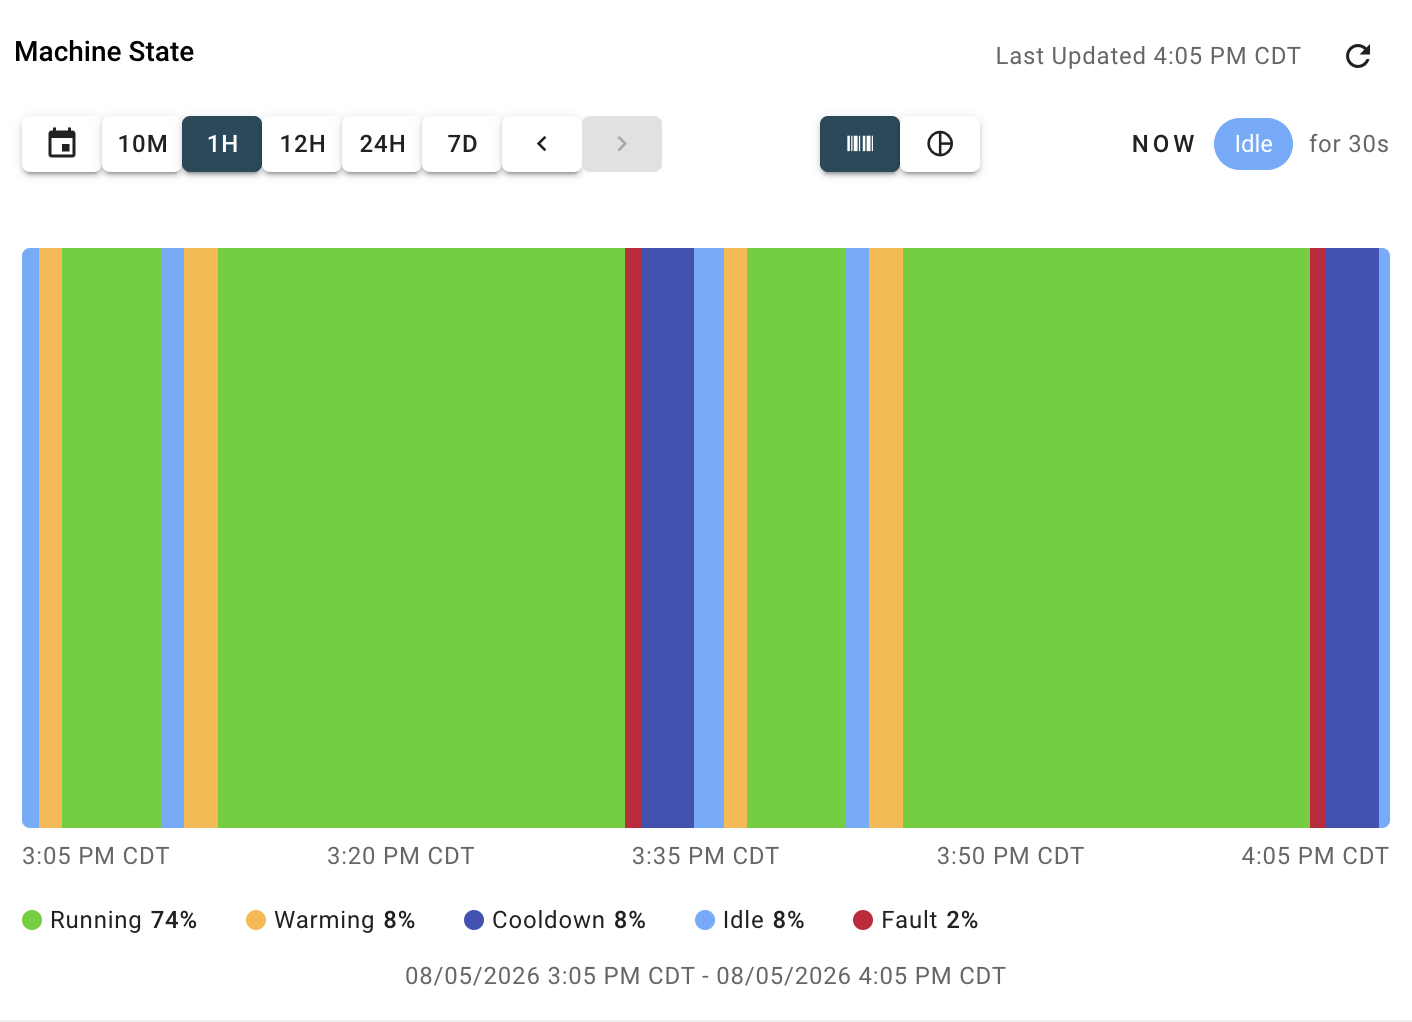
The State Timeline panel shows how much time an asset spent in each state over a time period, displayed as a horizontal timeline band of colored segments, along with a summary view of the total time and percentage spent in each state. States can be driven by a Signal's value, a Rule's status, or an Asset's overall status.
Configuration
Panel Options
| Configuration Item | Description |
|---|---|
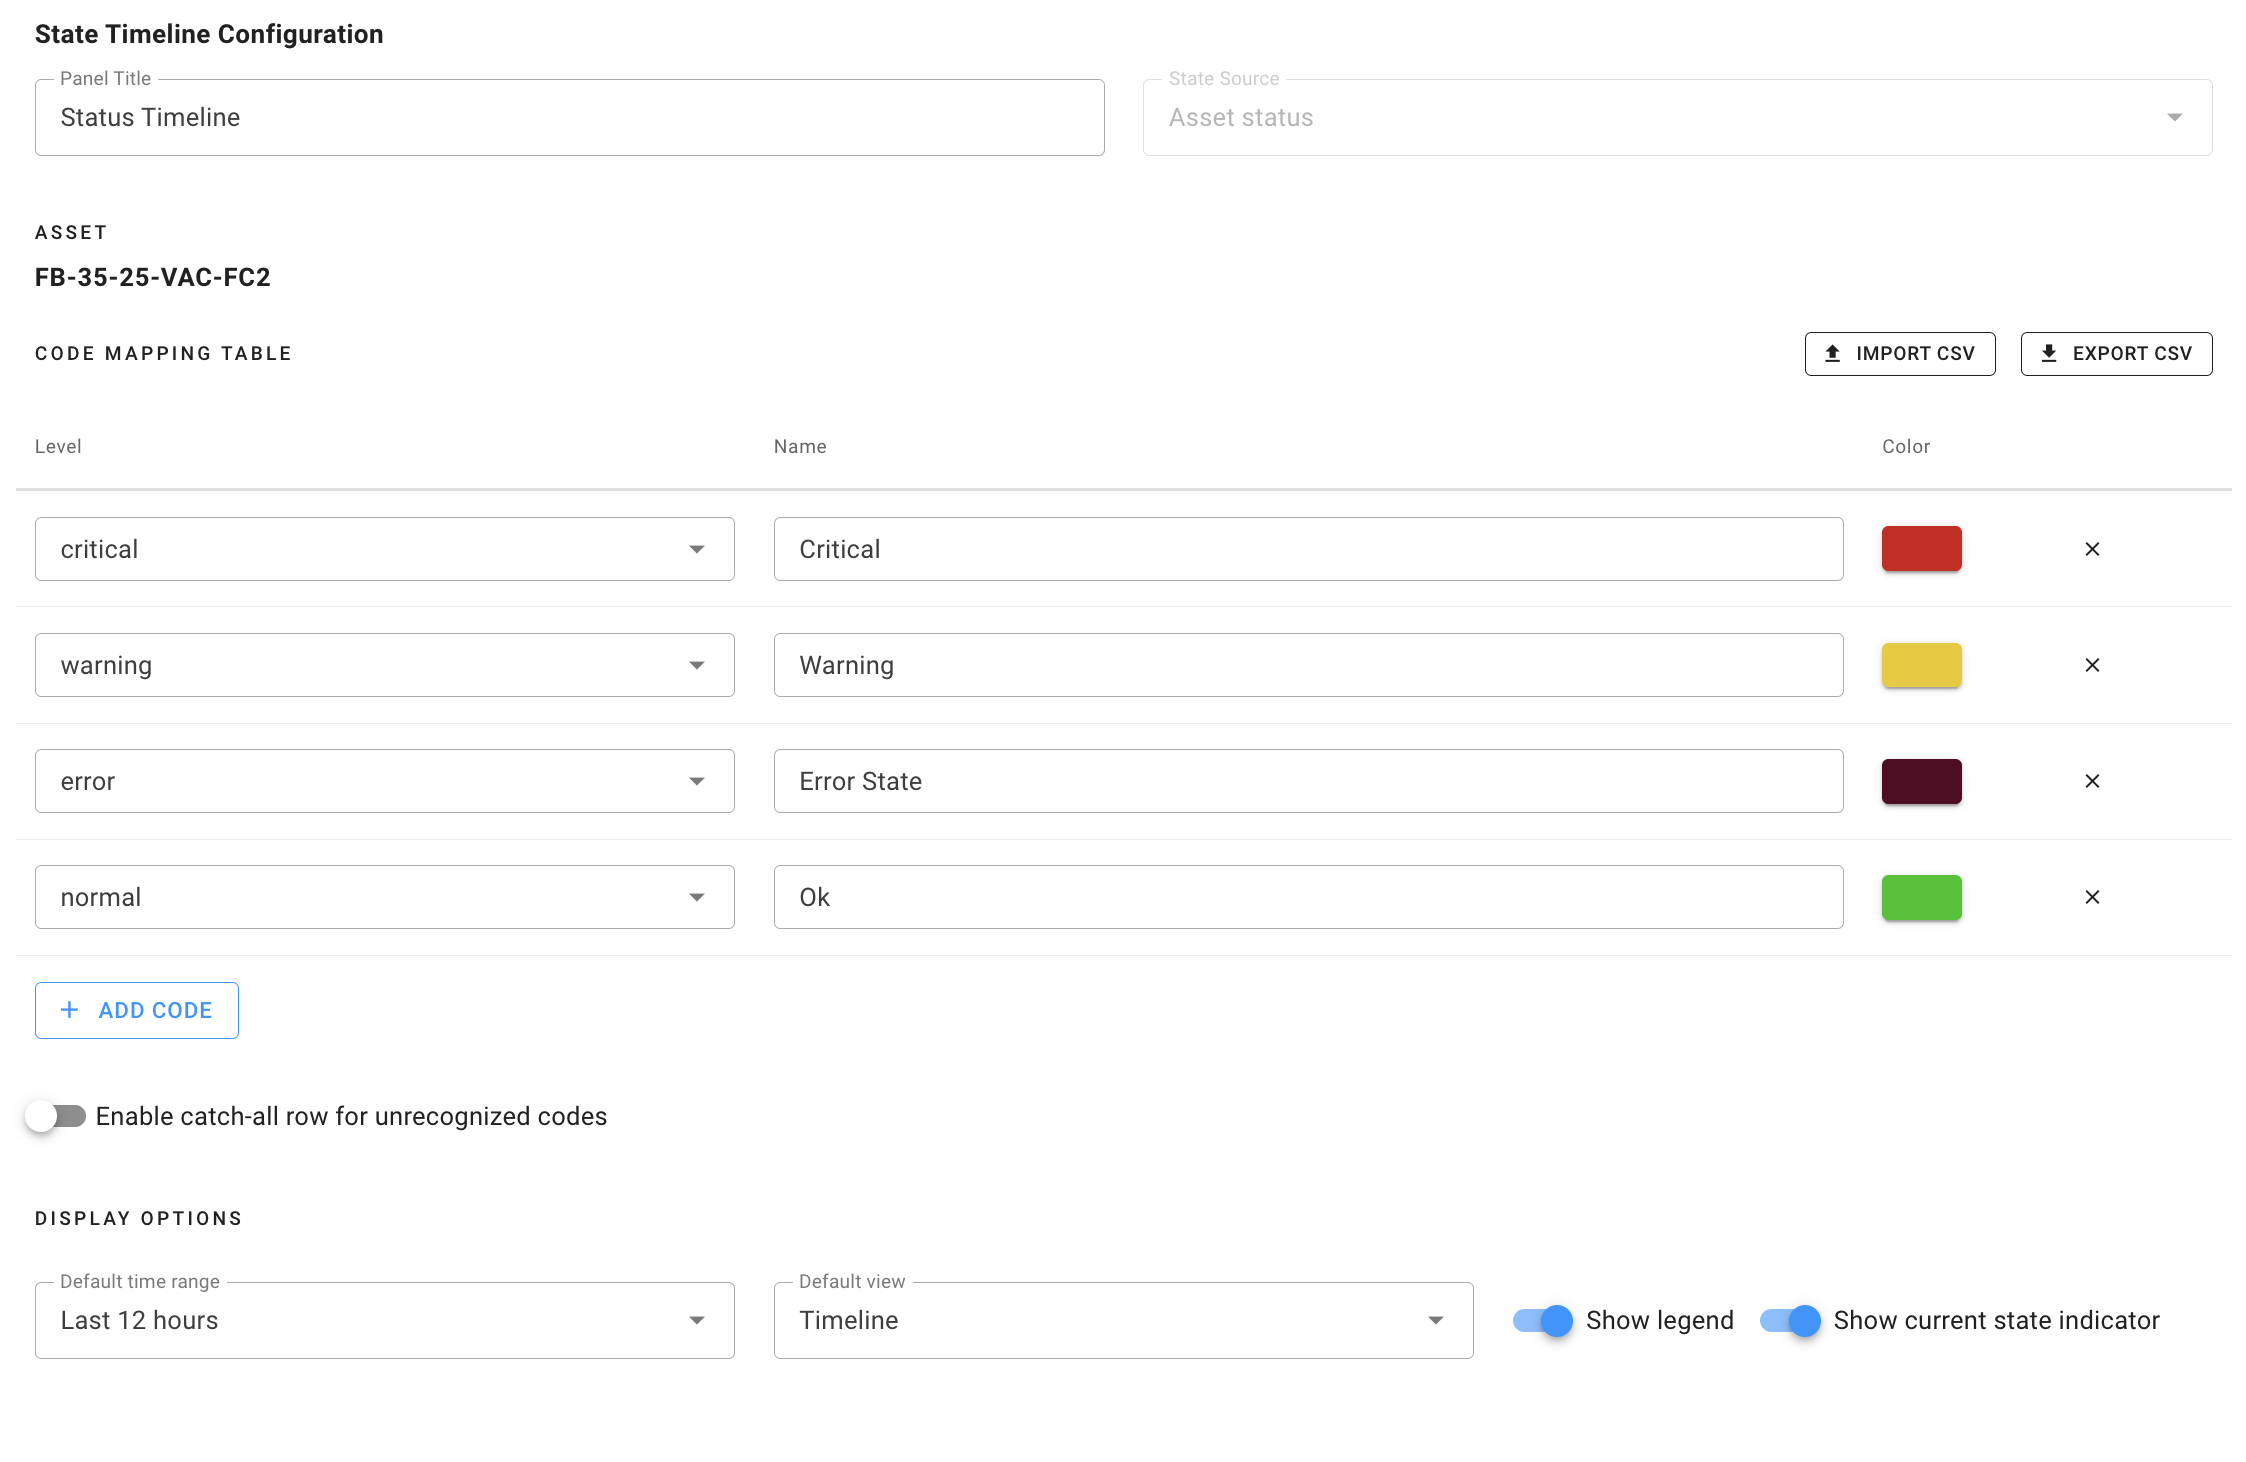
| Panel Title | The name the panel will use |
| State Source | What drives the state shown on the timeline: Signal Value, Rule Status, or Asset Status. Rule Status is only offered when the selected signal has at least one rule; Asset Status is used when an asset (rather than a signal) is chosen in step 2. |
| Default Time Range | The default rolling time window shown when the panel loads |
| Default View | Whether the panel opens on the Timeline band or the Summary view |
| Show Legend | Whether to show the state legend/summary alongside the timeline |
| Show Current State Indicator | Whether to show a "NOW" indicator with the current state and how long it's been active |
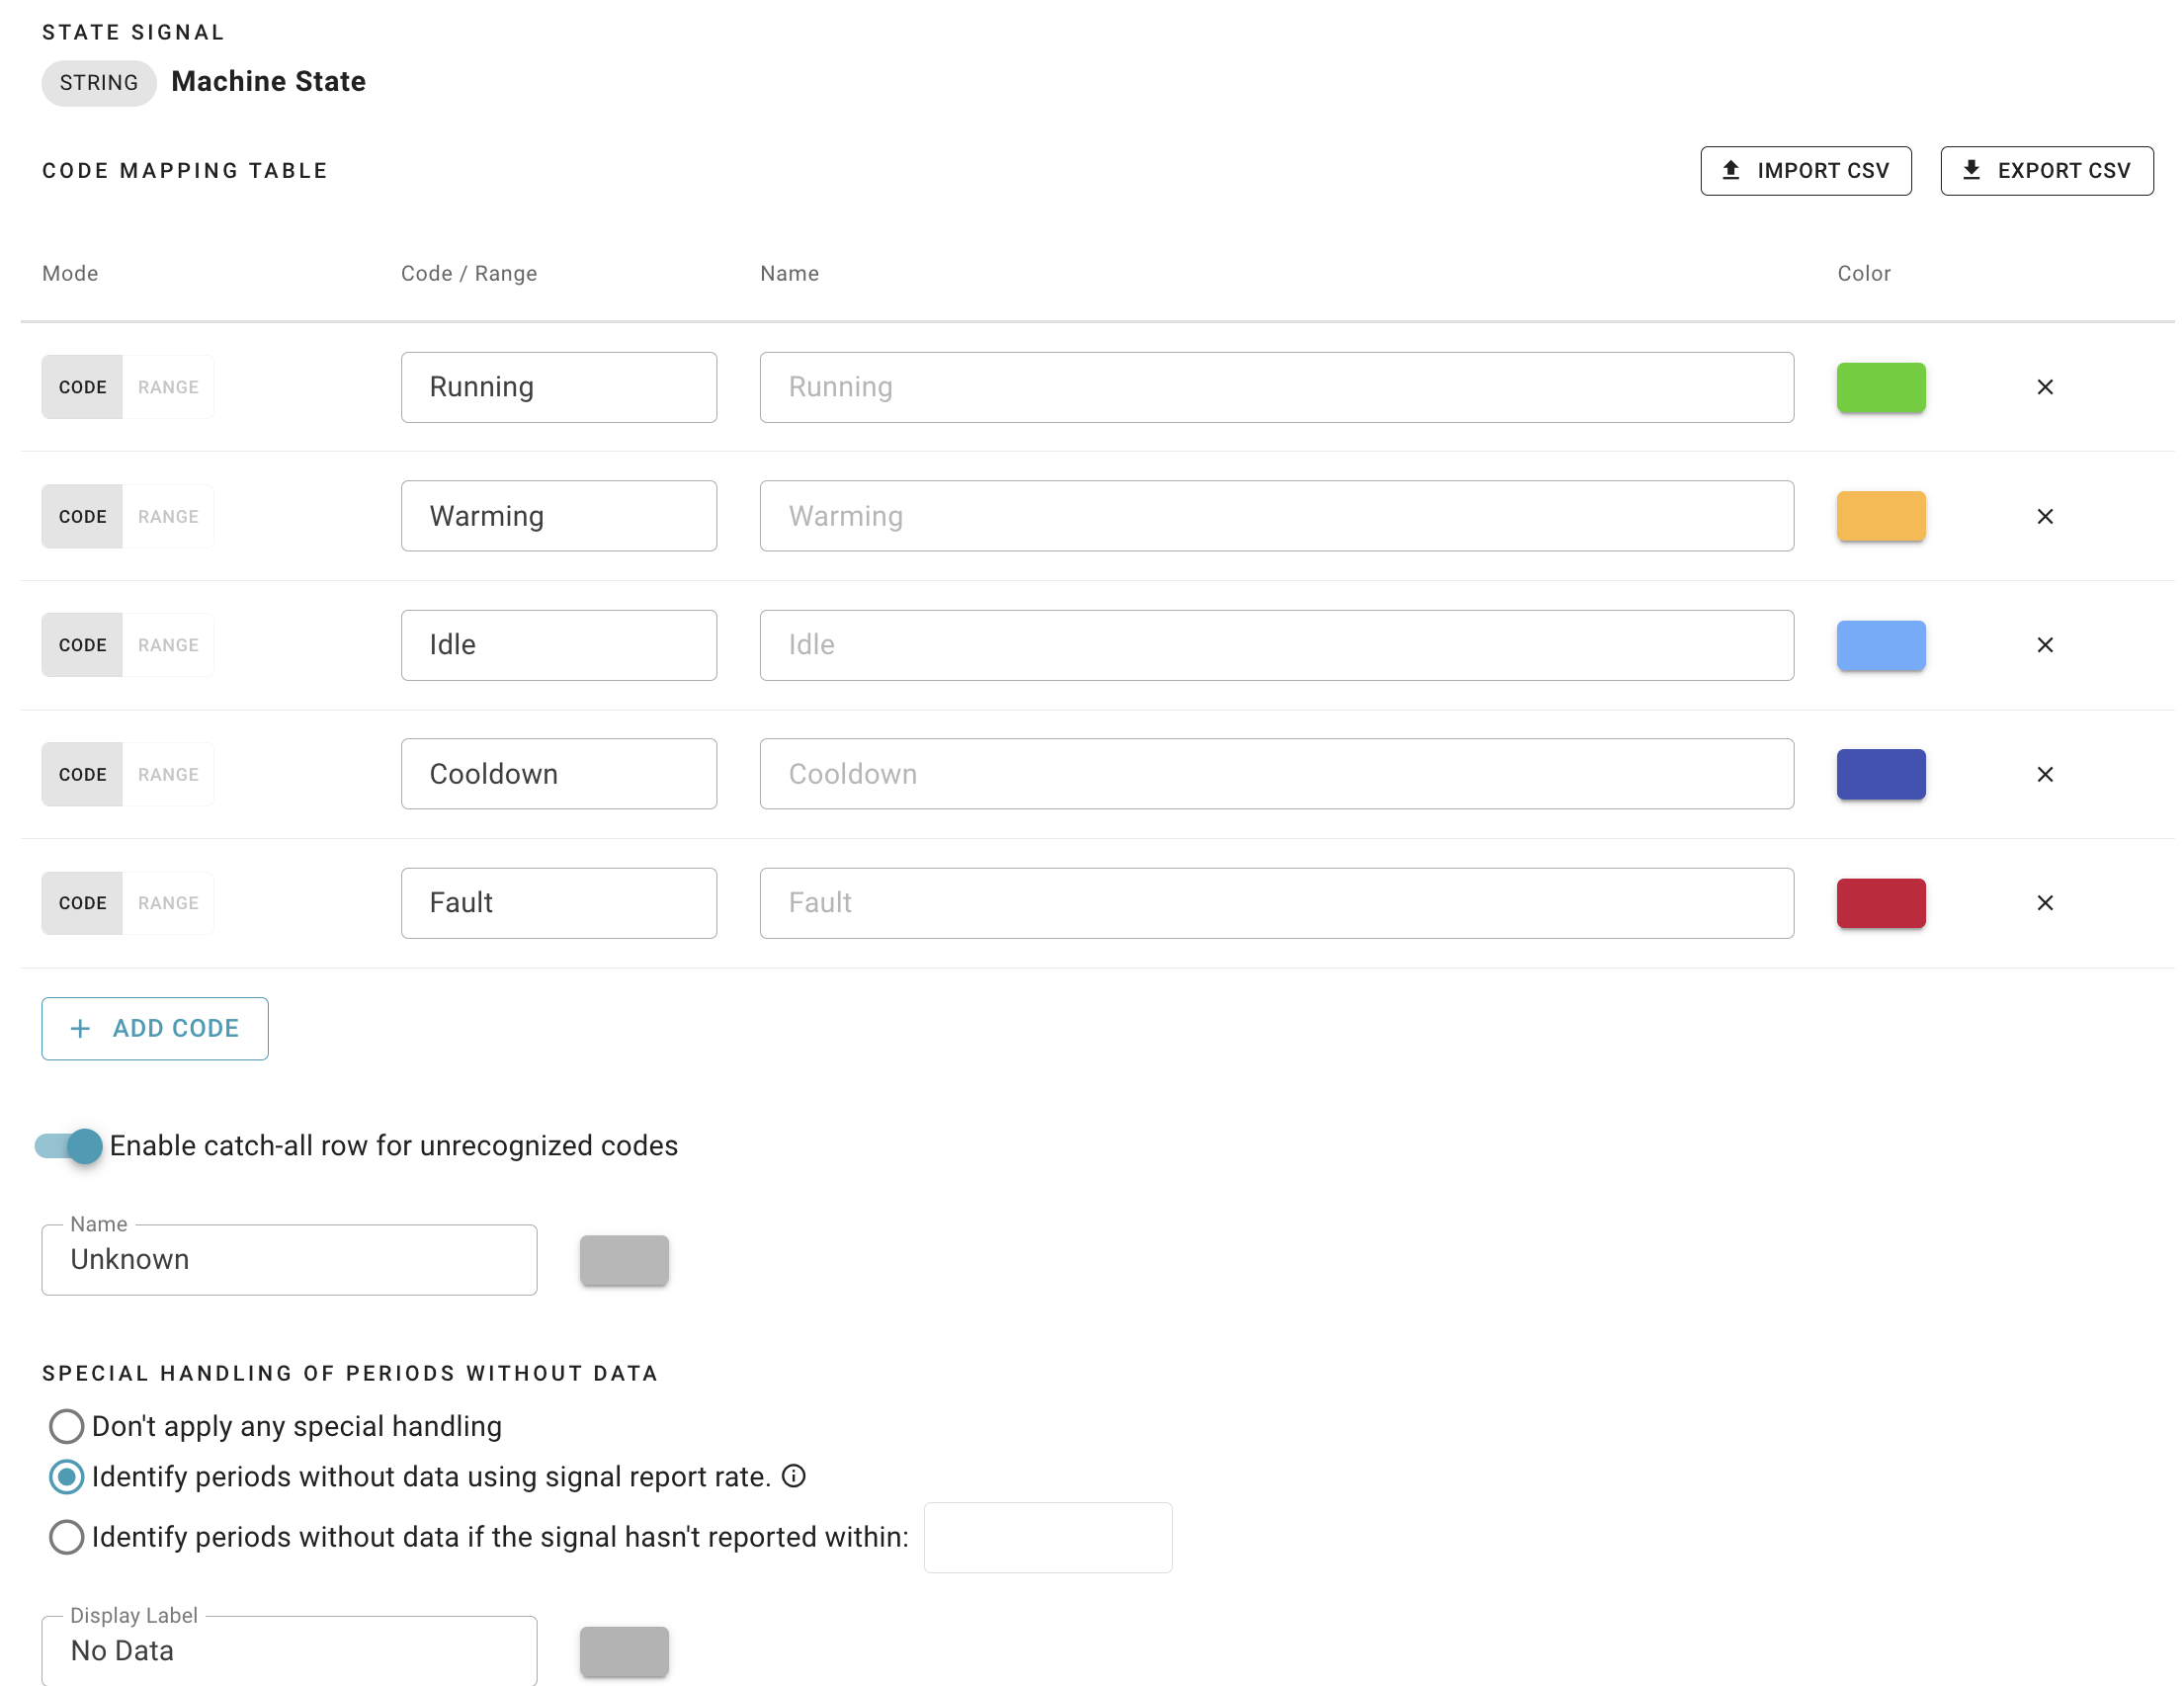
State Mapping
States are configured with a mapping table, similar to the Key Indicator and Configurable Signal Log panels:
- Signal Value source — map specific values (Interpret) or numeric ranges (Range) to a Name and Color.
- Rule Status / Asset Status source — map each severity level (Error, Critical, Warning, Informational, Normal) to a Name and Color.
An optional catch-all row can be enabled to give any unmatched value its own Name and Color. The mapping table can also be exported to a CSV file and re-imported; the catch-all is configured separately and isn't included in the CSV.
Special Handling of Periods Without Data
Available for the Signal Value source only. This lets the panel identify and label stretches where the signal isn't reporting, shown as their own segment on the timeline (default label "No Data").
| Option | Description |
|---|---|
| Don't apply any special handling | No detection — a gap in reporting isn't called out (default) |
| Identify periods without data using signal report rate | Flags a gap once it exceeds twice the signal's configured report rate |
| Identify periods without data if the signal hasn't reported within n seconds | Flags a gap using a manually specified threshold |
| Display Label / Color | The name and color used for these periods on the timeline and legend |
Using the Panel
The timeline band shows contiguous colored segments for each state over the selected window; hovering a segment shows its state, true start time, and duration in a tooltip. A "NOW" indicator (when enabled) shows the current state and how long it's persisted.
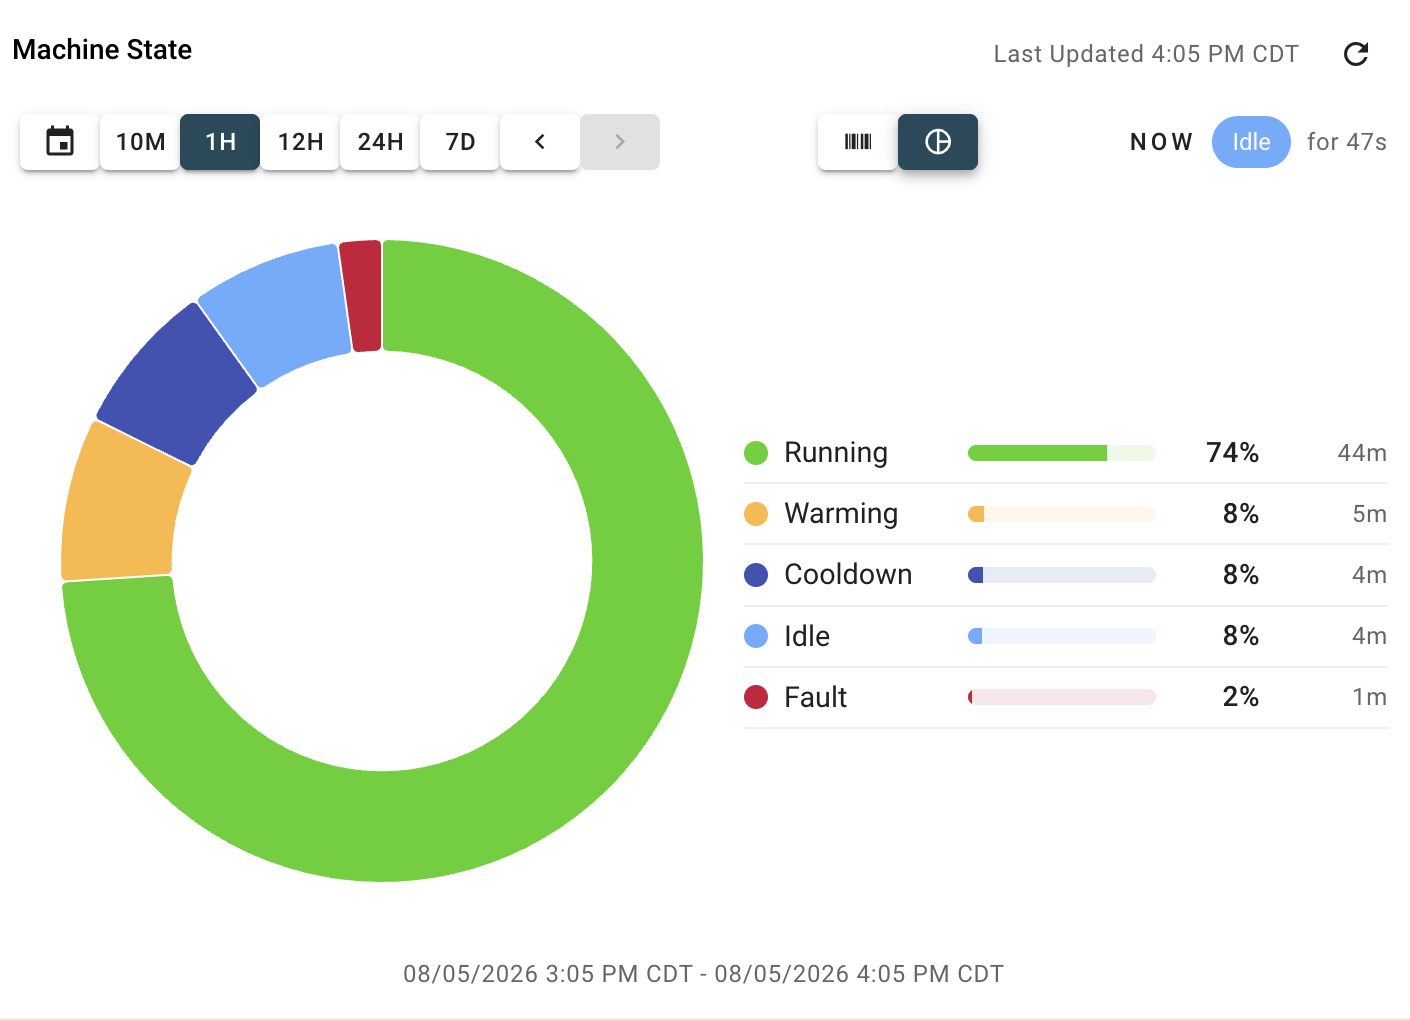
Users can switch between the Timeline and Summary tabs — the Summary tab shows a donut chart along with the total time and percentage spent in each state over the window.
Users can also drag across the band to zoom into a specific time range, and use the time range controls to step back through history or pick a custom date/time window.