Asset & Signal Statuses
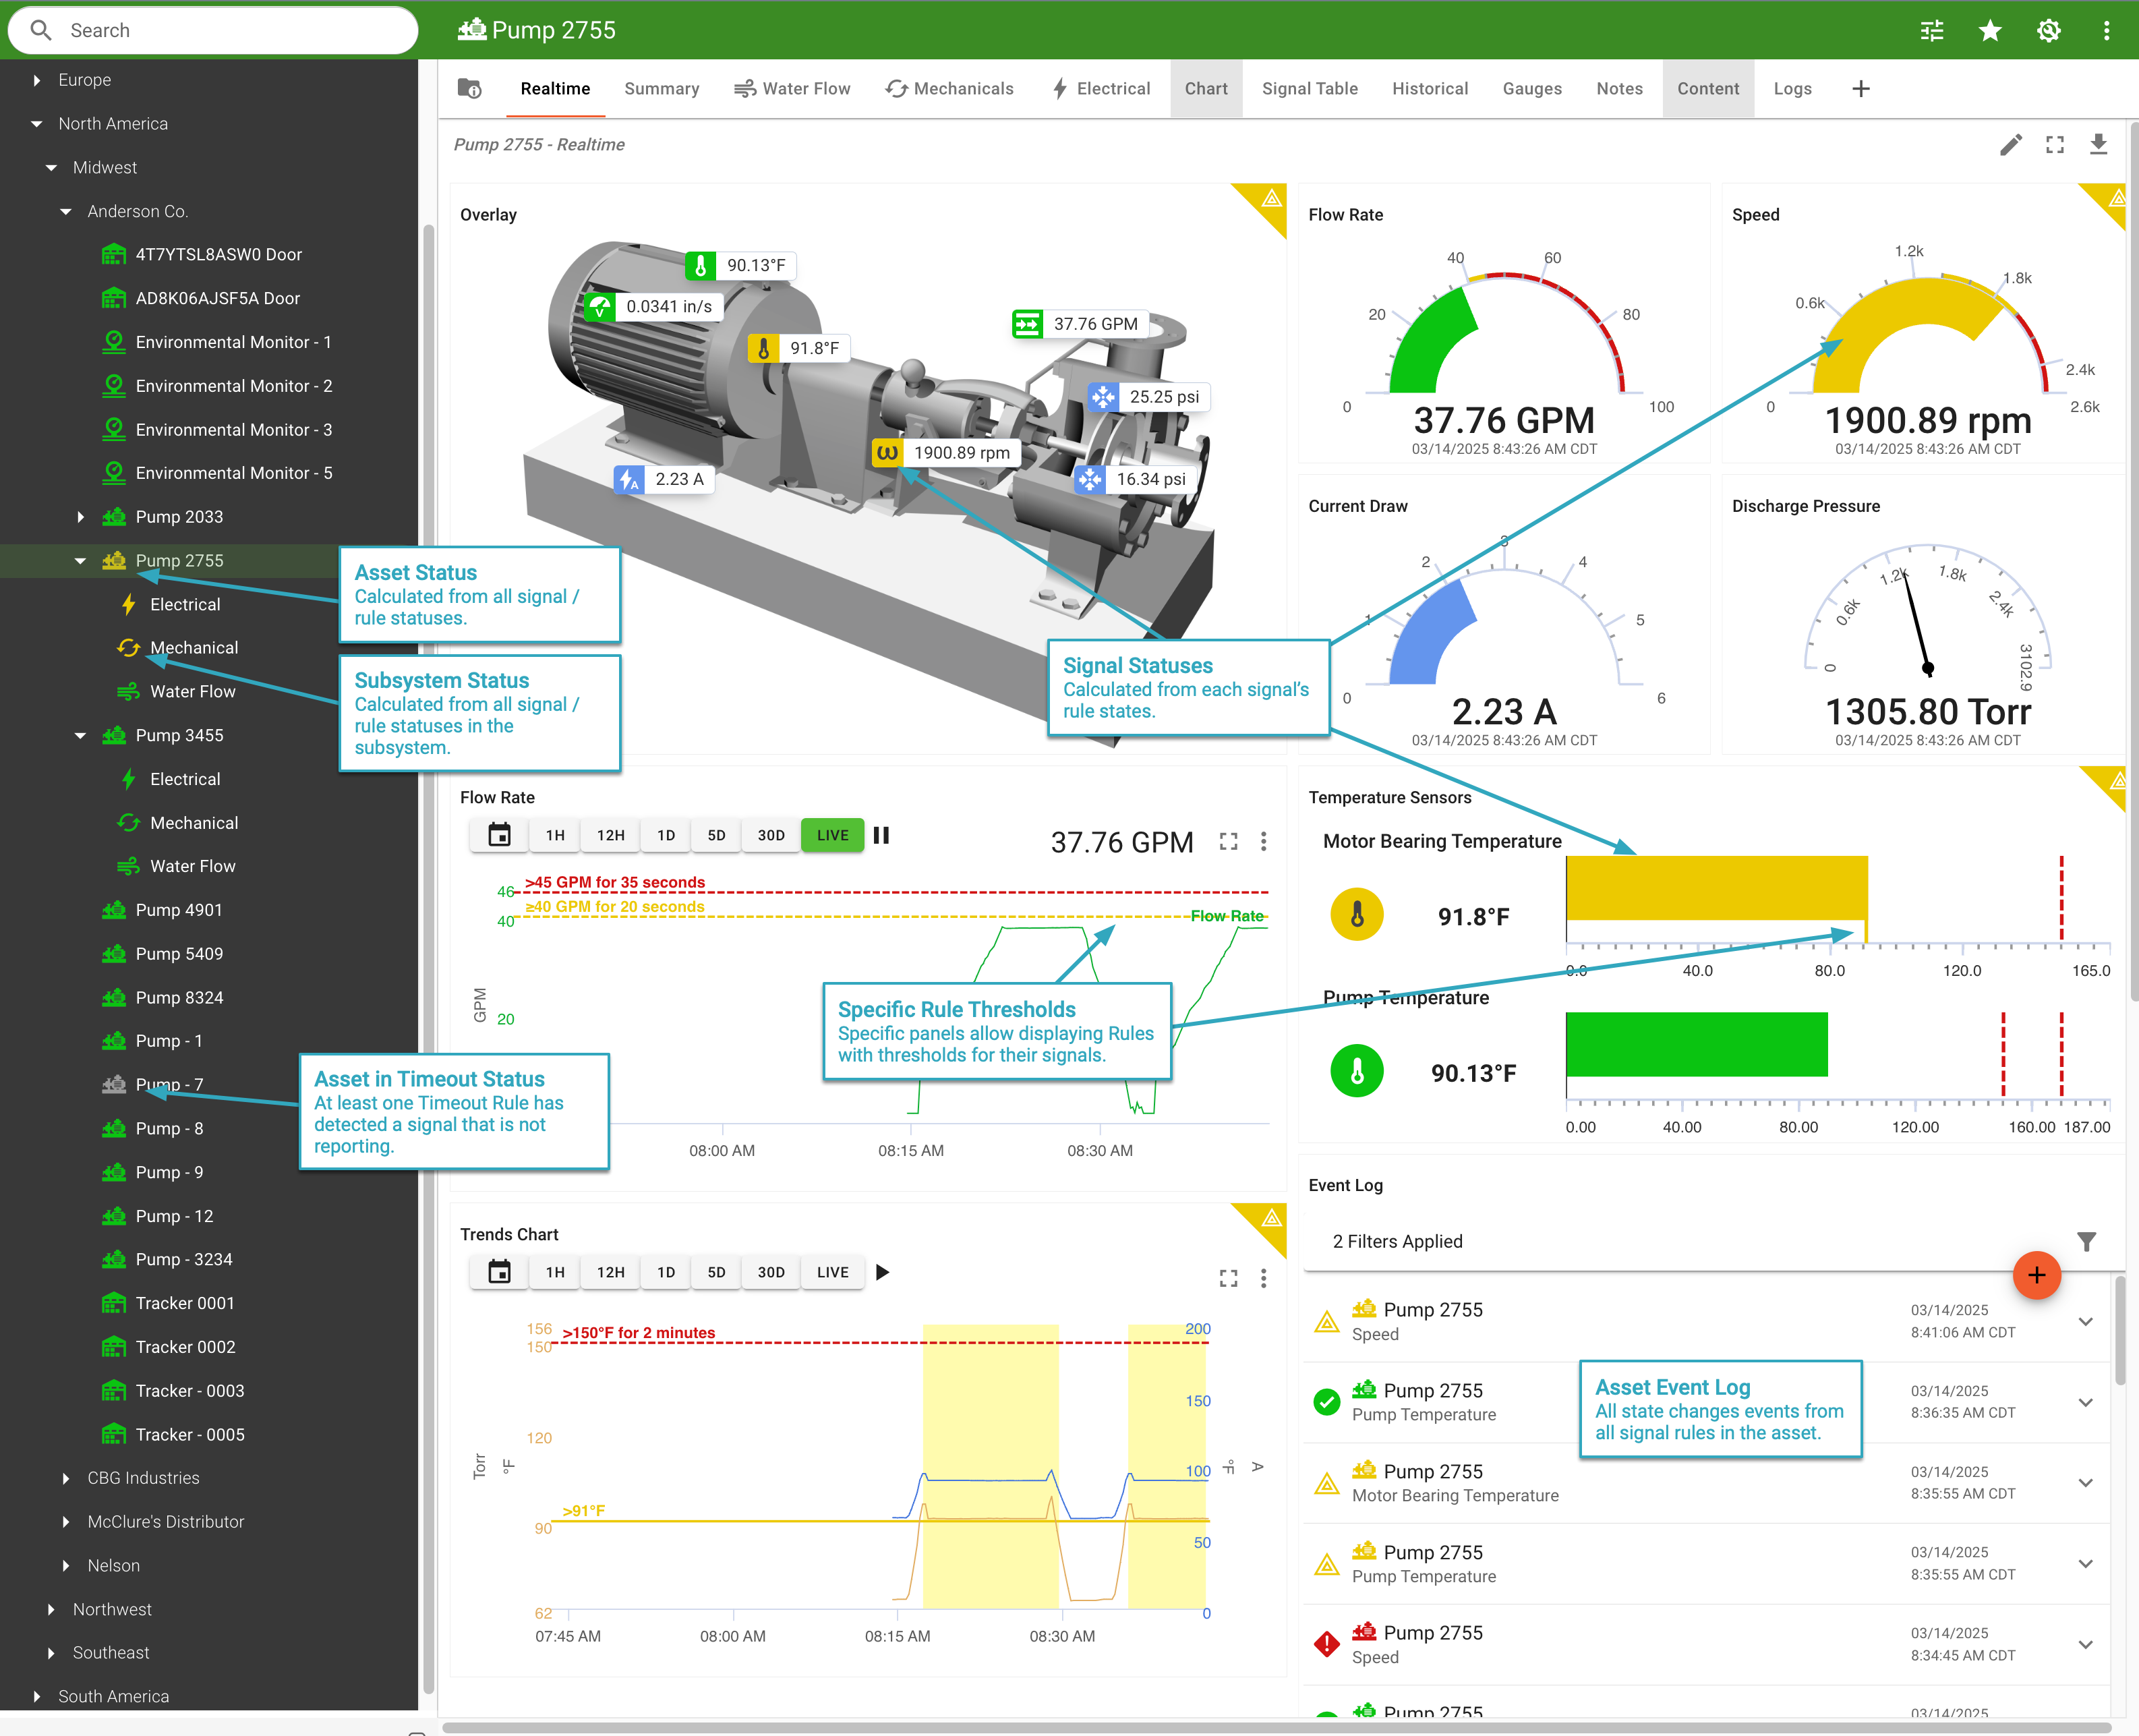
Asset Status are helpful andon-style indicators of an asset's health. They can be used to quickly allow a user to determine the health of assets across large fleets. Status changes are based on rules associated to signals in the asset's data pipeline. These signal statuses roll-up to the Asset (see below for more details). Asset statuses are calculated real-time (in the moment). Although there is no specify asset status history itself, all signal rule state changes are recorded to the asset's Event Log to understand what has been ongoing.
Calcuating Status
To calculate the overall asset status, all signals with rules are considered. The order of severity for states is the following:
---
config:
  theme: neutral
---
graph
  Asset@{ shape: rect, label: "Asset Status:<br>Warning" }
  style Asset fill:#fdd835,stroke:#fdd835,fill-opacity:0.2

  Signal@{ shape: das, label: "Signal 1" }
  Signal2@{ shape: das, label: "Signal 2" }
  Signal3@{ shape: das, label: "Signal 3" }

  Rule{Rule};
  style Rule stroke-width:3px,stroke:#fdd835

  Rule{Rule<br>Threshold} -.-  Signal
  RuleT{Rule<br>Timeout} -.- Signal
  Rule2{Rule<br>Threshold} -.- Signal2
  Rule3{Rule<br>Matching} -.- Signal3

  Asset -.- Signal1_Status[Signal Status:<br>Warning] -.- Rule
  Signal1_Status -.- RuleT
  Asset -.- Signal2_Status[Signal 2 Status:<br>OK] -.- Rule2
  Asset -.- Signal3_Status[Signal 3 Status:<br>OK] -.- Rule3

  style RuleT stroke-width:3px,stroke:#0ac410
  style Rule2 stroke-width:3px,stroke:#0ac410
  style Rule3 stroke-width:3px,stroke:#0ac410

  style Signal1_Status fill:#fdd835,stroke:#fdd835,fill-opacity:0.2
  style Signal2_Status fill:#0ac410,stroke:#0ac410,fill-opacity:0.2
  style Signal3_Status fill:#0ac410,stroke:#0ac410,fill-opacity:0.2

  %%Actions ~~~ AC@{ shape: brace-l, label: "Triggers any Action functions attached to Rule" }
Severity Precedence
The status calculation severity level order of operations is as follows
ErrorCriticalWarningNormal- The most severe level is used as the overall asset status.
- If there are no severity levels above Normal, then the default status for an asset is Normal or Ok .
- In cases where signals do not have a rule configured that determines signal status, dashboard panels use a default blue color instead of showing status.
Timeouts
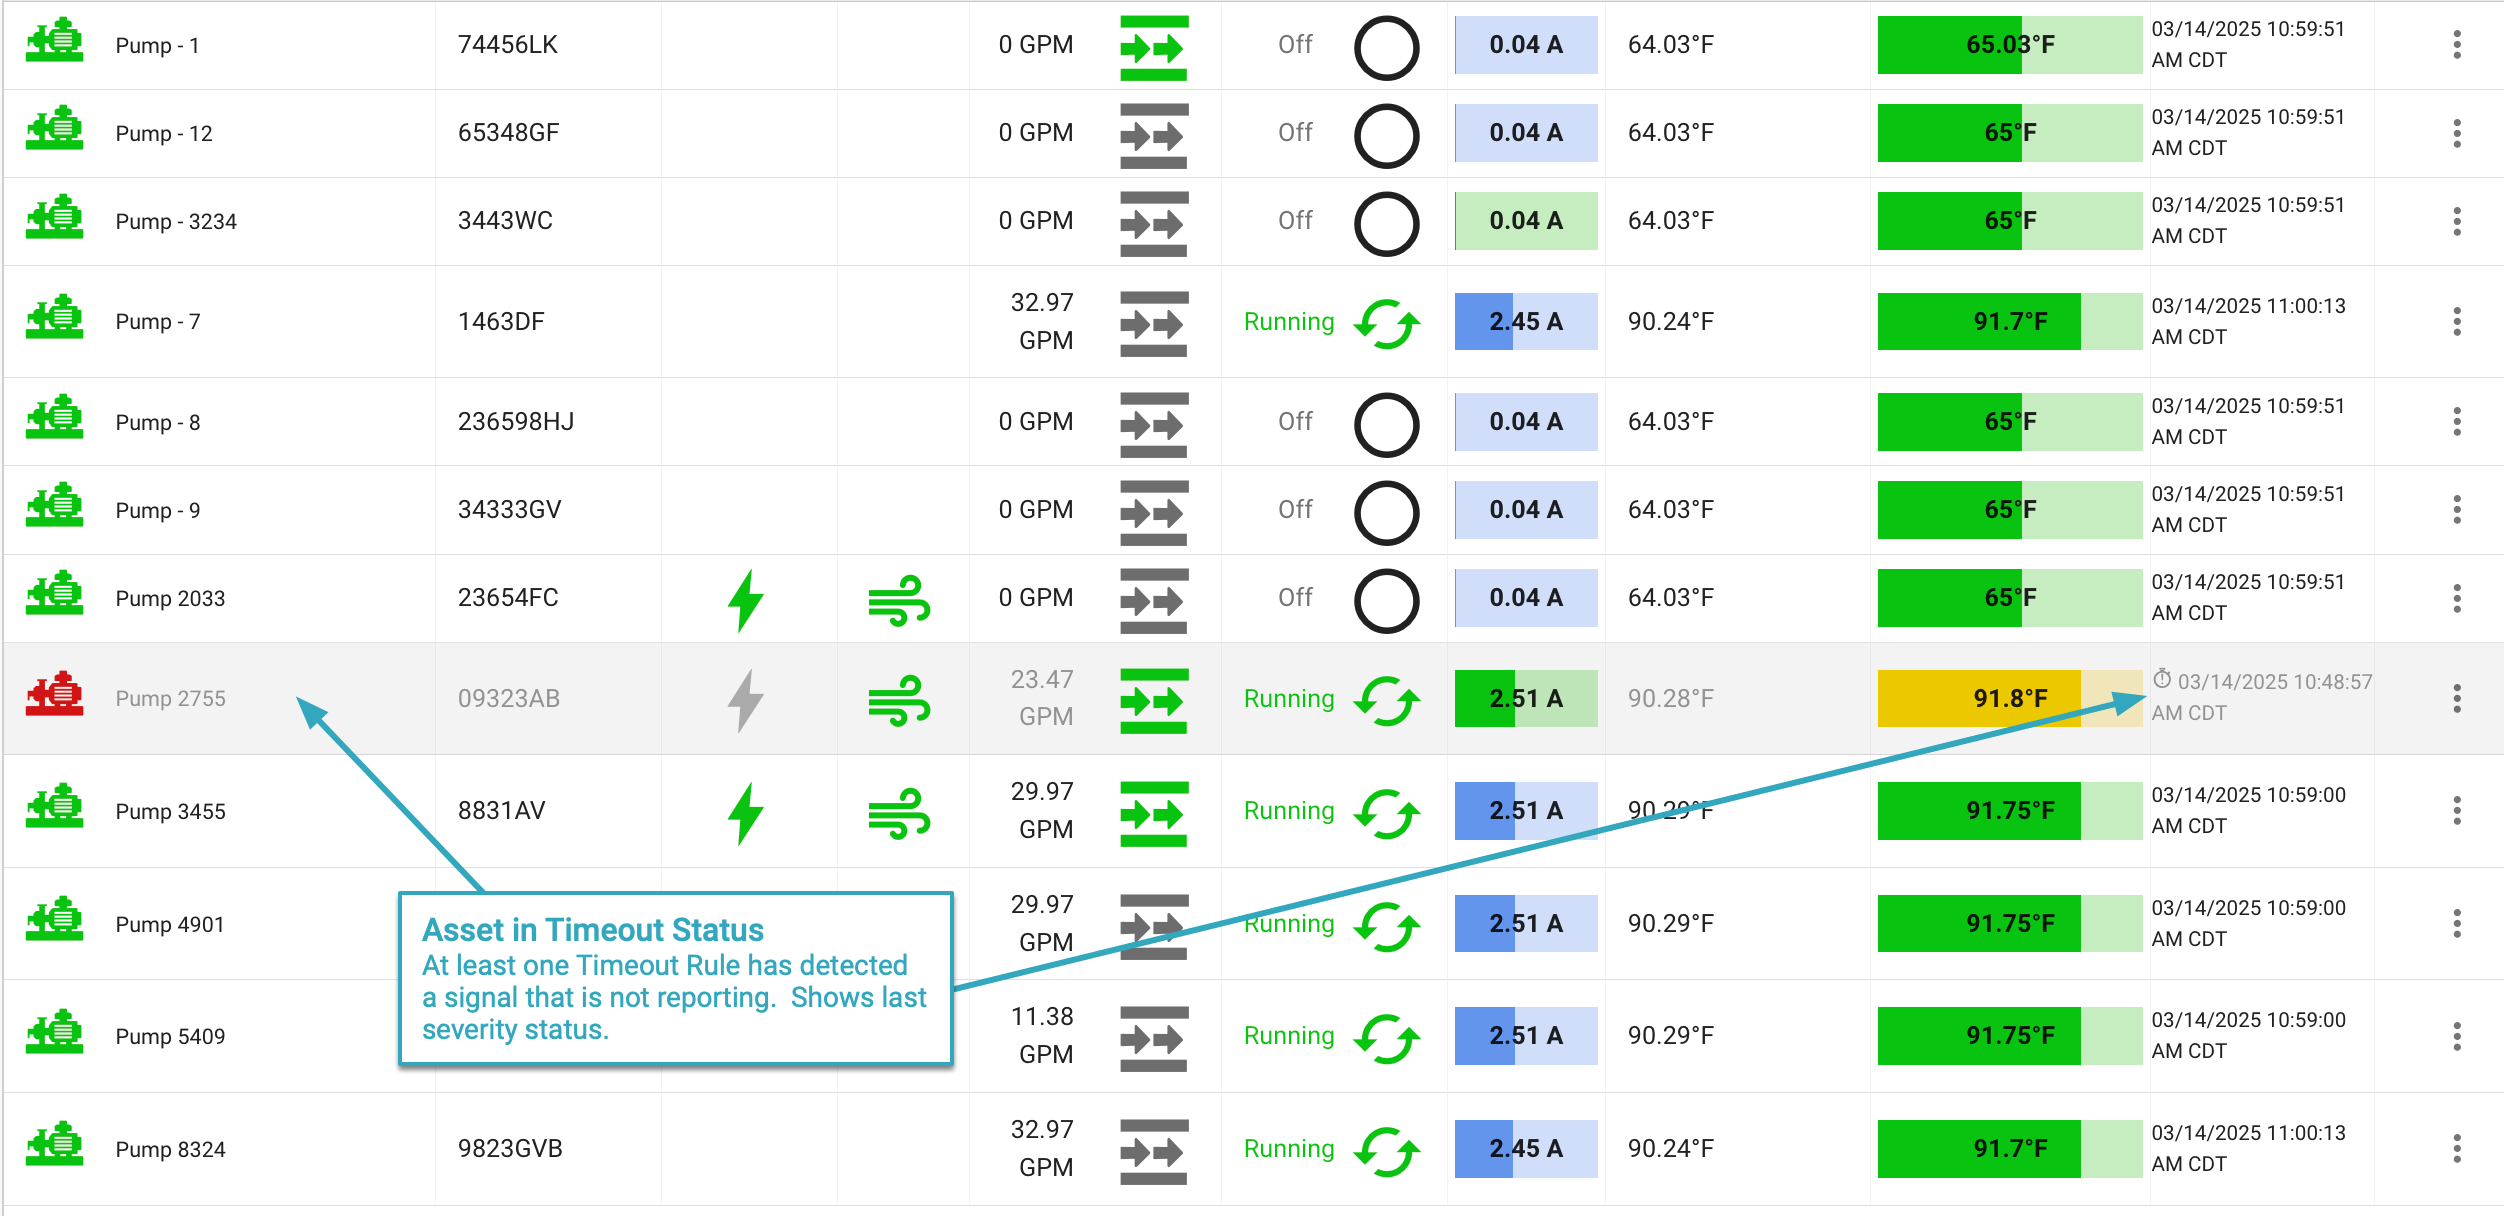
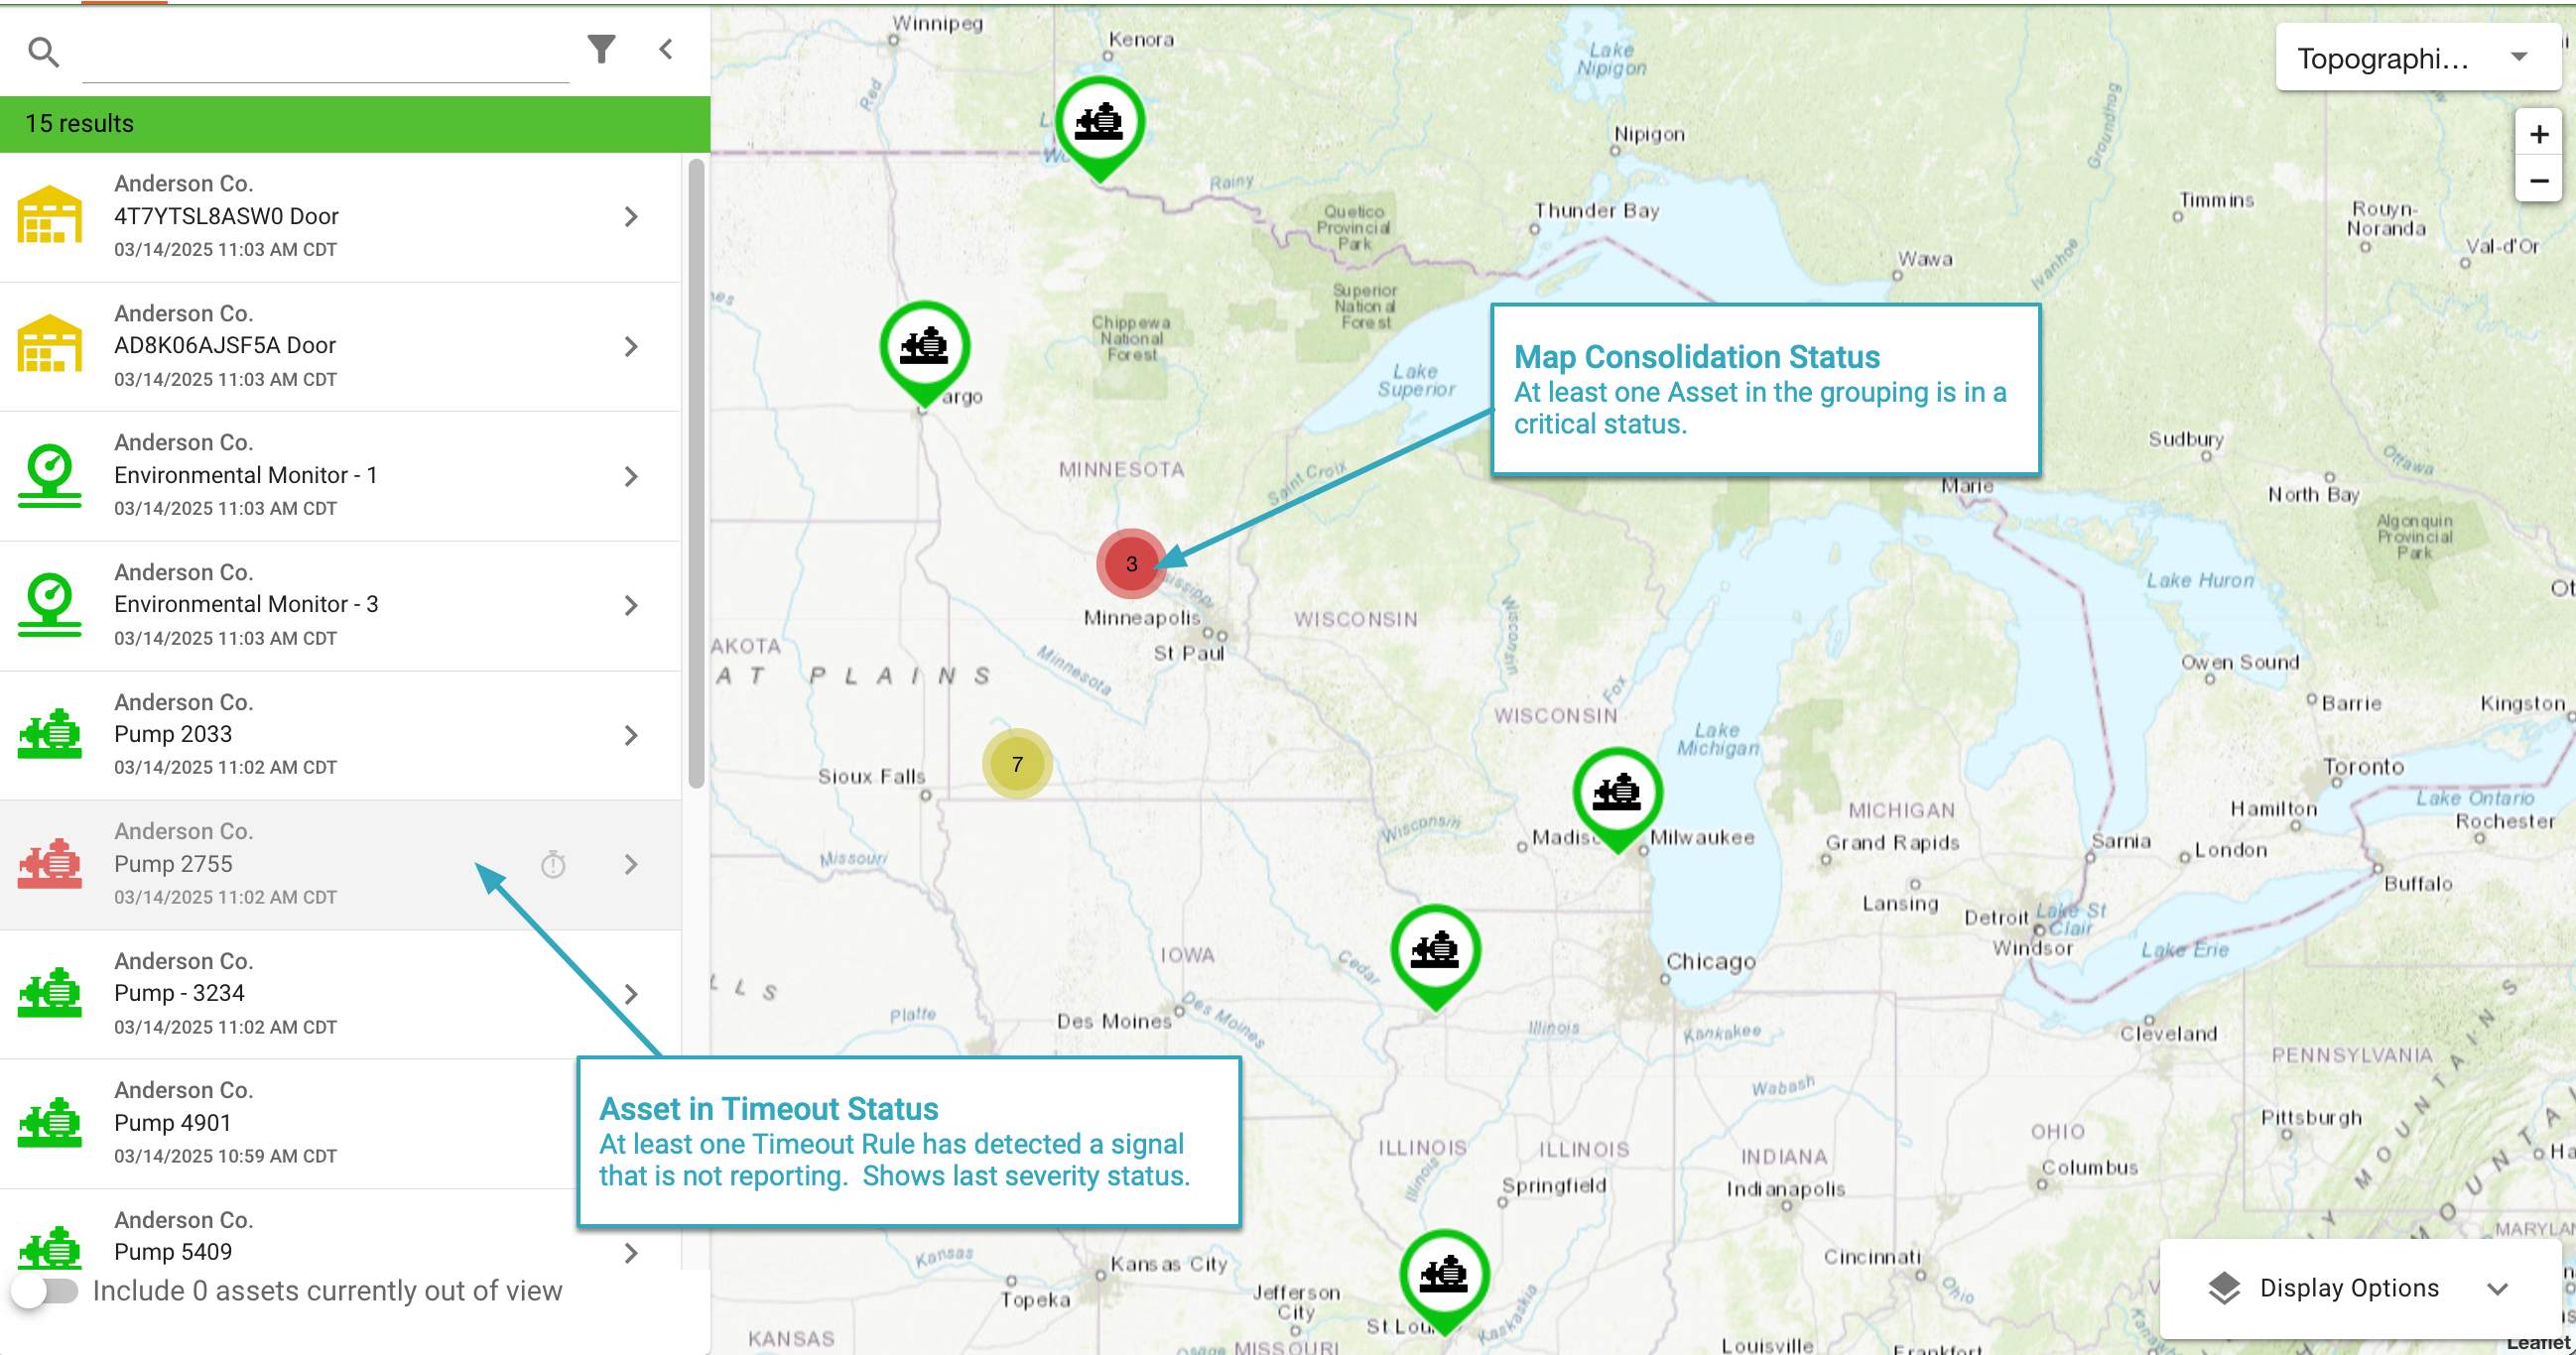
If any timeout rule on a signal has detected the signal to be timed out, the signal and therefore the overall Asset status is in Timeout . The timeout state may be shown as any of the following.
- All grey icon
- Greyed out list item background
- Timer Icon
- Slightly transparent icon showing last known severity state
It's important to assume that since a signal is timed out, the last detected state is only based on the last data that was sent and the actual current condition of the machine should be assumed to be unknown. Showing last state is only to help provide context until the signal is sending again.
Timeouts
See Timeout Rules for more details about timeout rules and their impact on visualization and notifications.
---
config:
  theme: neutral
---
graph
  Asset@{ shape: rect, label: "Asset Status:<br>Timeout" }
  style Asset fill:#999,stroke:#fdd835,fill-opacity:0.2

  Signal@{ shape: das, label: "Signal 1" }
  Signal2@{ shape: das, label: "Signal 2" }
  Signal3@{ shape: das, label: "Signal 3" }

  Rule{Rule};
  style Rule stroke-width:3px,stroke:#fdd835

  Rule{Rule<br>Threshold} -.-  Signal
  RuleT{Rule<br>Timeout} -.- Signal
  Rule2{Rule<br>Threshold} -.- Signal2
  Rule3{Rule<br>Matching} -.- Signal3

  Asset -.- Signal1_Status[Signal Status:<br>Timeout] -.- Rule
  Signal1_Status -.- RuleT
  Asset -.- Signal2_Status[Signal 2 Status:<br>OK] -.- Rule2
  Asset -.- Signal3_Status[Signal 3 Status:<br>OK] -.- Rule3

  style RuleT stroke-width:3px,stroke:#999
  style Rule2 stroke-width:3px,stroke:#0ac410
  style Rule3 stroke-width:3px,stroke:#0ac410

  style Signal1_Status fill:#999,stroke:#fdd835,fill-opacity:0.2
  style Signal2_Status fill:#0ac410,stroke:#0ac410,fill-opacity:0.2
  style Signal3_Status fill:#0ac410,stroke:#0ac410,fill-opacity:0.2

  %%Actions ~~~ AC@{ shape: brace-l, label: "Triggers any Action functions attached to Rule" }
Assets with No Reported Data
Assets whose signals have never reported any data are displayed in the grid view and side navigation in the same grey style as an asset in timeout. This is a visual cue that no data has been received yet — the asset is not in a timeout state. Timeout applies only when a signal has previously reported data and then stopped arriving. Once the signal begins reporting, the asset will display its normal status.
Where Status is Available
Asset and Signal statuses are visible in:
- Asset Fleet Grid / Group / List views
- Some Dashboard Panels that display assets
- Dashboard Panels that show Signals (typically configurable)
- Map views of assets
- Event logs
- Conditions
- Email and SMS notifications
- Action functions are triggered by rule state change events, with the signal status level a part of the payload.
Displaying of statuses is optional on many dashboard panels.
Status Visualization
| Status | Icon | Description | Visualization |
|---|---|---|---|
| Normal / Ok | The Normal status clears other status indicators, denoting that an asset is operating normally. Triggers: Rule, Manual Log, or lack of other status being output Overrides: None | #0ac410 Dashboard Panels Depends on panel settings. Asset Lists | |
| Warning | The Warning status is typically used to denote an asset is operating in a state that is a concern, but not yet critical. Triggers: Rule or Manual Log Overrides: | #ecc800 Dashboard Panels Asset Lists | |
| Critical | The Critical status is typically used to denote an asset is operating in a state that is critical to address. Triggers: Rule or Manual Log Overrides: | #d11515 Dashboard Panels Asset Lists | |
| Error | The Error status is typically used to denote that there is an error with the equipment and/or monitoring of the equipment. Triggers: Rule or Manual Log Overrides: | #510633 Dashboard Panels **Asset Lists* | |
| Informational | The Informational status is used to denote less about a level and more about a piece of information about the equipment at that time. It does not change the overall asset status. Triggers: Rule or Manual Log Overrides: Does not affect an asset's status. | #6495ed Dashboard Panels Depends on panel / settings. Asset Lists No | |
| Asset Timeout | | The timeout status is used to indicate that at least one signal in the asset is in a timeout state. Triggers: Any signal in timeout state Overrides: Used in conjunction with | #999 Dashboard Panels Depends on panel / settings. Asset Lists Asset icons may show as the timeout color or as their last known status on a timeout background for the list row. Timestamps typically indicate a timeout with the timeout icon. |
| Signal Timeout | | Indicates the specific signal is timed out. Triggers: A Timeout Rule on a signal Overrides: Used in conjunction with | #999 Dashboard Panels Yes. Panels can use both the Signal's Timeout property and a Timeout Rule's status for showing timeout. Optionally you can choose to hide the signal's data and status if the signal has timed out. In some cases, the user can choose to display most recent data point while in the timeout state. In those instances, the data is shown along with a timeout icon, faded, and colored to reflect status (red/yellow/burgundy/green) Asset Lists No |