Signals
Signals are unique pieces of data that are associated to a source such as a temperature sensor, a modbus register, or even the result of another processed signal (see transformations). Signals can store history, are available for dashboards and reports, and can have rules applied for determining condition states.
Signals are created and modified under the Asset Configuration or at the time of the creation of the asset.

Signal Summary
| Functionality | Description |
|---|---|
| Current value | The current value shown is the last value and timestamp which is the last value based on recorded time-stamp. The UI will live-update as new values are received |
| History | A signal's history can be enabled (default) or disabled which means only the last value is available for real-time visualization and transformations. |
| Properties | Used throughout the application for visualization and other functionality. |
| Source on creation | When creating an asset, from a template or scratch, typically each signal is mapped to a source channel, but may be empty source meaning it essentially is not used. |
| Source Replacement | Signals with a device channel source may have the source replaced (see below). |
| Transforms / Rules | Signals may be used as the inputs to transform, analytic, and condition rule insight functions |
| Dashboards | Dashboard panels use signals to show information about an asset or multiple Assets |
| Status | A signal's status is tied to any rules on the signal's pipeline. Where the signal is used in dashboard panels, these rule statuses are showing |
| Timeout | A signal can use it's timeout property which dashboard panels will use to show timeout. For notifications, create a timeout rule. |
| Reports | Signal history can be exported in reports. |
| Hidden | Signals can be hidden from use in dashboards and reports by user roles without the asset management permission. |
| Archival | Signals can be archived, meaning they will no longer accept new data values but the historical values will remain until the historical retention remotes them. |
How many signals does an Asset support?
This question has more to do with usability and management. When assets are planned with over 100 signals we recommend talking with support about considerations for helping to manage larger assets including features like Subsystems, Asset Templates, Dashboards, and also reviewing the data architecture to help with usability, management, and optimizations.
Management of Signals
Two different views are provided to manage signals and the data pipeline of an asset. The tabular Configuration View provides the most functionality and information. Signals can be edited, new signals created, and transform and rule functions can be attached.


Sources
The following are the available source inputs for a signal.
- Connected IoT Connector Source Channels (Edge IoT devices, Federations, or Data Integrations)
- The output of a Transformation function.
Edge IoT Device to Asset Signal Relationship
An asset can have signals sourced from any connected device channels. The signals do not need to be connected to the same device. The asset object configuration does not need to mirror the arrangement of channels on the physical IoT devices.
An overview of the relationship between IoT edge devices and asset signals can be found here: Connecting a Device Guide
Changing Sources
A signal's source can be changed from one edge IoT device channel to another, either from the same device or another device. In the compact asset configuration view, the signal menu provides a 'Replace Signal Source' option which allows choosing the device and channel. Note that it will only allow choosing a channel that meets the same requirements of type and unit to ensure that the historical values are consistent rather then changing to a new unit or type. When making this change, the data storage is cohesive under that signal.


Values
A signal receives new values from a source, either a from a IoT source or as the output of a transform function. These values along with a timestamp are processed in the ExoSense signal data pipeline. The format of the value is dictated by the Signal Type.
Summary: Signal Value Formats
The formats supported are defined by the signal type.
- Numeric - Accepts number values that are stored and processed in IEEE Double format.
- Boolean - Accepts
true,"on",1,"yes",false,"off",0,"no" - String - Accepts a string less than 2 KB
- JSON - Accepts a value that is less than 2 KB
For further details please see the ExoSense Data Types Schema Document.
Incorrect signal value formats
Any value that is attempted to be written to a signal that is improper or not meeting the requirements for the type is not supported. The value may or may not be rejected and all related functionality may not operate as expected.
Value Timestamps
Each signal value is recorded with a timestamp, which is used throughout the system when showing last value, historical visualizations (e.g. line charts), status changes, and any exports of the data. The application will adjust the visualization based on the user's selected timezone and with comparisons to the browser's system clock. Signal values are stored with a UTC timestamp at millisecond resolution, based on either the source provided timestamp (if available) or the platform received timestamp.
Troubleshooting issues with values recorded in the future, 'ahead' of the platform
The application will visualize data based on the recorded timestamps and the browser's system clock. There are two situations that can cause problems with visualizations that rely on accurate time.
-
If your computer / browser system clock is incorrect, this will cause data to possibly look as if it is in the future or in the past. Any UI interface that relies on showing latest value may be inaccurate, realtime status updates can be incorrect, etc.
-
If the IoT edge device or source of channel data for signals is reporting in the future, this can also cause similar issues throughout the application.
ExoSense will provide an error indication in the Asset Configuration view for signals that have timestamps reported in the future based on the browser clock.

Properties
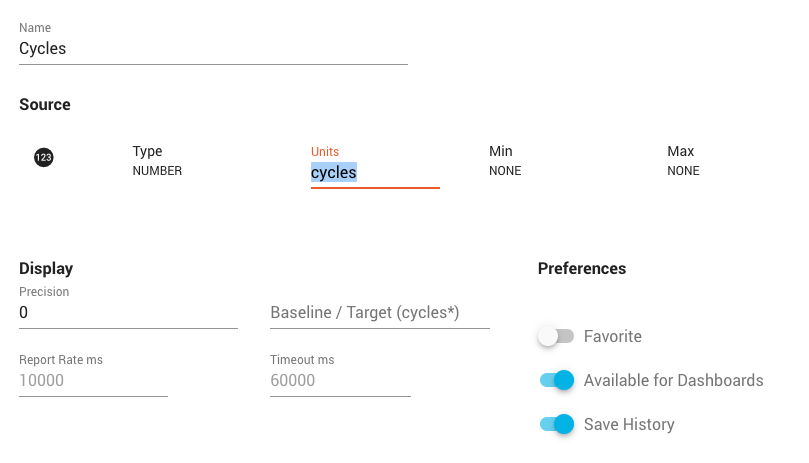
Signal properties are used for displaying information in the visualizations of the application and for controlling some functionality. Some of these properties are able to be inherited from the source channels, specified in the channel's config_io. In almost all cased, these properties may be overridden with a few exceptions. Signals that are the output of transforms are defined by the transform itself.

Source Types and Units
All signals have a source type and a unit, which are inherited from the signal's source (e.g. a connected device channel). These specify how the data is stored, allowing proper visualization options, and to be sure the source of truth can be trusted as data is exported. Most data types support multiple unit types, example the data type TEMPERATURE supports units of °C, °F, K, and °R. Some data types are unit-less (e.g. Number) that allow users to specify a custom unit.
The complete list of signal types and units can be found here:
ExoSense Data Types Schema Document
Signals sourced from an external channel can not change type or unit once they are created, as these are important for source of truth and all data is stored in these formats and therefore can not be changed once created. Signals that are created as the outlet of a transform have flexibility here.
Unit Conversion
Dashboard panels, unit visualization preferences, and the visualization unit properties (below) allow users to display signal values in different units. The source units simply maintain a source of truth of the values stored and a reference for unit conversions.
Custom Units

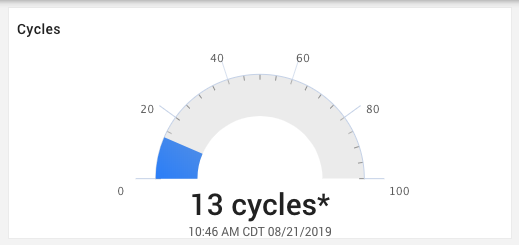
Signals of type NUMBER and STRING can use custom units. These can be inherited from the source device channel configuration or can be entered in the signal configuration window. Custom units do not allow for conversions and typically are shown with an asterisk * next to the unit.

Note: New data types and units can be requested through support requests.
Visualization Units
Signals may specify optional visualization units for the Metric and US unit systems. These may differ from the source unit, but must remain of the same type (e.g. Pressure or Flow Rate). Dashboard Panels can be configured to dynamically adjust to use these visualization units or the source units based on the user's current visualization settings.
Icons
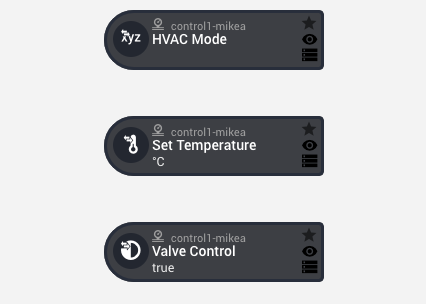
The icon associated to a signal is tied to the data type to provide a quick way to know what the the signal type is on dashboards. The icons show up in dashboard panels and throughout the application.
Precision
Specifies the number of decimal points the application will round up to for a numeric data type value when displayed in visualization dashboard panels.
Baseline
Specifies a constant value (Numeric data types only) that is considered the baseline.
Uses:
- Currently used by the line chart dashboard panels to show a baseline horizontal line, must be enabled in the dashboard panel.
Report Rate
The expected report rate of the values for that signal. It's important to remember that report rates can vary depending on network slowness, device issues, and other possible areas that may cause the source of data to be delayed.
Uses:
- Currently used by the line chart dashboard panels to show gaps.
- Panel: Line Chart
Timeout
The time period that would be considered a timeout for the source of the data. Often caused by network problems, device firmware issues, or device's powered off / loss of power.
Uses:
- Currently used by dashboard panels to show timeout indication for that signal including greying out of the panel, not showing a value (option), and showing a timeout indicator in the panel.
- Each panel will provide detail on how signal timeouts are handled.
The Signal timeout property does not affect the overall Asset timeout status. In order to show an Asset as timed out, use a Timeout Rule on your signal.
Min / Max
The min and max properties are used for dashboard panels that provide a range setting. Typically panels provide an option for 'automatic' range setting (which would use these properties) or to specify an exact range.
Available for Dashboards and Reports
By default is this enabled. If disabled, will not show the signal as available when setting up dashboard panels. Used to hide specific signals.
History
By default, historical storage is enabled. Signal values are stored with a UTC timestamp at millisecond resolution. If disabled, the system will not store any history for the specific signal, only the last value is available. Used to lower historical data storage usage.
Archived signals stop receiving new data points, but the signal remains for historical purposes (audits, reports, etc)
Retention
All signal data is stored using the overall retention setting for Dynamic Storage (Time Series) for the ExoSense instance. Once data is past the retention period, it will be deleted.
Favorites
Each asset supports selecting up to 4 signals as a favorite which are used in specific UI elements.
Current UI elements that use Asset Signals marked as Favorites:
Control Signals
Control signals are mapped to device control channels, which allow for sending requests to a device and receiving feedback that the device took action on the request.
Control signals show up in the Asset Configuration UI with icons showing bi-directional interface.

An overview of the Device Control between IoT edge devices and asset signals can be found here: Device Control Guide