Group Info Tab
Overview
The Group Info tab view provides a summary of the assets under a group (and subgroups). This includes metadata like the group's description, icon or image, the number of assets by type, a pie-chart summary of asset statuses, an event log, and condition information when enabled.
The Group Info View tab can be enabled by Administrators
Group Information
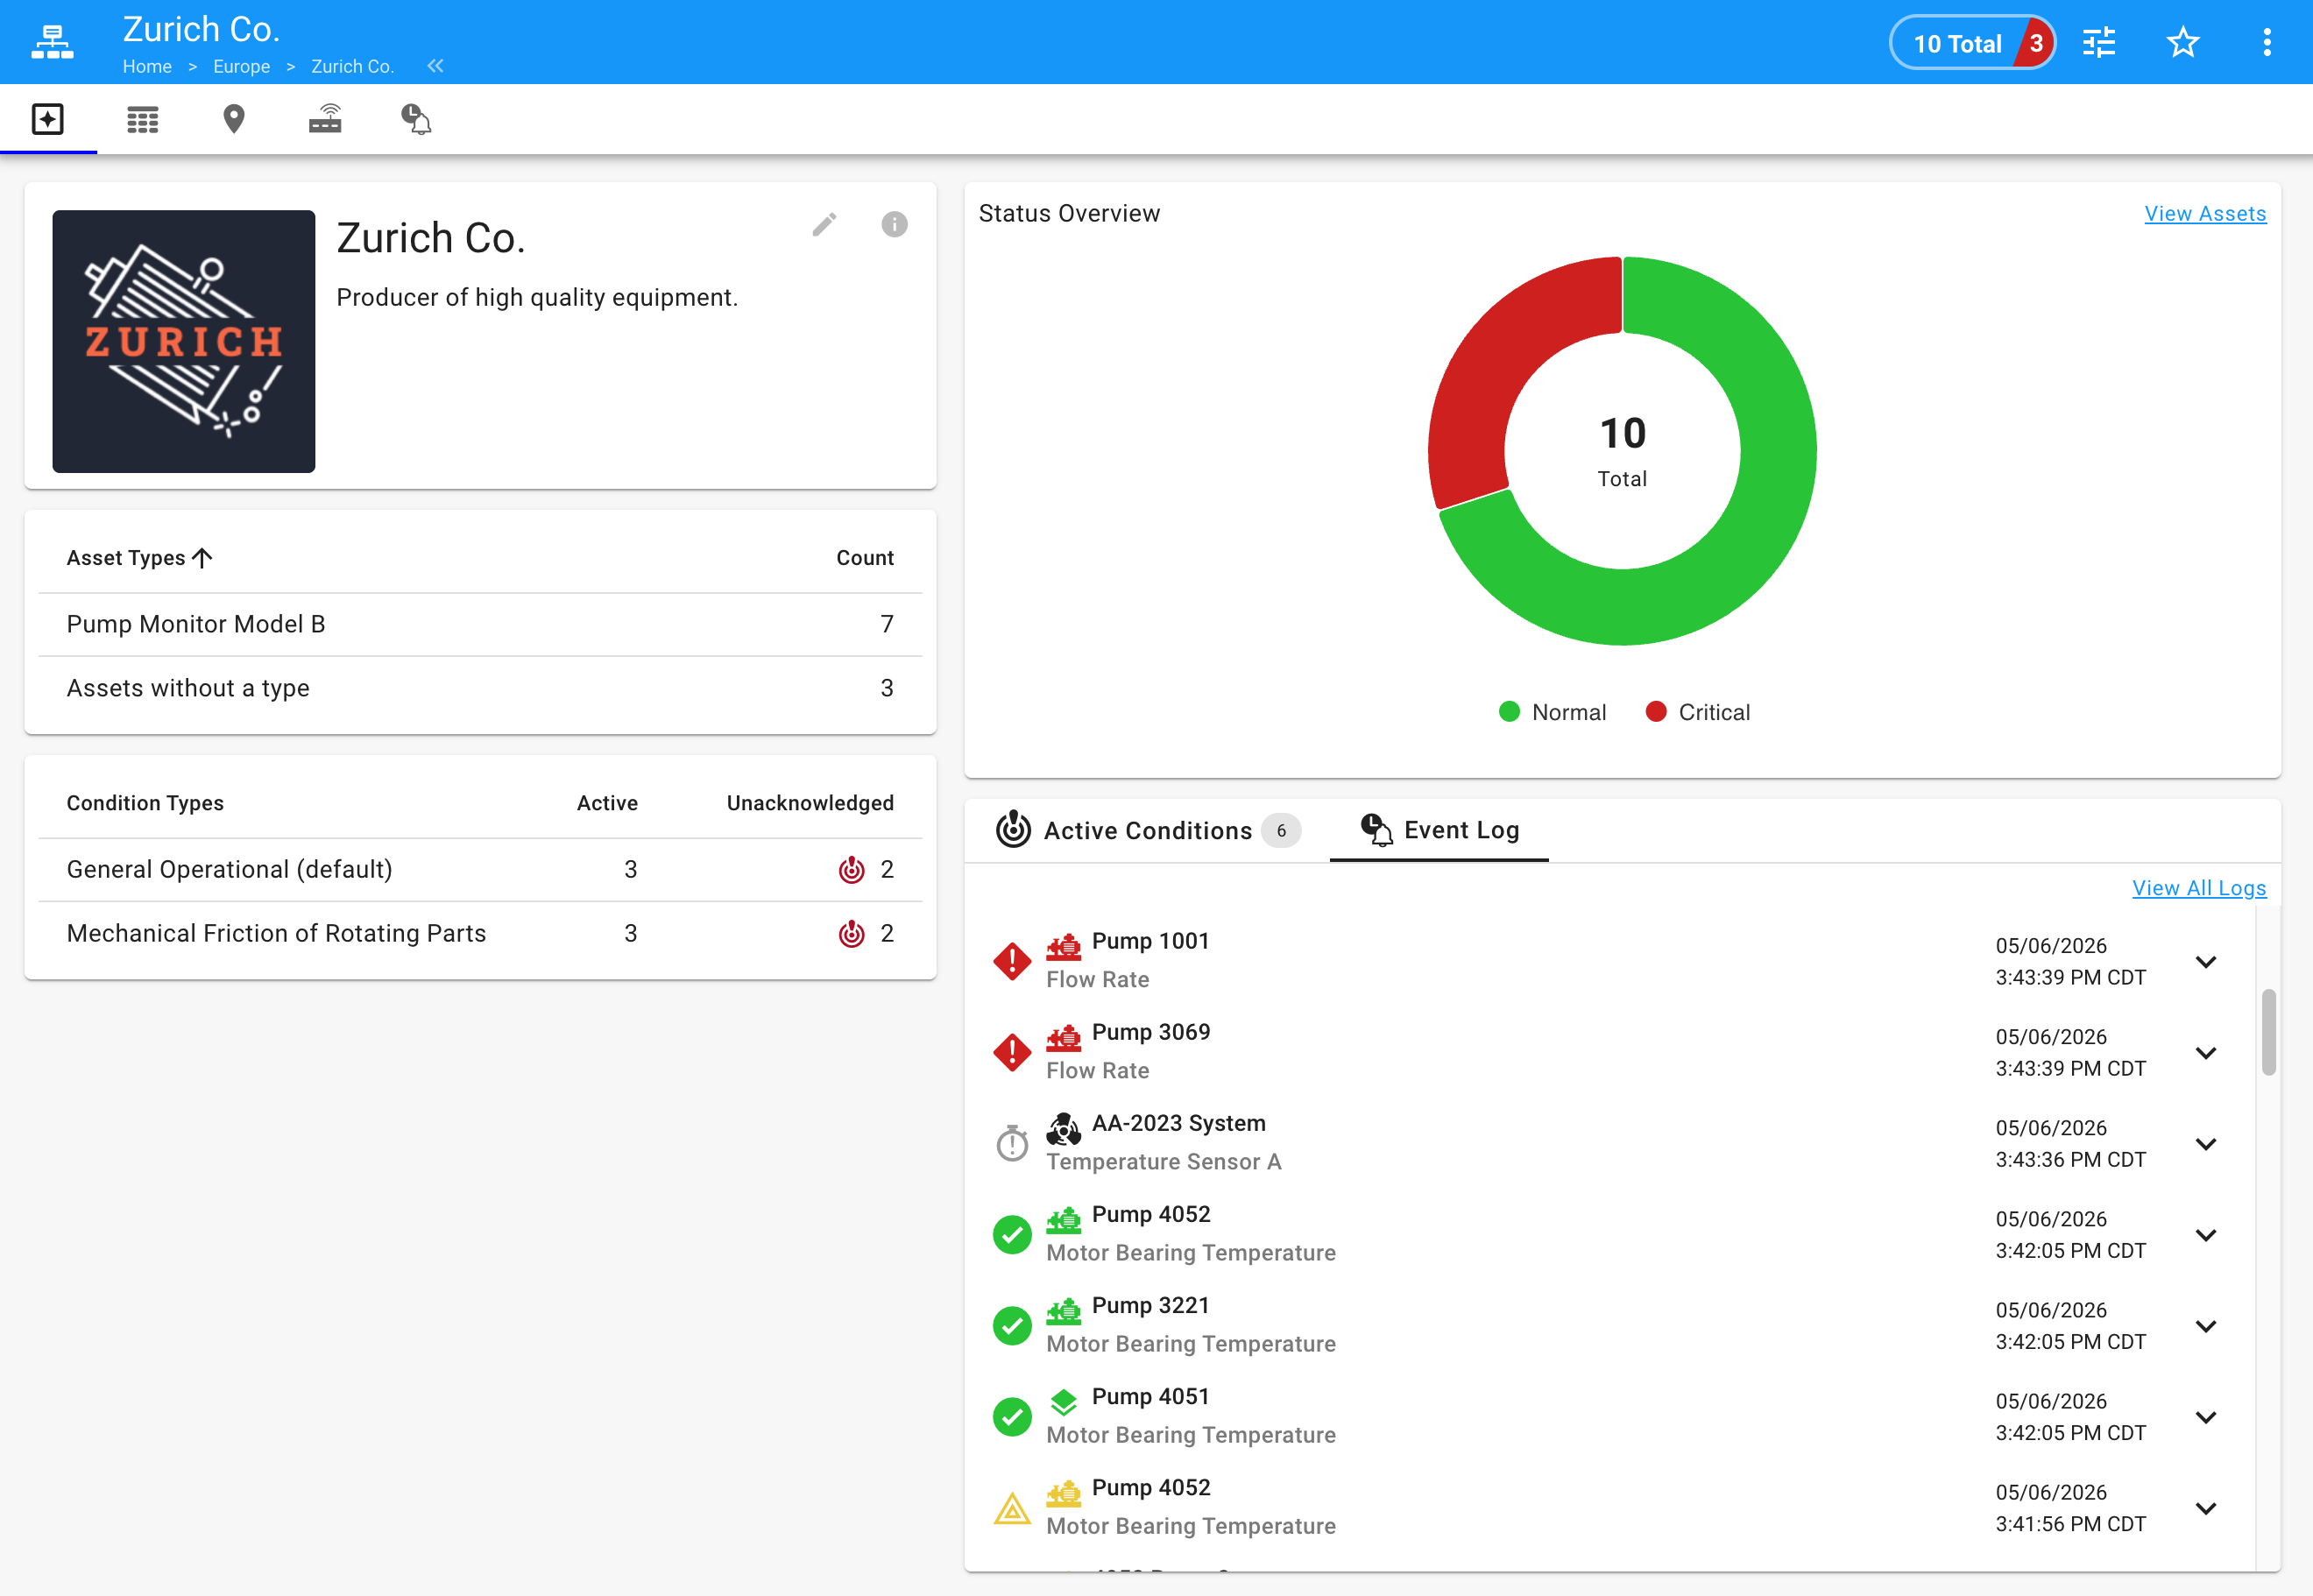
Asset Types Summary
This provides a total for each asset type found in the group. Clicking on an asset type row will bring you to the asset grid with that type filtered.
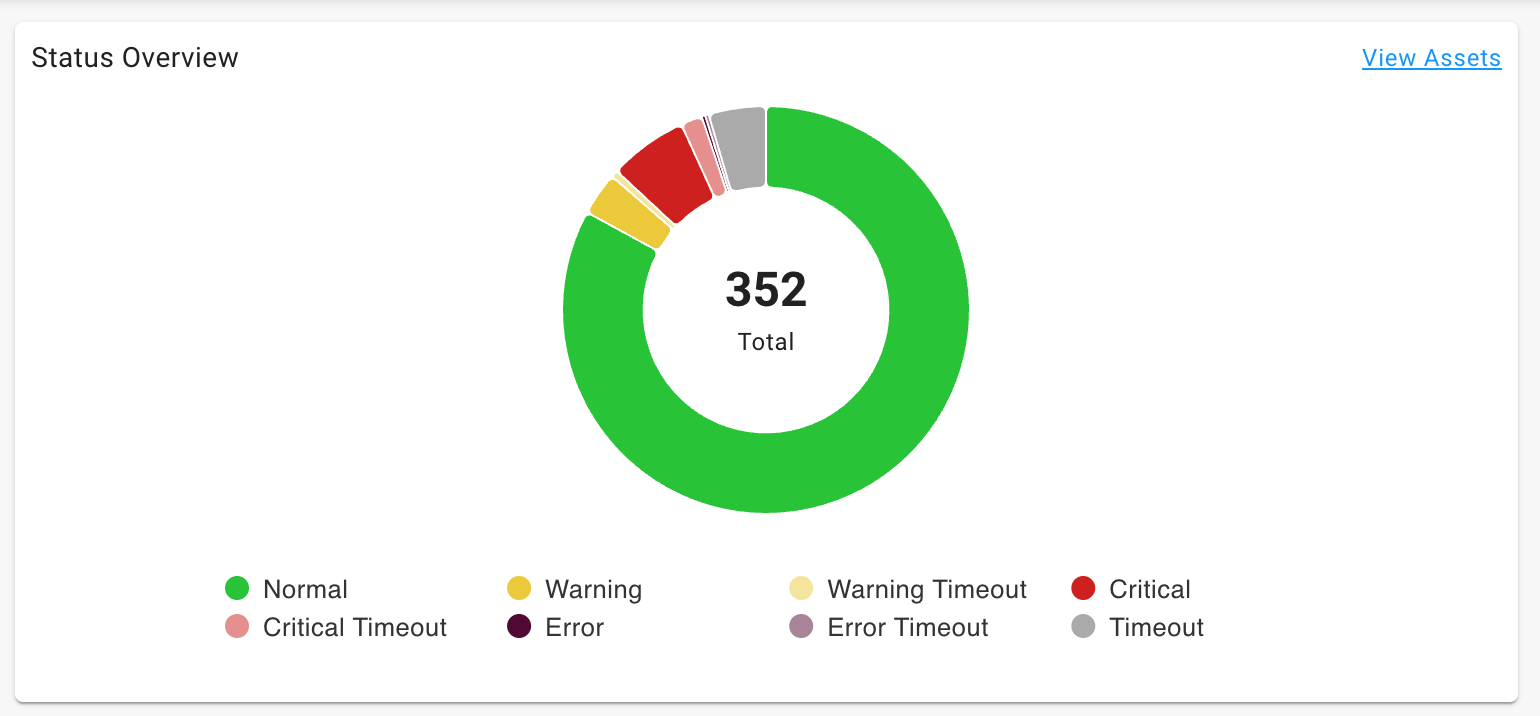
Status Overview
The status overview donut chart provides an overview of all assets in the group by status. Note that assets currently in timeout will be categorized by their last known status (Timeout, Warning Timeout, Critical Timeout, or Error Timeout). Clicking on any slice will bring you to the asset grid view with the status filtered.
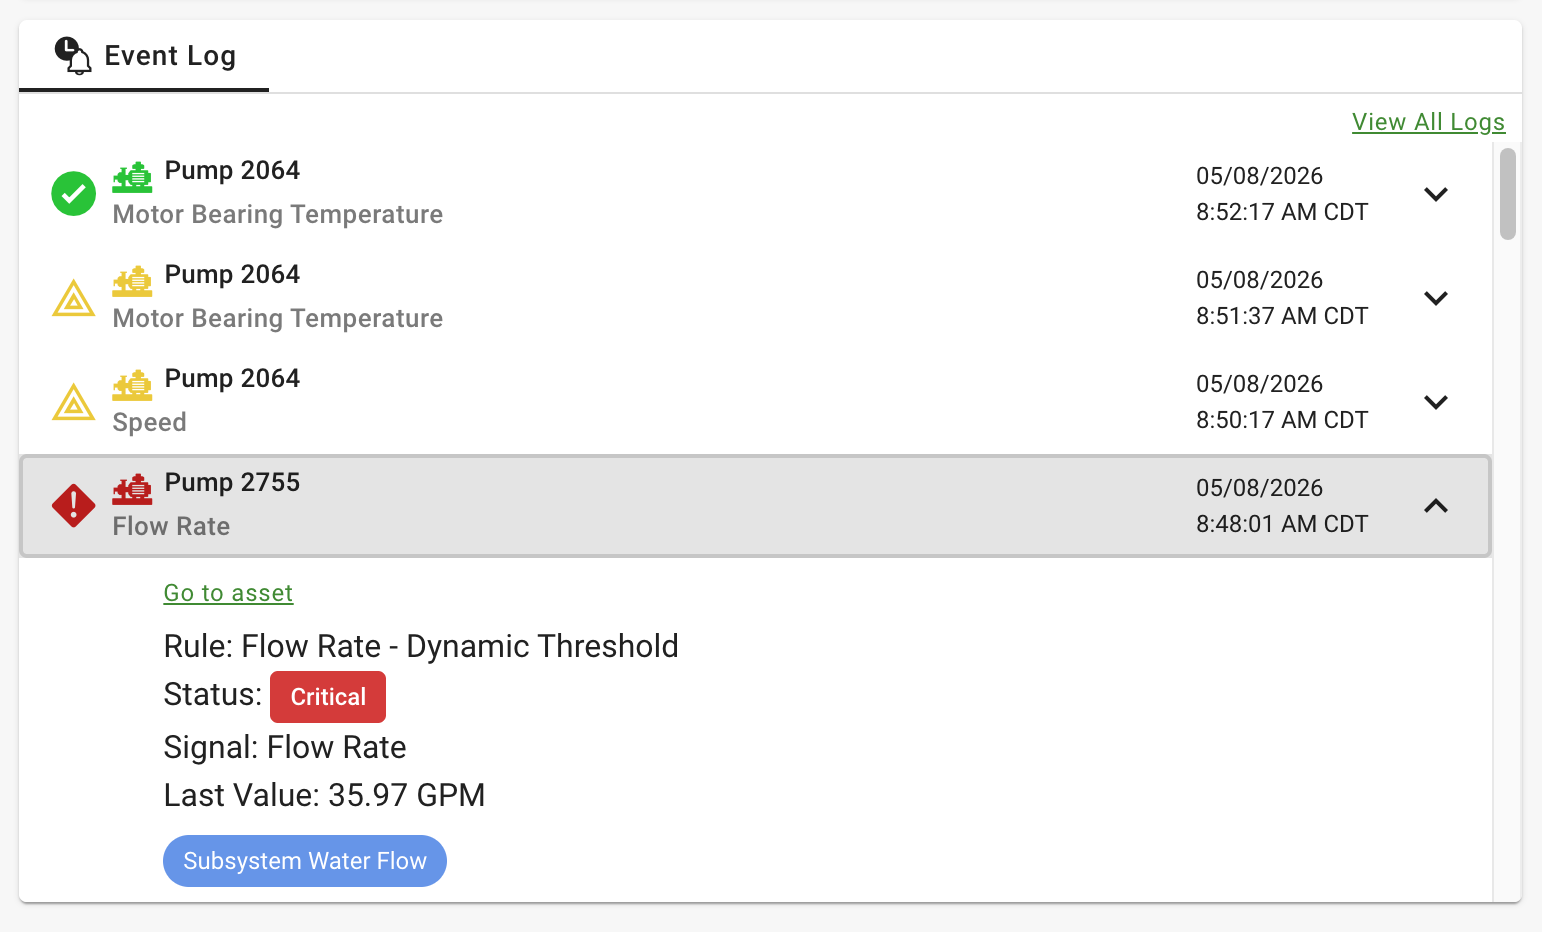
Event Log
This is a summary of the latest events for all assets in the group. Clicking on View All Logs link will bring you to the Event logs tab. From a specific event you can click on the asset to view its dashboards.
Conditions Information
The following tables and logs will be shown if the Conditions feature is enabled for a solution.
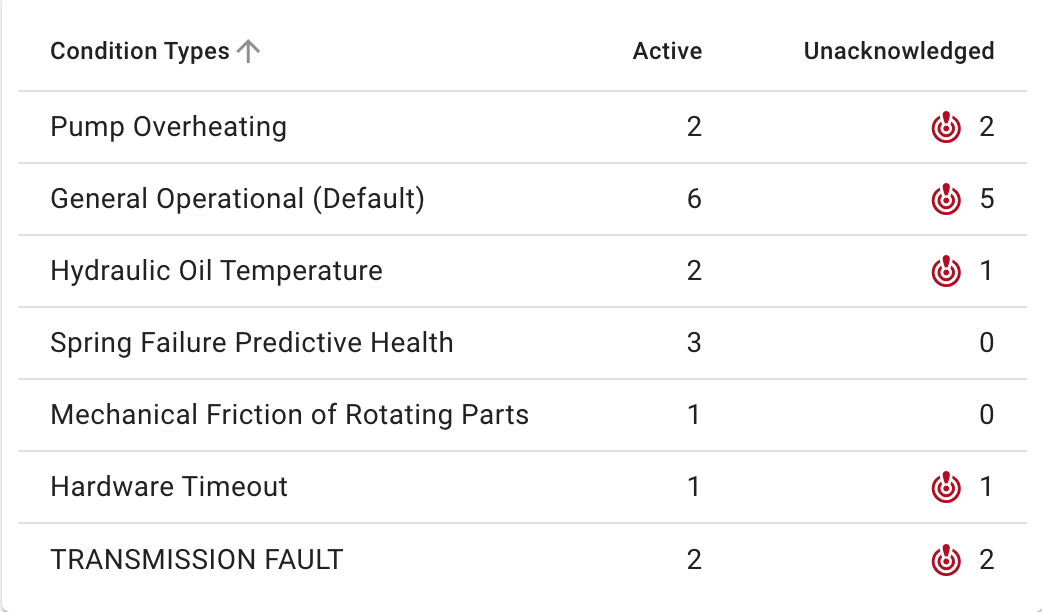
Condition Types Summary
This table provides a list of Condition Policies that are active in this group, with a summary of how many conditions are active. Clicking on a row will bring you to the Conditions page with a filter in place for the group and Active conditions.
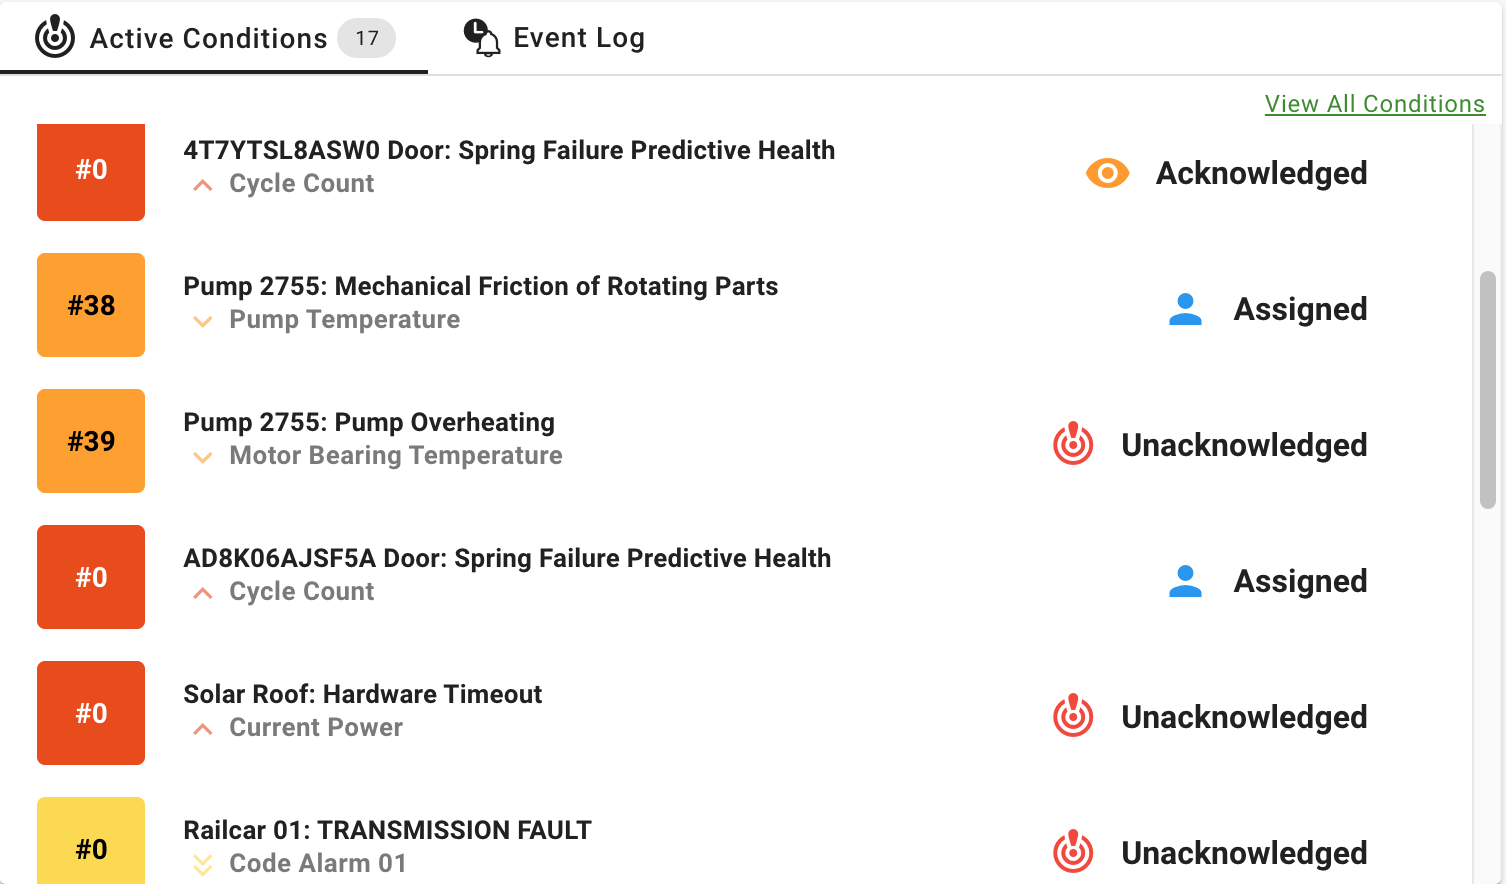
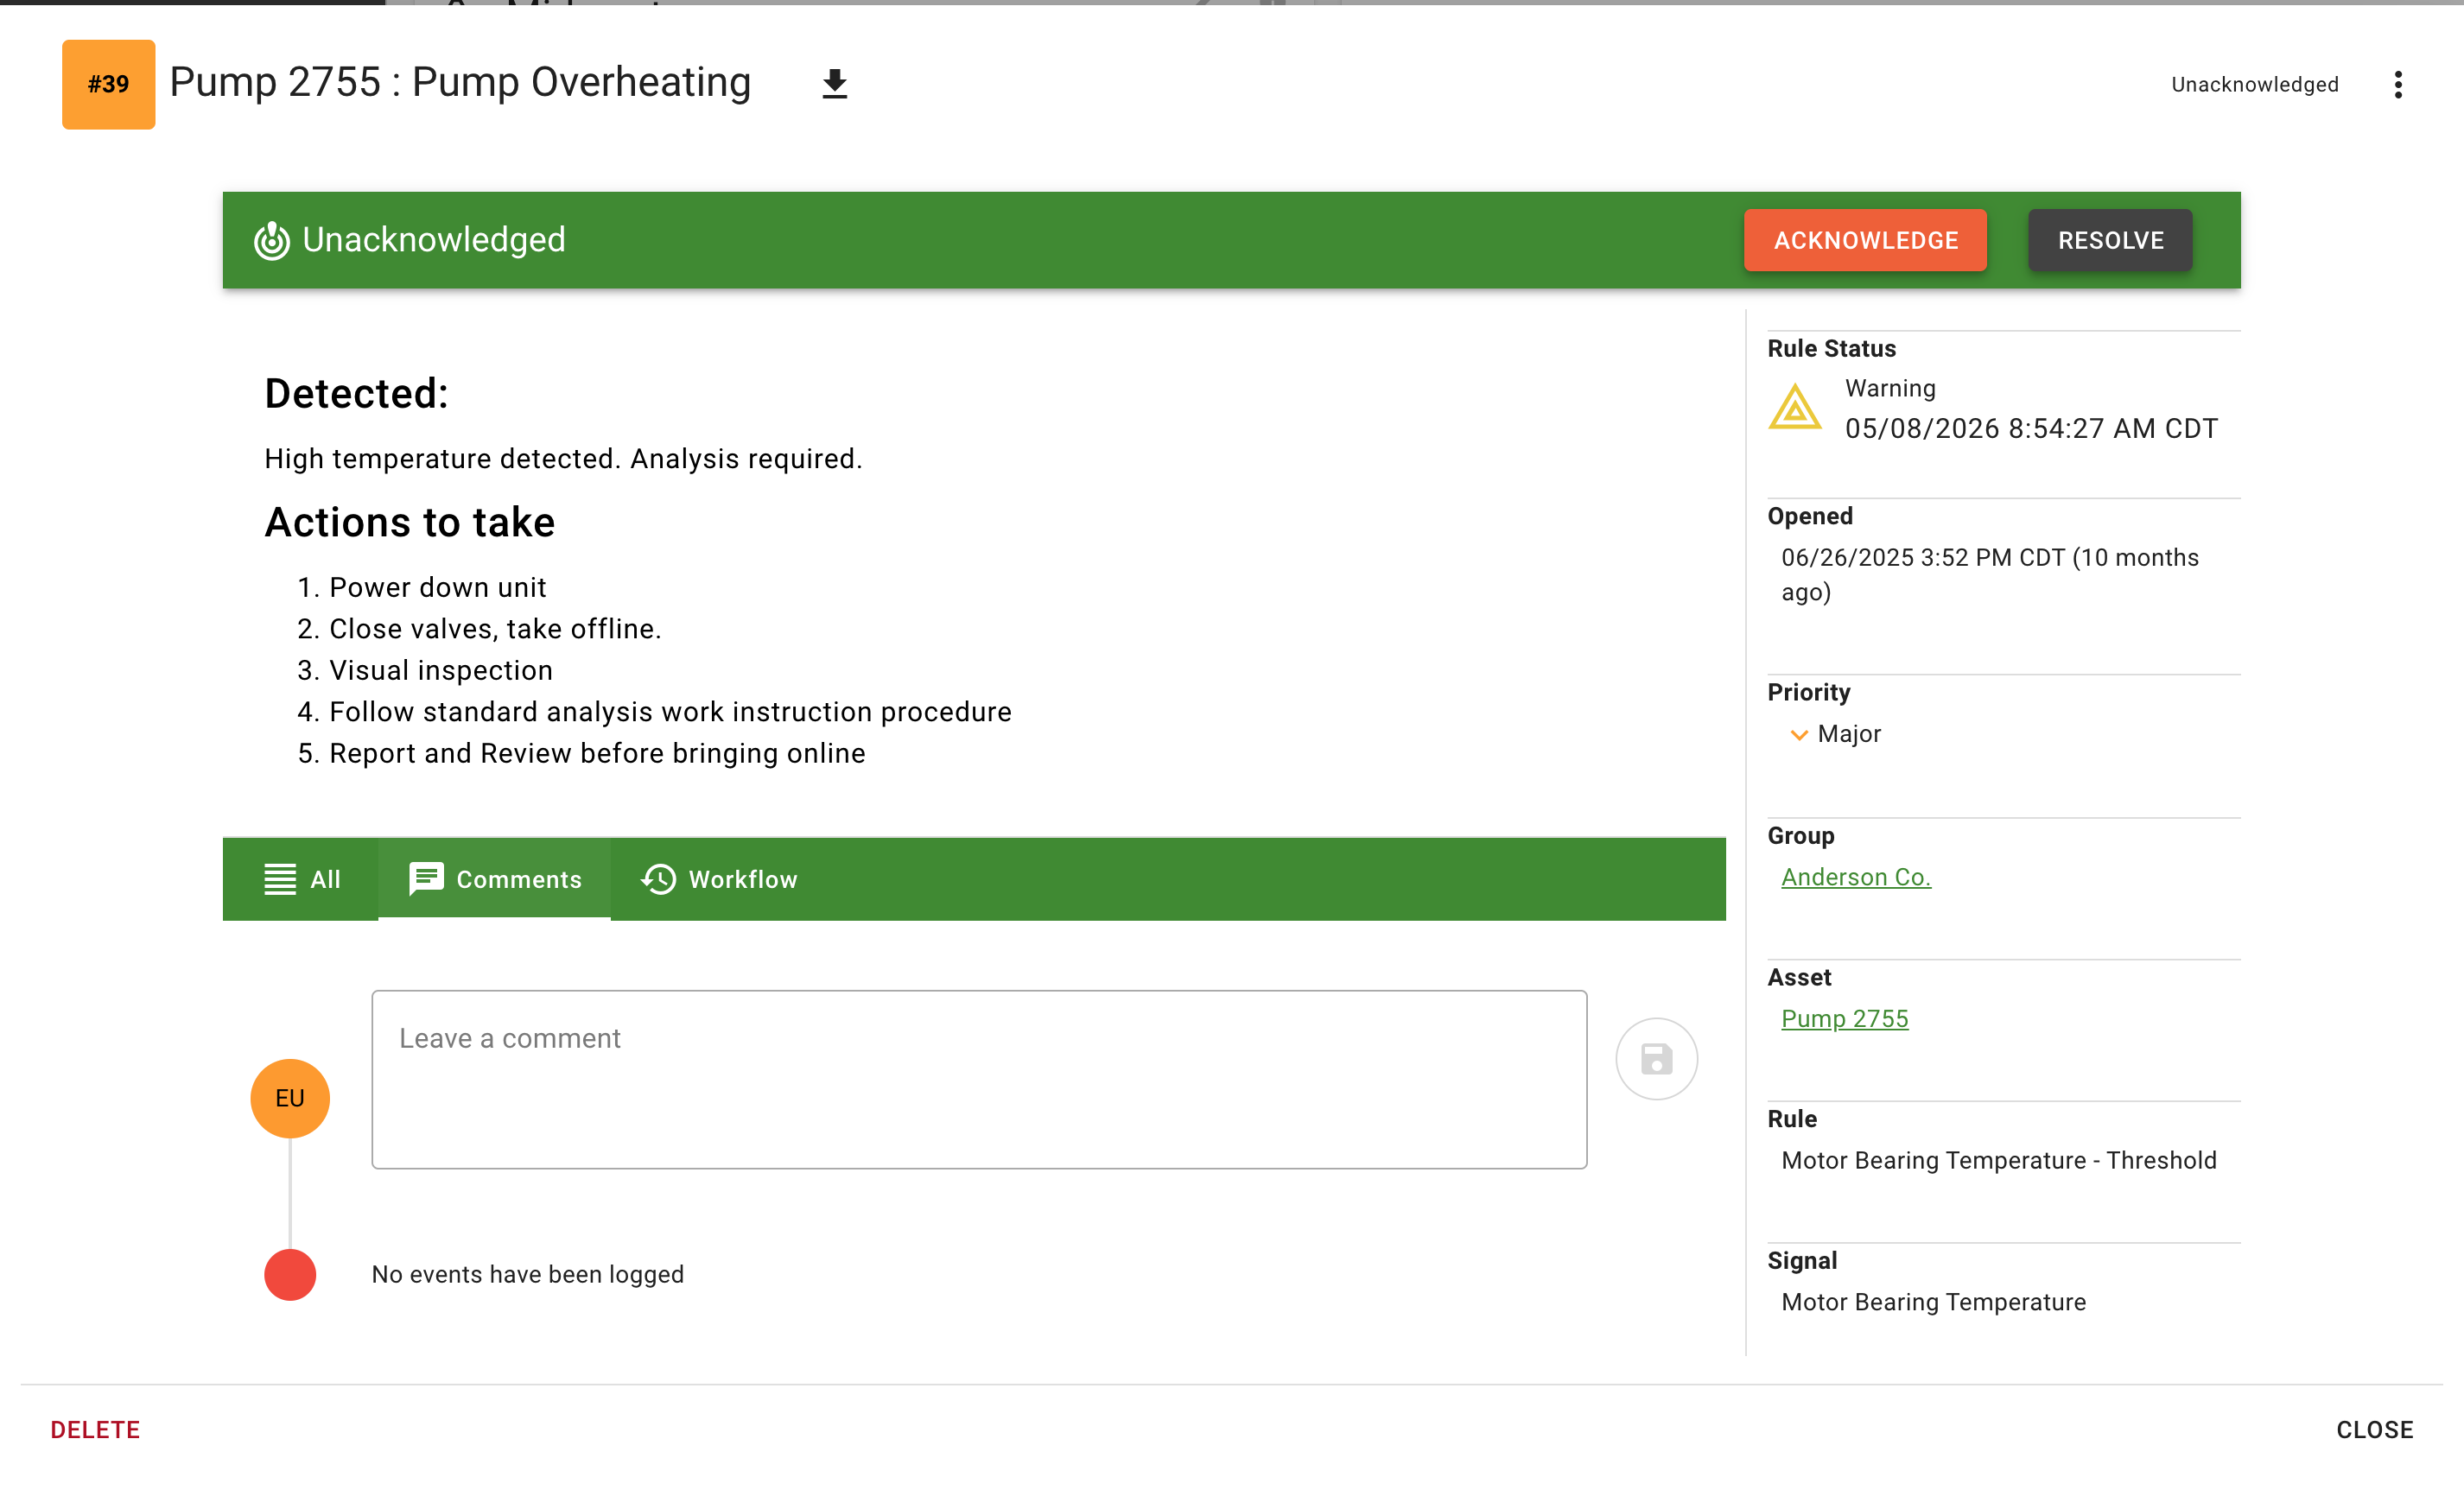
Active Conditions Log
This log tab will provide a list of the current active Conditions for all assets in the group with the life-cycle state of Unacknowledged or Assigned. Clicking on any specific condition will open the condition to allow viewing, adding comments, and updating the lifecycle. Clicking on a View All Conditions will bring you to the Conditions page with a filter in place for the group and Active conditions.