Units and Time


ExoSense provides configurable properties and user preferences to allow flexibility in the presentation of data values, units, and timestamps while maintaining a strong source of truth for data processing and storage.
Numbers and Units 
All data values for signals are stored as defined in the signal's properties using the source data type (e.g. FLOW) and source data unit (e.g. LPM), noting that some data types do not have a unit (e.g. STRING) and custom units may be used in some cases (see below). This provides the 'source of truth' for visualization, conversions, data pipeline functions, and storage.
More information about Signals
Signal Visualization units vs Source unit
Signal's may optionally specify visualization units as properties for the Metric and US systems. The visualization unit may be different then the source (but will always be of the same type (e.g. Pressure). This is helpful when the source raw values are not aligned with how user's typically expect to see the data.
- Source unit is how the values are stored, processed in the pipeline, and is the base for all unit conversions.
- Visualization units (Metric and US) on each signal may be used to dynamically convert in the UI (dashboard panels, grid views, etc).
Example: A signal's source type may be FLOW, the source unit may be Liters per Minute (LPM), and the visualization unit properties could be Liters per Second (LPS) for Metric and Gallons per Second (GPS) for US.
See the Unit Conversion section below for more information.
Numeric Data Presentation and Storage Summary
- Numeric signal data values are stored as IEEE Double format.
- Visualizations use the signal's source type, visualization unit properties, source unit, and precision, but can be configured to convert units in certain dashboard panels and can auto-convert using a user's preferred units, unit system, and current visualization settings.
- The user's profile Number format is also an automatic visual conversion
- All signal pipeline processing (transforms, rules/thresholds, etc) always use the signal's source units and type.
- Signal data can be converted using transforms, which creates a new signal using the specified units - resulting in two signals with the same data essentially.
Number Formats
User's may specify how numbers, dates, and time are formatted based on personal and regional preferences. These can be configured in their User Preferences
Supported Units
A full list of supports signal types and units can be found in this detailed document Supported Asset Signal Data Types and Units. Units are supported end to end, from IoT edge device / sensor to the web application and thus why these are built into the system. This ensures unit conversions can be supported and a source of truth is maintained.
Custom Units
When using a signal with data type of NUMBER or STRING, the unit property of a signal can take custom units. These will not support any unit conversion throughout the application.
More information about Signal units and custom units can be found here
Supported Unit Systems
| System | Description |
|---|---|
| Asset's Defined/Source Units | (Default) The original signal sources as defined in the asset and asset dashboards. |
| Asset's Unit System | An asset may specify a preferred unit system, which may be different then the signal sources. This is defined at the Asset Information / Configuration level. Asset Overview |
| SI (metric) | SI metric system |
| US | US Customary / Imperial system |
Unit system conversions use an assumption for closest unit to unit conversion which may not fit each personal preference. It's recommended to specify the signal's visualization unit properties to ensure that the correct unit conversion is used for each system, metric and US.
Unit Conversion 
Dashboard panels may leverage the Signal Specified Visualization Units unit option in configuration. This option will default to using the signal's visualization unit properties if set or fallback to the source unit of the signal for a dynamic approach to what to show a user looking at that dashboard. For Metric and US system decisions, this is based on the user's preferences and current visual settings (if enabled) or will use the Asset's unit system.
In some cases, dashboard editors may choose to specify an exact unit vs using the dynamic conversion functionality.
How do I change or convert signal types?
Signal unit conversion within a type is allowed as detailed above. Converting signal types can be performed by a transform function where the outlet signal has been converted to the different type. An example may be converting FLOW to a PERCENTAGE.
User Controlled Conversions
There are two ways for users to control unit conversions themselves.
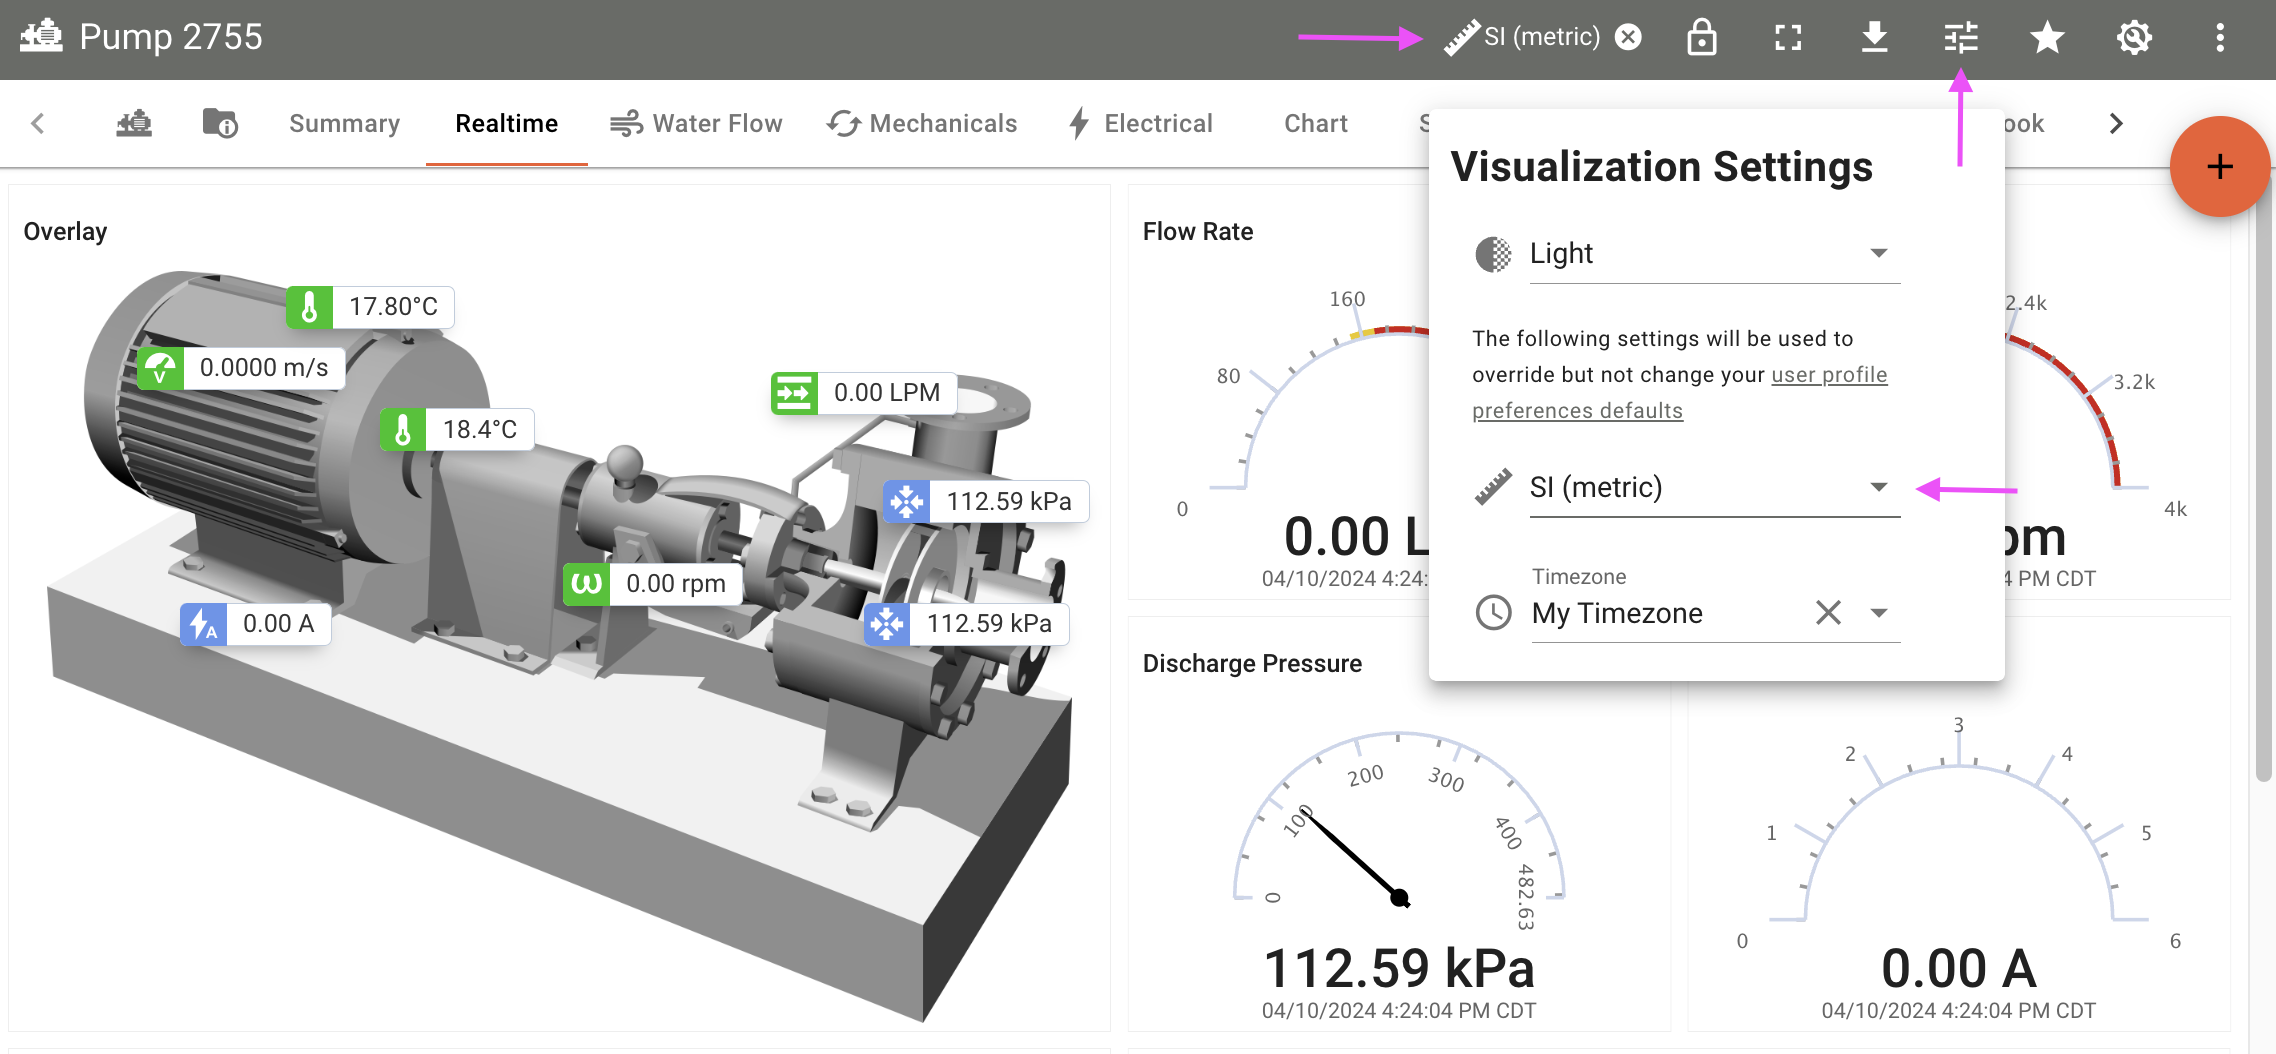
Visualization Settings Menu
The Visualization Settings header menu provides the ability to temporarily switch unit systems (and timezone). When choosing a unit system, this will be indicated in the header and is temporary. The preference does not change your user preferences and will be used temporarily as you browse asset dashboards.
User Preferences
Optional Feature
This feature may not be enabled on all ExoSense instances.
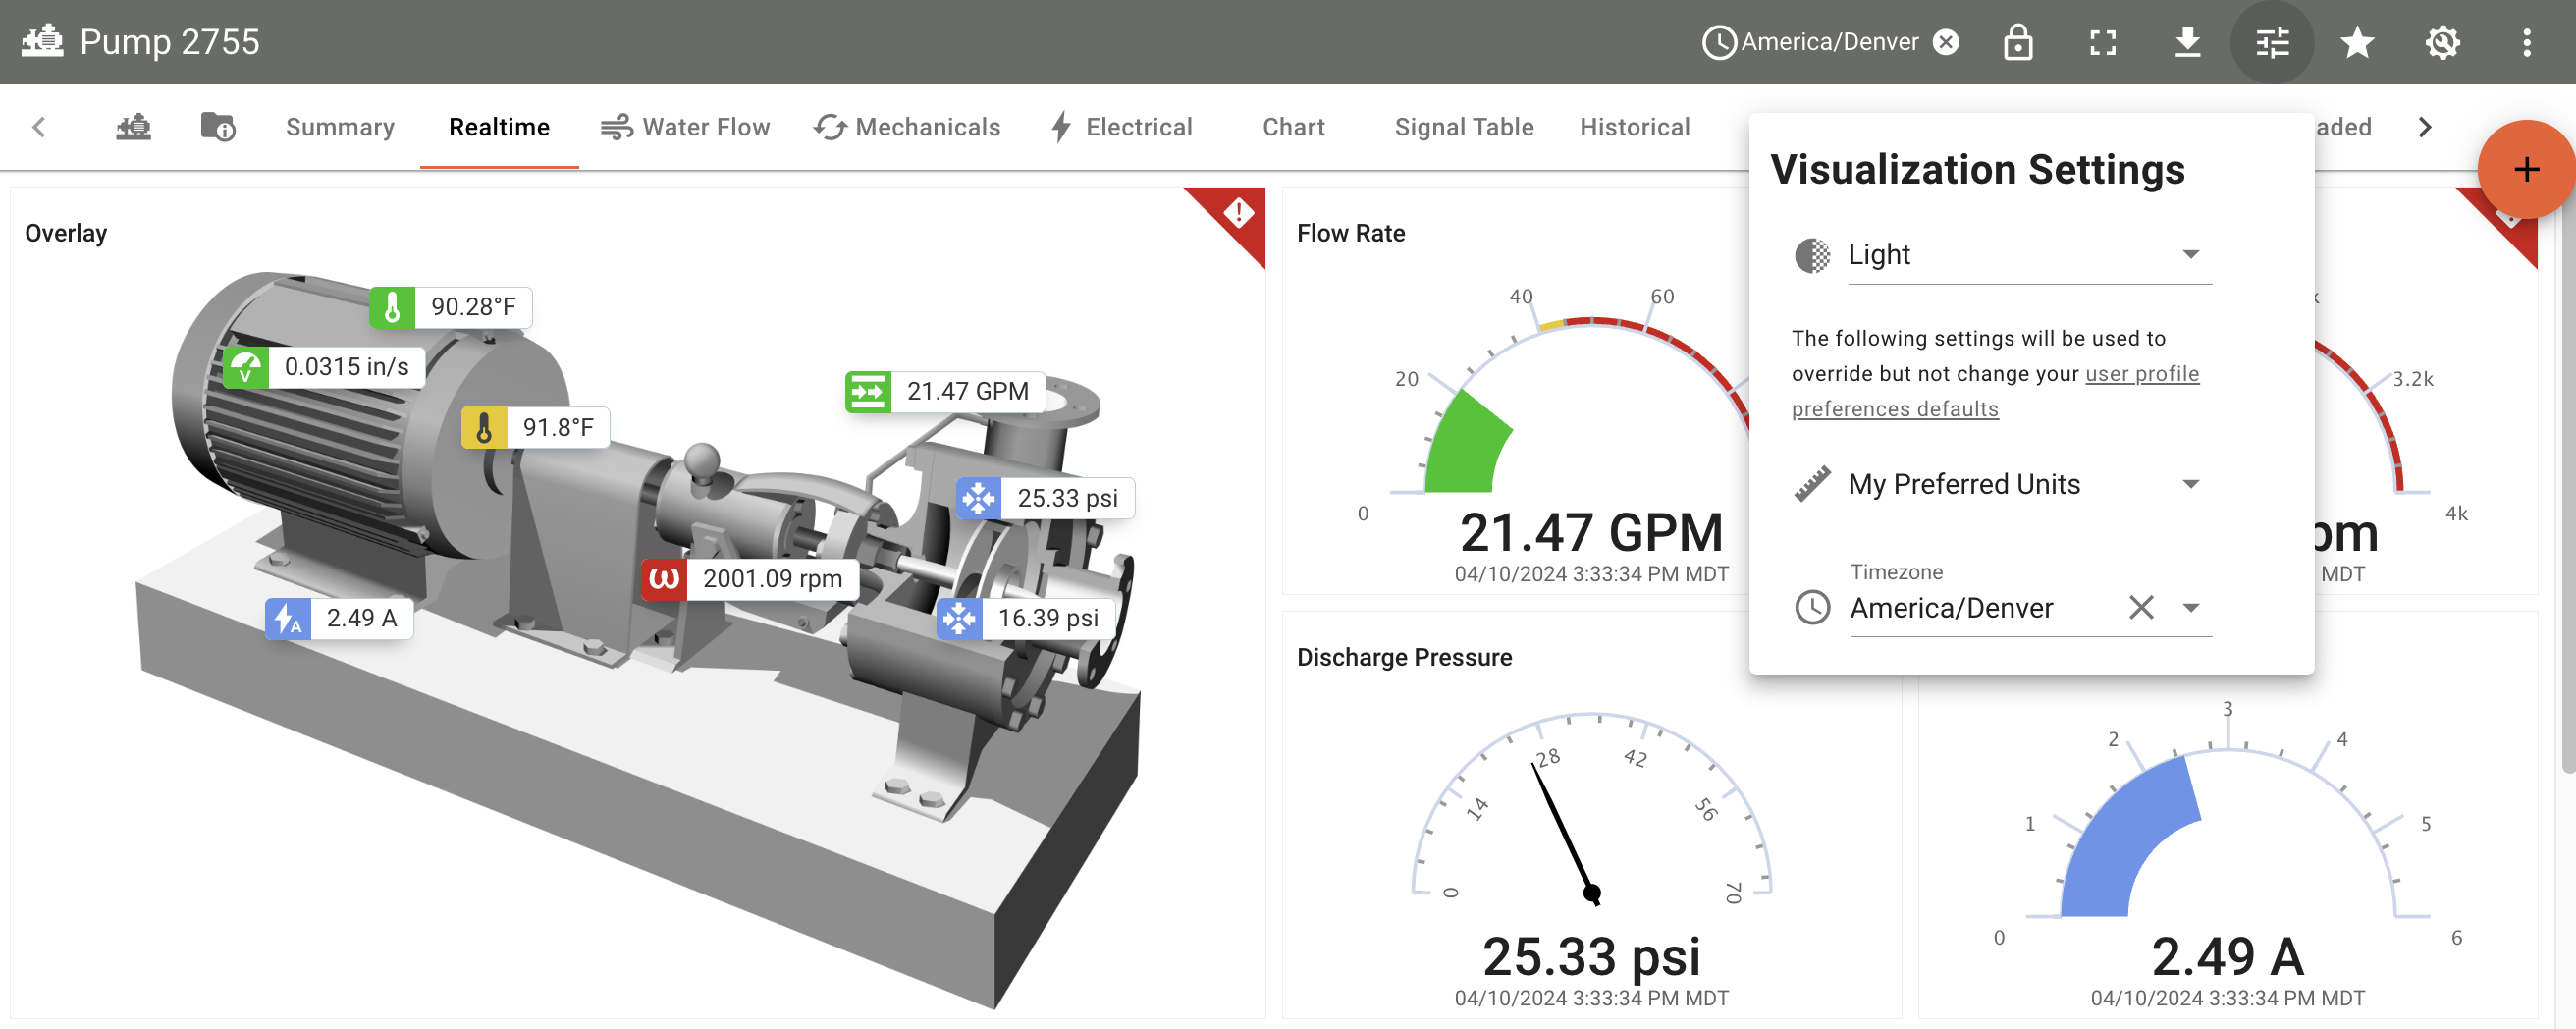
A user's preferences for the user's formats (data, time, and number), and preferred units in most cases allow user's to customize how they view the data, without changing the source of truth. The preferred visualization units are applied to these visualizations when possible, taking priority of the units to be viewed. These settings do not change the source definition of Device channels, Asset Signal Types and Units or to rule and transform function logic.
User's may specify their preferred unit system and also very specific unit conversions to be precise when just changing a unit system may not address the exact unit they want to see.
More information about User Preferences
Timestamps & Timezones
No matter where a source device or asset is located and what timezone it is in, the actual data for signals uses UTC timestamps for the source of truth.
Dashboards, asset grid view, and essentially anywhere that shows value timestamps will use the user's timezone specified in their profile preferences. This timezone is set initially based on the user's computer system browser but can be set to any timezone, including UTC if they prefer. Note: Data Reports allow for options for timezone and format.
Timestamped Data and Timezones Summary
- Signal data values are stored using a UTC timestamps.
- The user's preferred timezone is used for visualization of timestamps.
- Time and Date formats are also visual conversions.
Visualization Settings Menu
The Visualization Settings header menu provides the ability to temporarily switch the timezone to view dashboards with. When choosing a timzeone, this will be indicated in the header and is temporary. The preference does not change your user preferences timezone nor the asset's actual signal data storage and will be used temporarily as you browse asset dashboards.
Recommendations
The following are recommendations for IoT source / device firmware developers and those managing assets and dashboard configurations.
- Review the supported data types and units for ExoSense. Supported Asset Signal Data Types and Units
- When creating channel configuration files for IoT source devices, review the types and units properties along with precision. Improper channel configuration creates source of truth issues down the pipeline.
- When creating an asset, specify the asset timezone and preferred unit system for that specific equipment based on it's regional preference and location.
- When creating asset signals, specify US and Metric signal visualization unit properties.
- When creating dashboard panels, leverage the Signal Specified Visualization Units option for the signals display unit, which will dynamically adjust.
These configurations will then allow for the greatest level of dynamic conversion based on a viewing user's preferences.