Anomaly Detection Insight
The Exosite Labs Anomaly Detection Insight service is available in Exchange to add to your ExoSense instance. This Insight service is currently provided as BETA functionality from our Exosite Labs. Please contact sales for more information.
Overview
Anomaly Detection Insight is a ExoSense-compatible insight module that implements univariate statistical methods capable of detecting anomalies from any given signal.
It provides two kinds of detection methods:
- Generalized Extreme Studentized Deviate \(ESD\) Test: It tests the null hypothesis that the data has no outliers vs. the alternative hypothesis that there is one outlier, and repeat it until an upper bound on the number of potential outliers
- Standard Deviation: this method is based on the a predefined standard deviation threshold as the upper and lower bounds for normal data, any data points appear out of the bounds will be labeled as anomalies. Following the 68-95-99.7 rule, it is usually set to 2 or 3.
A number of basic parameters can be used to fine-tune the false alarm rate of detections. The user can specify a recent window to return only the latest detected anomalies after that to avoid getting duplicated results.
Capability Highlights
- Automatically detect anomalies from individual signals based on statistical evidence in history data
- Earlier detection of some abnormal symptoms like spikes/dips, which could be helpful for predictive maintenance
- Scalable and applicable to diverse kinds of signals, then you don’t need to rely on limited human experience to set proper alarm thresholds for hundreds or even thousands of monitored signals manually
- Could also be used as a preprocessing step for outlier removal (under development)
Note: the assumed timestamp granularity is by seconds.
Configuration Parameters
The following table summarizes a list of configuration parameters for Anomaly Detection Insight.
| Parameter | Description | Default Value | Example Value |
|---|---|---|---|
| alpha_level | The level of statistical significance (the probability of false positive) with which to accept or reject anomalies. Default value is 0.05 (5%), which means it is acceptable to have a 5% probability of incorrectly false positive detections to anomalies. | 0.05 | 0.05 |
| direction | Directionality of the anomalies to be detected. Options: pos (positive only), neg (negative only), both (positive or negative) | both | both |
| max_anoms | Maximum number of anomalies to detect as a percentage of the data. Default value is 0.05 (5%), which means at most 5% of the data points will be considered as anomalies. | 0.05 | 0.05 |
| method | Method to use for anomaly detection. Options: std (Standard Deviation), esd (Generalized Extreme Studentized Deviate Test) | esd | std |
| recent_window | Relative start seconds of recent window to return only latest detected anomalies. For example, setting this to 5 means to only pay attention to the data points sent in recent 5 seconds. Set -1 as the value to disable this constraint. Maximum: 86400 | 5 | 120 |
| std_threshold | The number of standard deviation to be used as the upper/lower thresholds for detecting anomalies. | 2 | 2.5 |
| window_size | The size of learning window in seconds for detection. Maximum: 86400 | 30 | 1800 |
| sampling_size | The size of downs-ampling intervals in seconds as regular-spaced data points for detection. Maximum: 3600 | 1 | 30 |
"Tips"
The size of learning window and sampling slot highly depend on the characteristic of a given signal. Suggest to do some observations to the history data through line charts first, and see if there is any hourly, daily, weekly, monthly patterns. Define proper learning window size and sampling size based on that.
For example, if the machinery is following a daily operation cycle in a factory, it might periodically power on and off, and operates under variant load on demand. It would show common vibrations patterns from the sensors in normal status. In case of the occurrence of early failure symptoms, monitoring the machinery by setting several hours or 1 week as the learning window size could capture those anomalies.
Note that the learning windows size needs to be greater than or equal to the recent windows size. It is suggested to provide at least two period of data as learning window. By observation the period could be 4 hours, 8 hours, 1 day, 3 days, 1 week and so on.
The sensitivity of detection can be fine-tuned through max_anoms, alpha_level, and std_threshold (for std method only) parameters.
Setup Guide
This section shows the setup steps for adding Anomaly Detection Insight to an Asset of your ExoSense instance.
Enable Anomaly Detection Insight to ExoSense
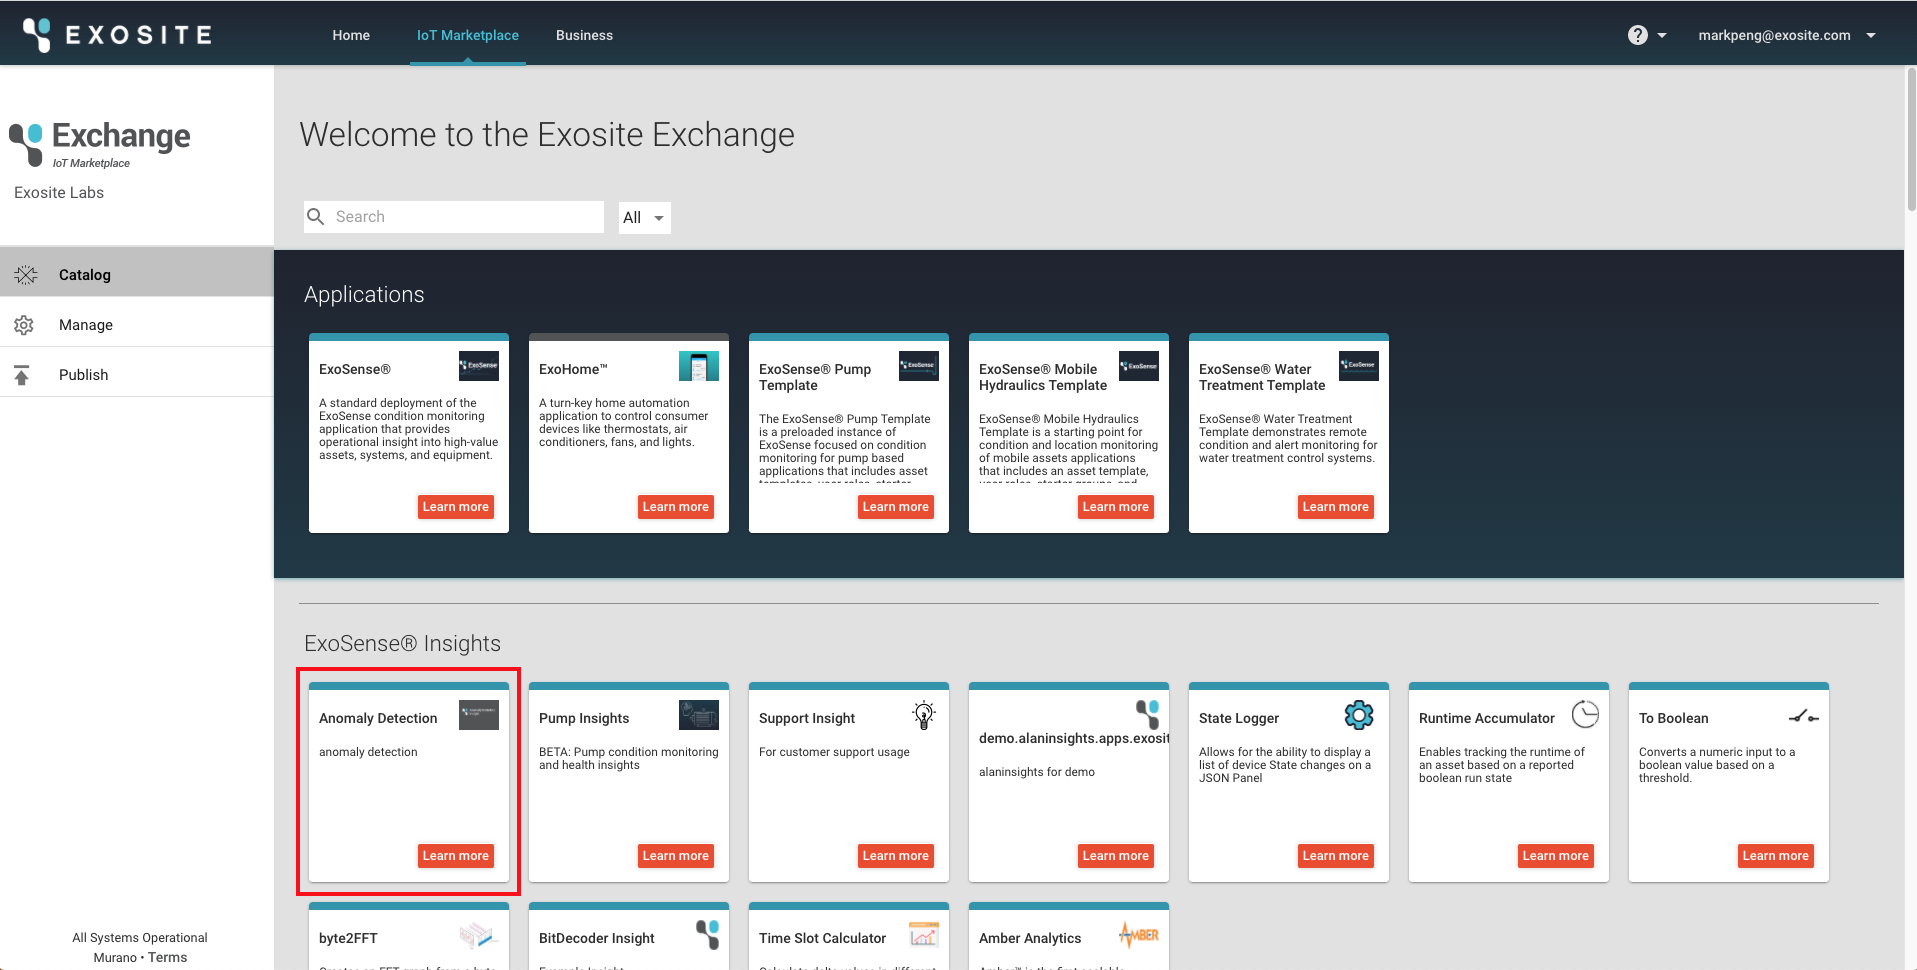
Under the "ExoSense Insights" category of the IoT Marketplace page, you should be able to see the Anomaly Detection Insight element. Click the "Learn more" button on that element.
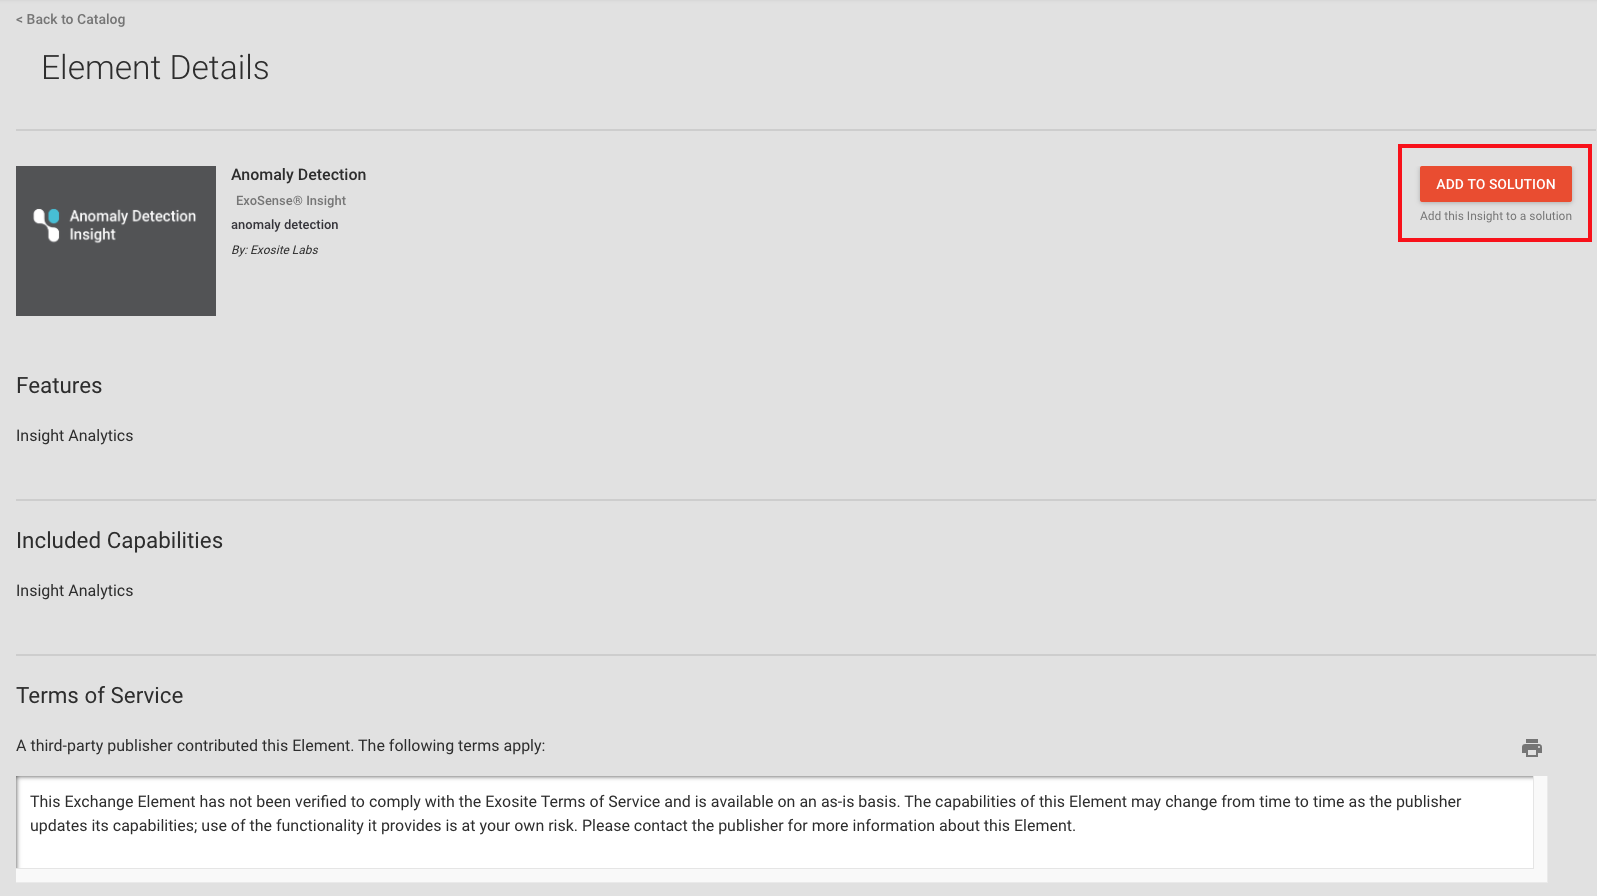
In the element page, click the “ADD TO SOLUTION” button to add this insight module to your ExoSense instance.
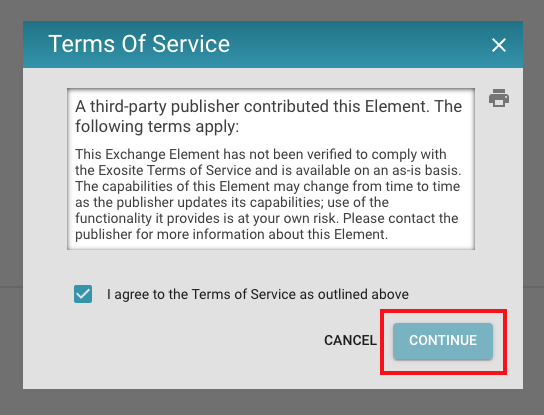
There will be a pop-up window asking you to confirm the Terms of Service, click "CONTINUE".
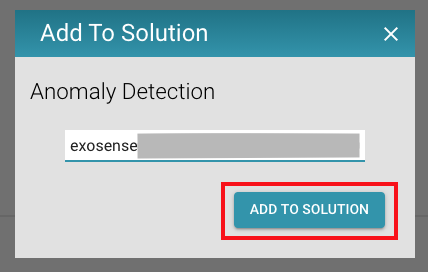
It will show a dropdown list of Murano solutions, please select your ExoSense instance and click "ADD TO SOLUTION".
After that, your ExoSense instance should be ready to use Anomaly Detection Insight for managed assets.
Anomaly Detection Demo
This section shows how to design a demo dashboard in ExoSense from a created Asset to show the detection of anomalies from an IoT device using real-time readings from accelerometer sensor.
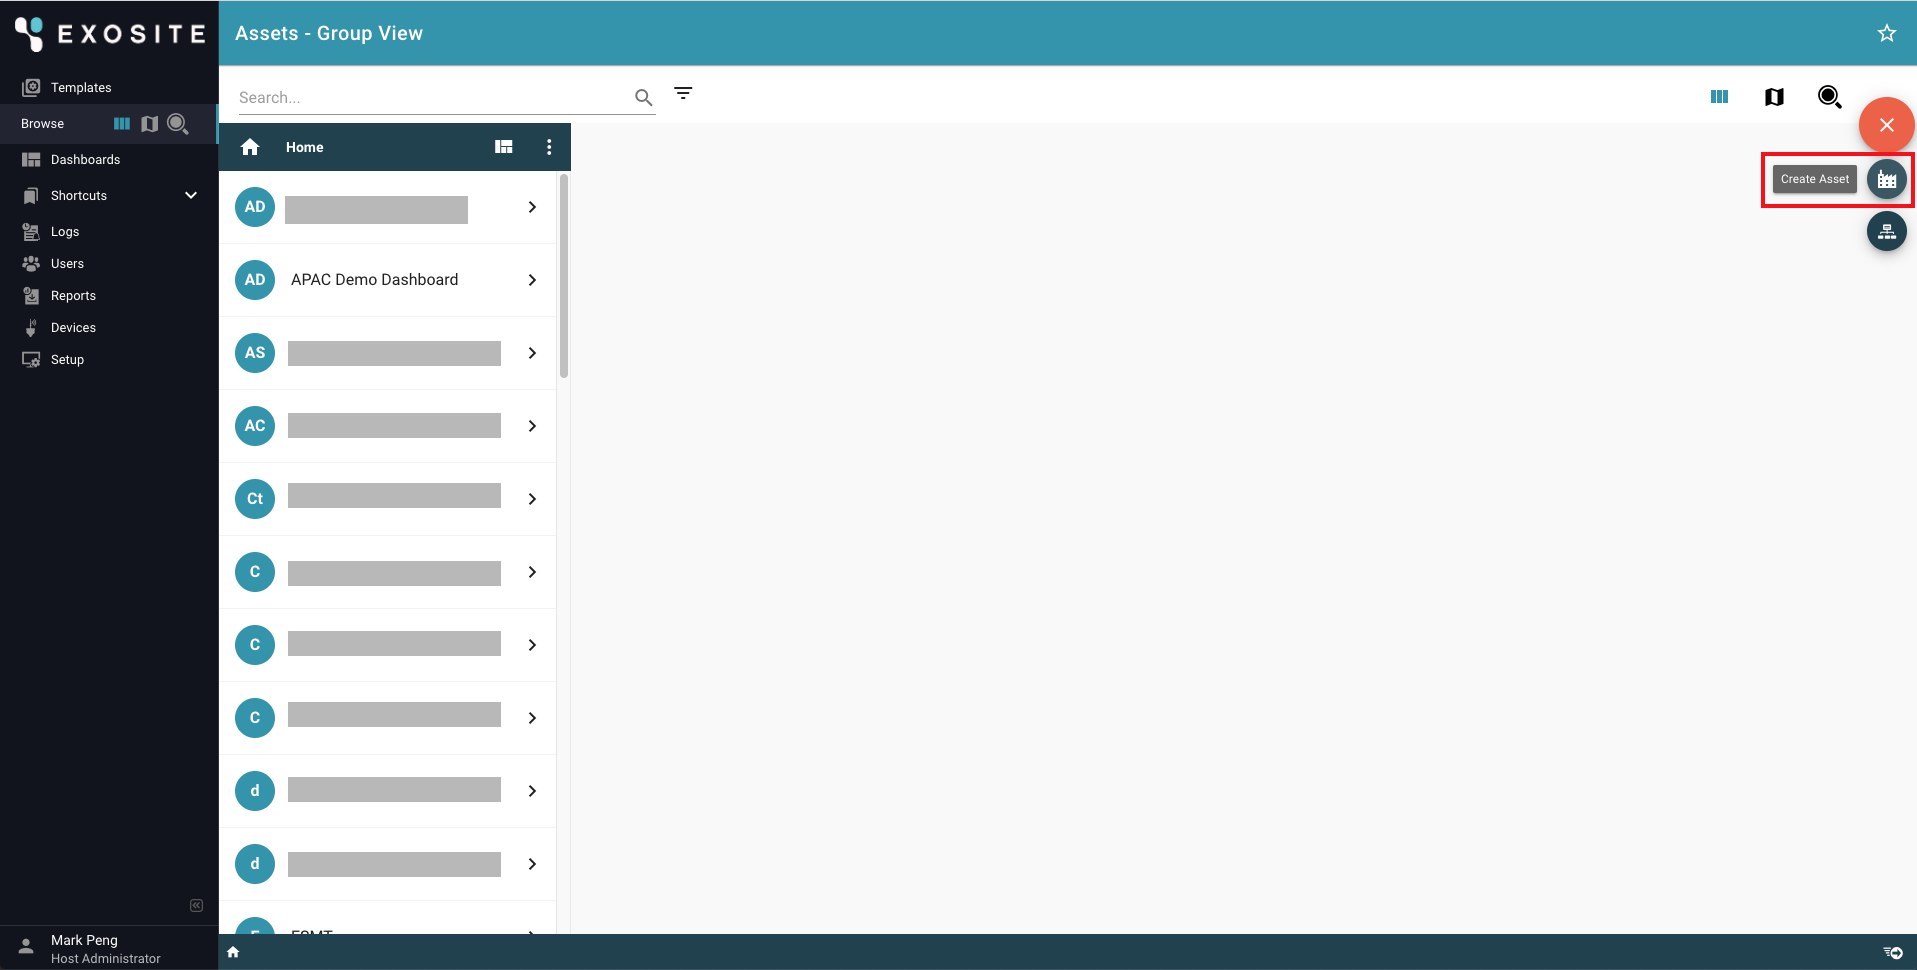
Go to Asset Group View page, click "Create Asset".
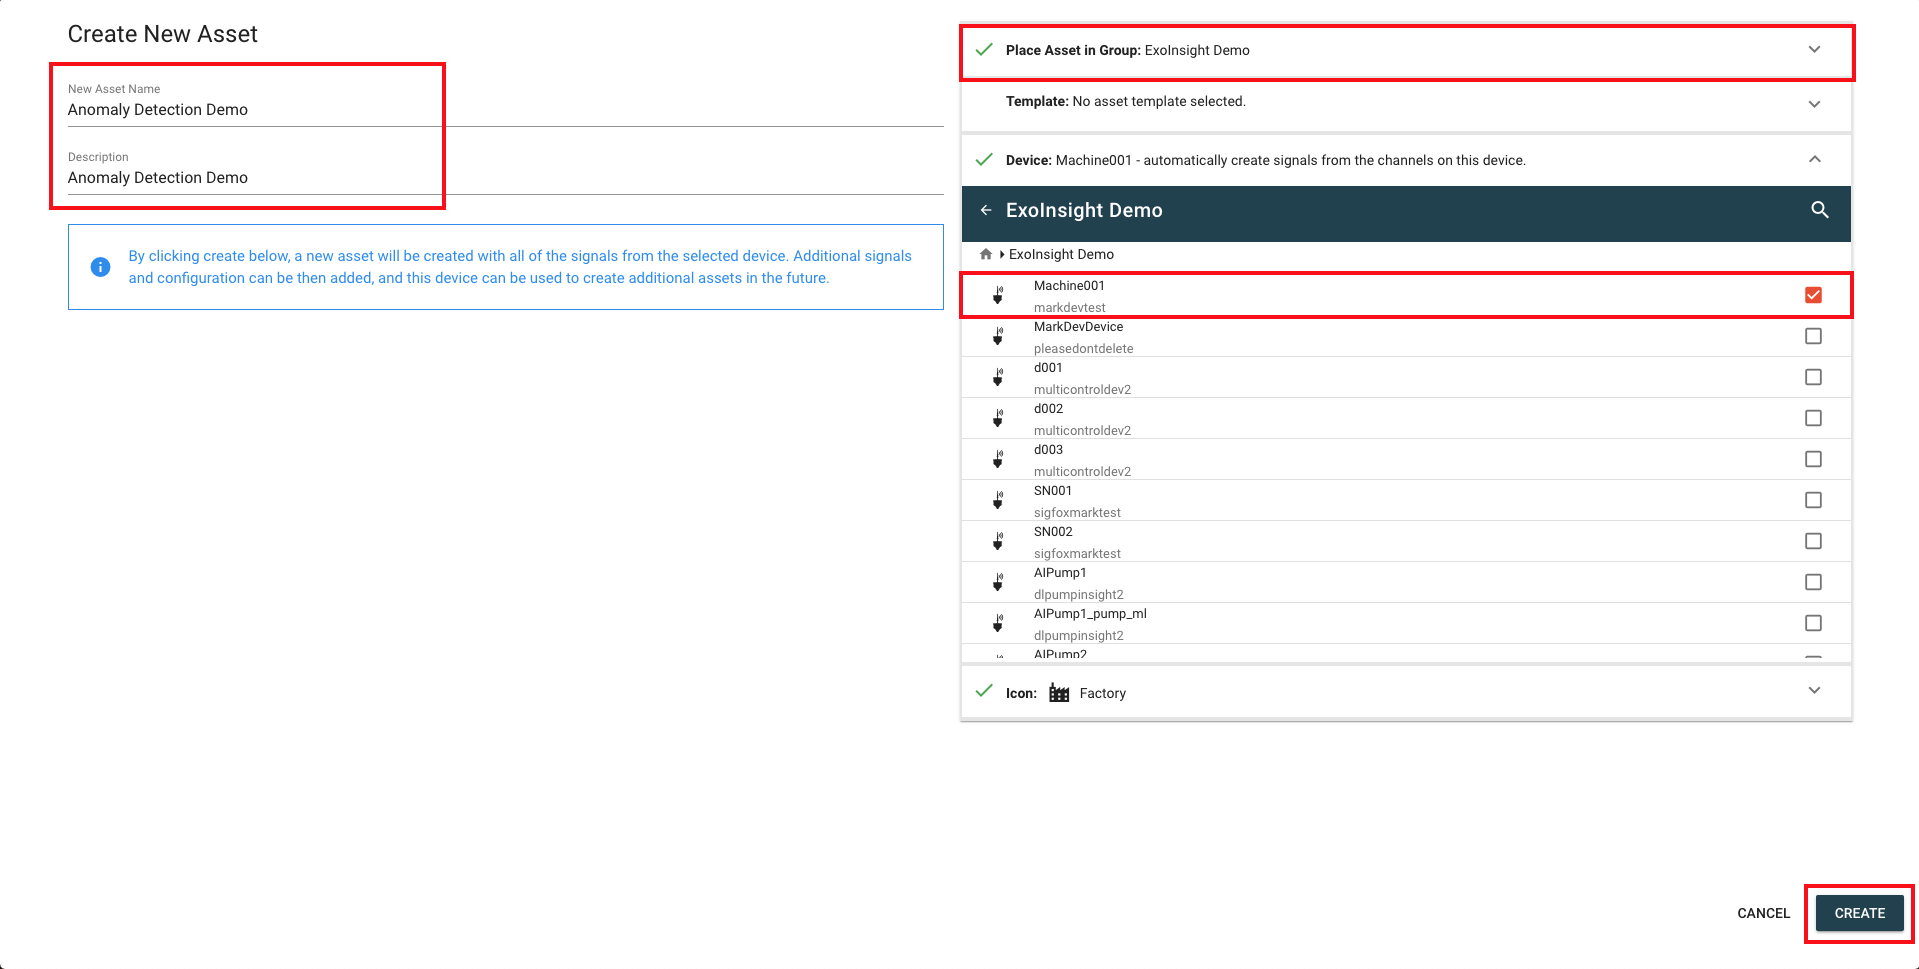
Type "Anomaly Detection Demo" or other preferred text for Name and Description, select the target group and device for this asset, and click “CREATE” button.
After creating the asset, it would redirect to the "Modify Asset page", click the circle button on the top right corner, choose the target signal \("X-axis Acceleration RMS - Left" in this example\), and click "SAVE".
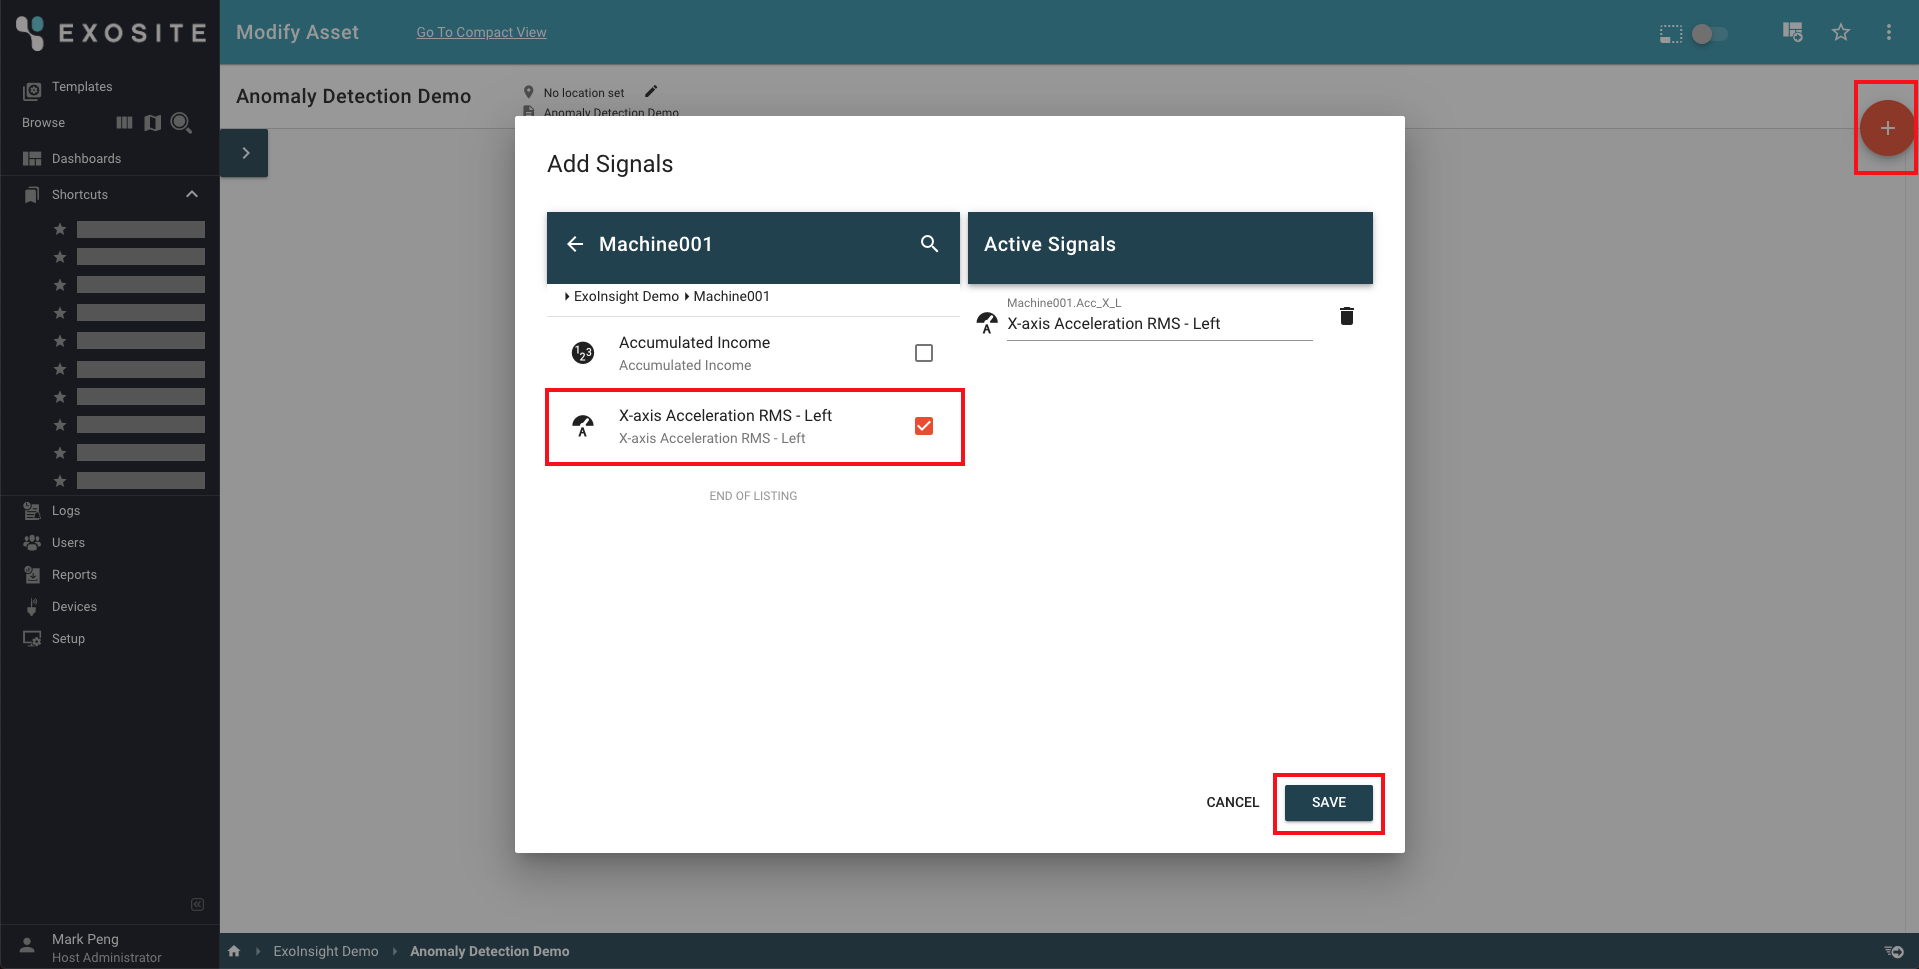
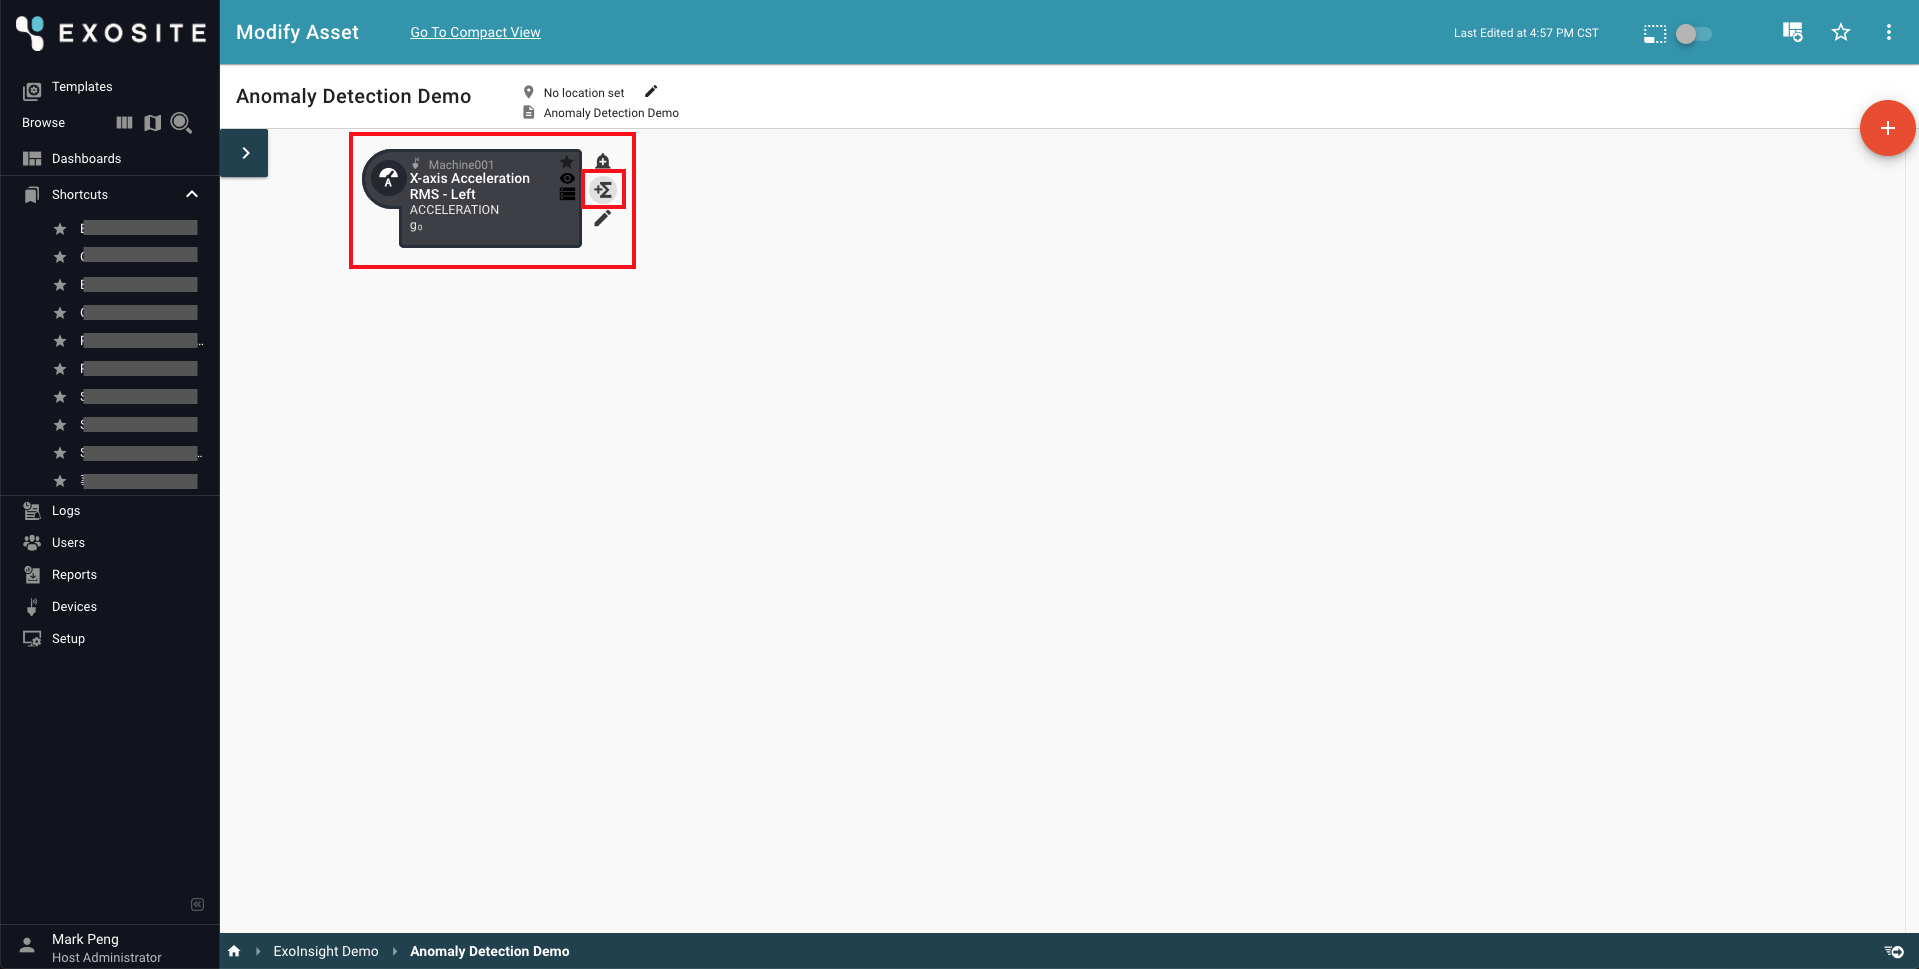
The selected signal should have shown on the "Modify Asset" page.
Link Anomaly Detection Insight to a Signal
Click the Sigma sign button showing on a target signal.
Type "Anomaly Detection" for the name field, and select "Analytics Insight" as the type, "Anomaly Detection" as the function.
![]()
Change the name of Output Signal to "Anomaly Count".
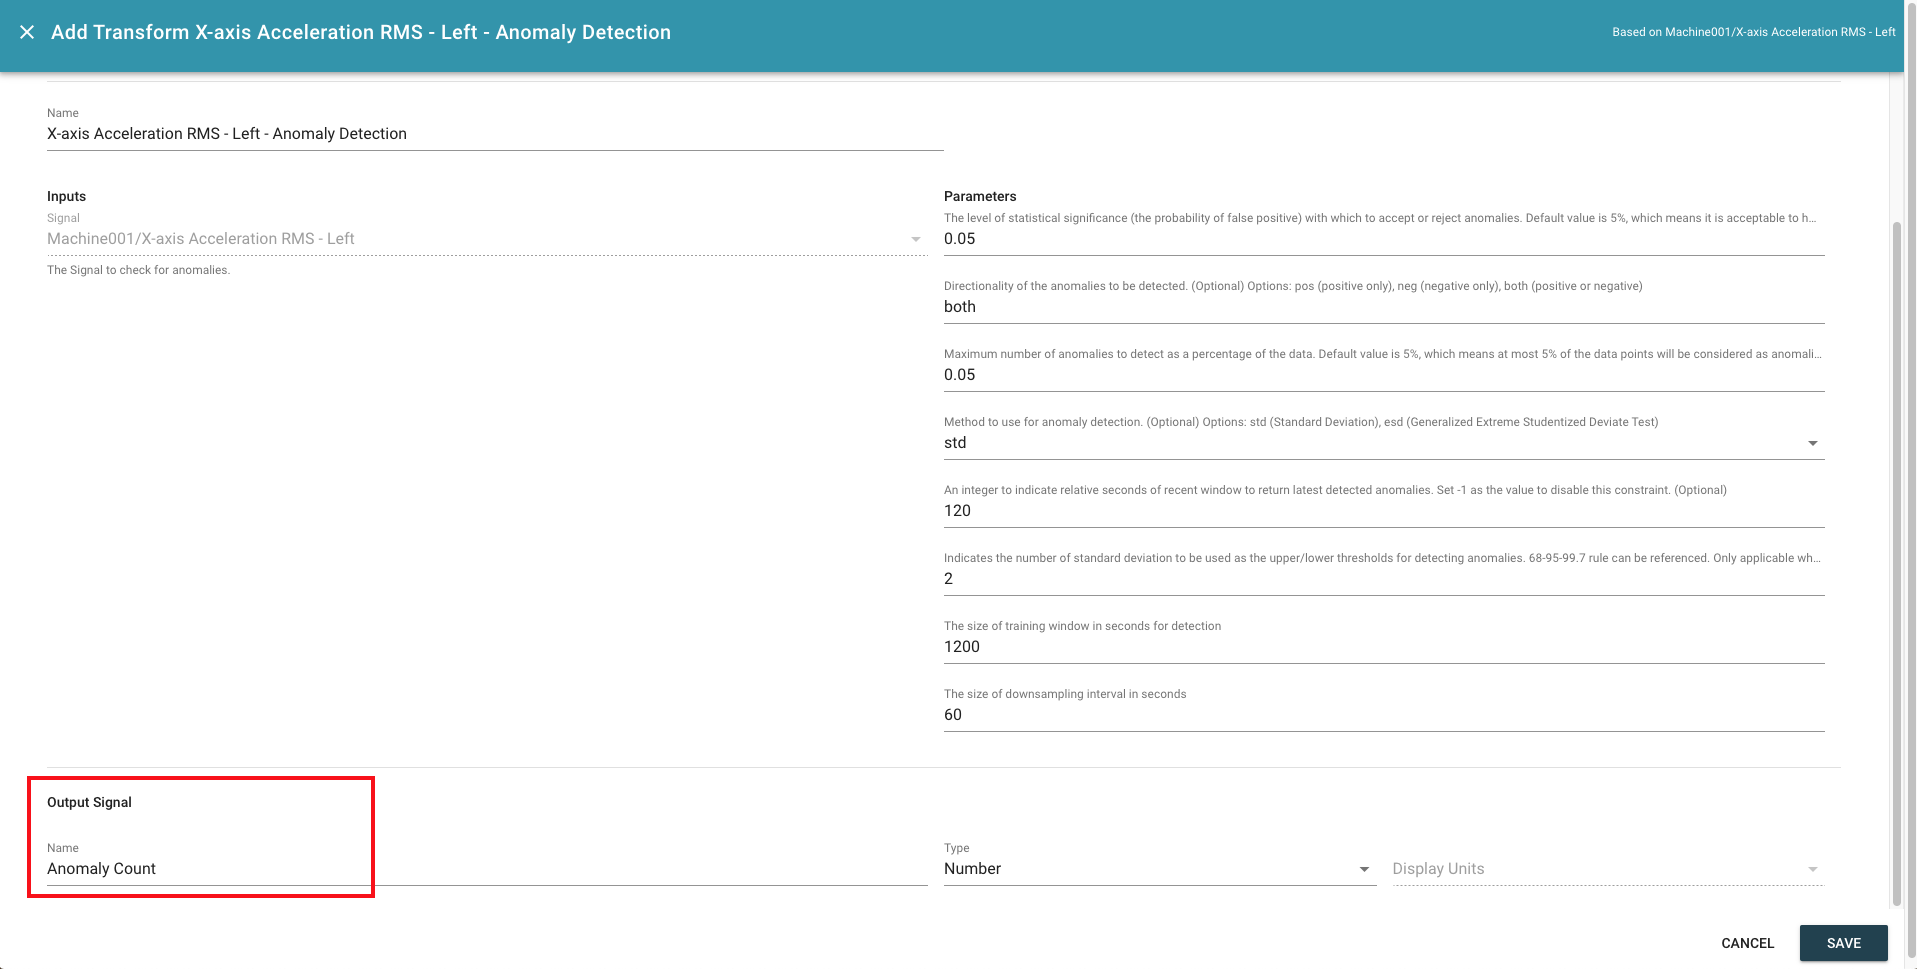
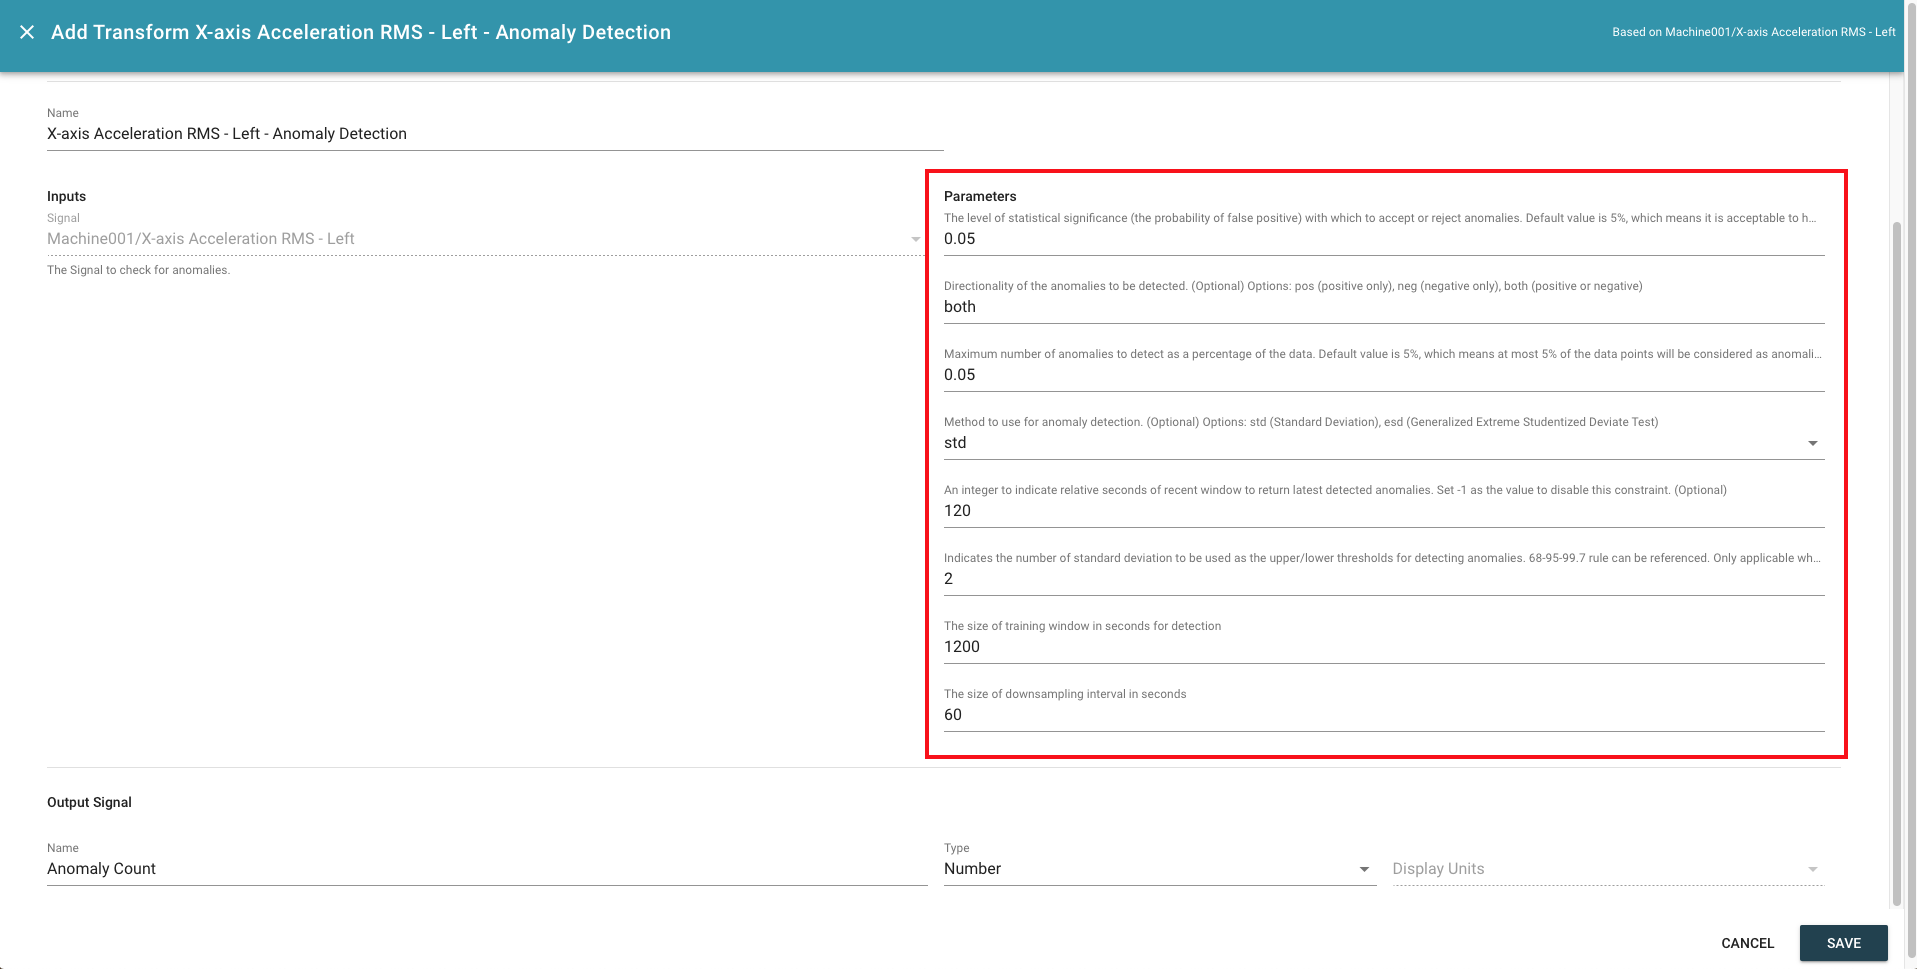
Set parameters of insight module based on the following Table 1. In this scenario, the model is learnt from the recent 20-minutes data of the given signal aggregated in 1-minute time slots. Note that we only generate the detection results for the last 2-minutes to avoid trigger alarms repeatedly.
Table 1. Parameters to Set for Anomaly Detection Demo Scenario.
| Parameter | Value | Note |
|---|---|---|
| alpha_level | Keep default setting. | |
| direction | Keep default setting. | |
| max_anoms | Keep default setting. | |
| method | std | Use standard deviation method for detection. |
| recent_window | 120 | Only detect latest anomalies happened in the last 2 minutes. |
| std_threshold | 2 | Use two standard deviations as the upper and lower bounds for normal data distribution. |
| window_size | 1200 | Train detection model based on the recent 20 minutes data. |
| sampling_size | 60 | Use 5-seconds as the size of aggregation intervals for history data. |
After that, click the "SAVE" button.
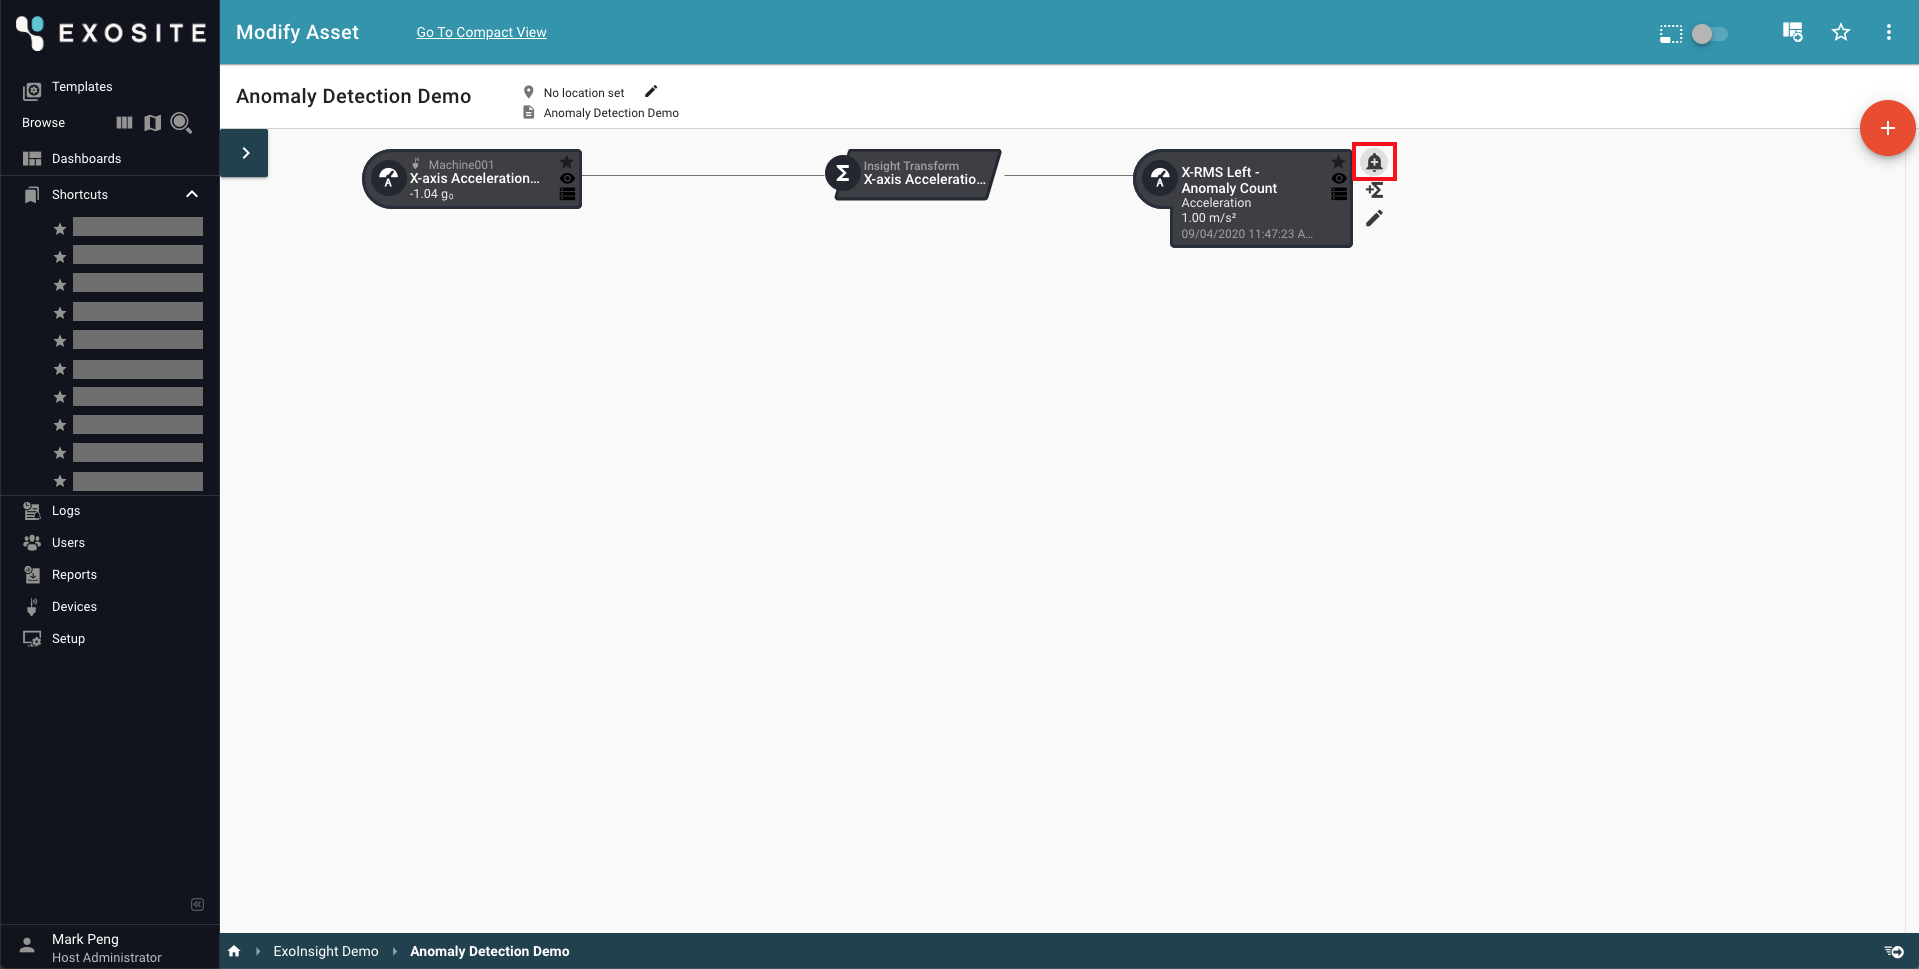
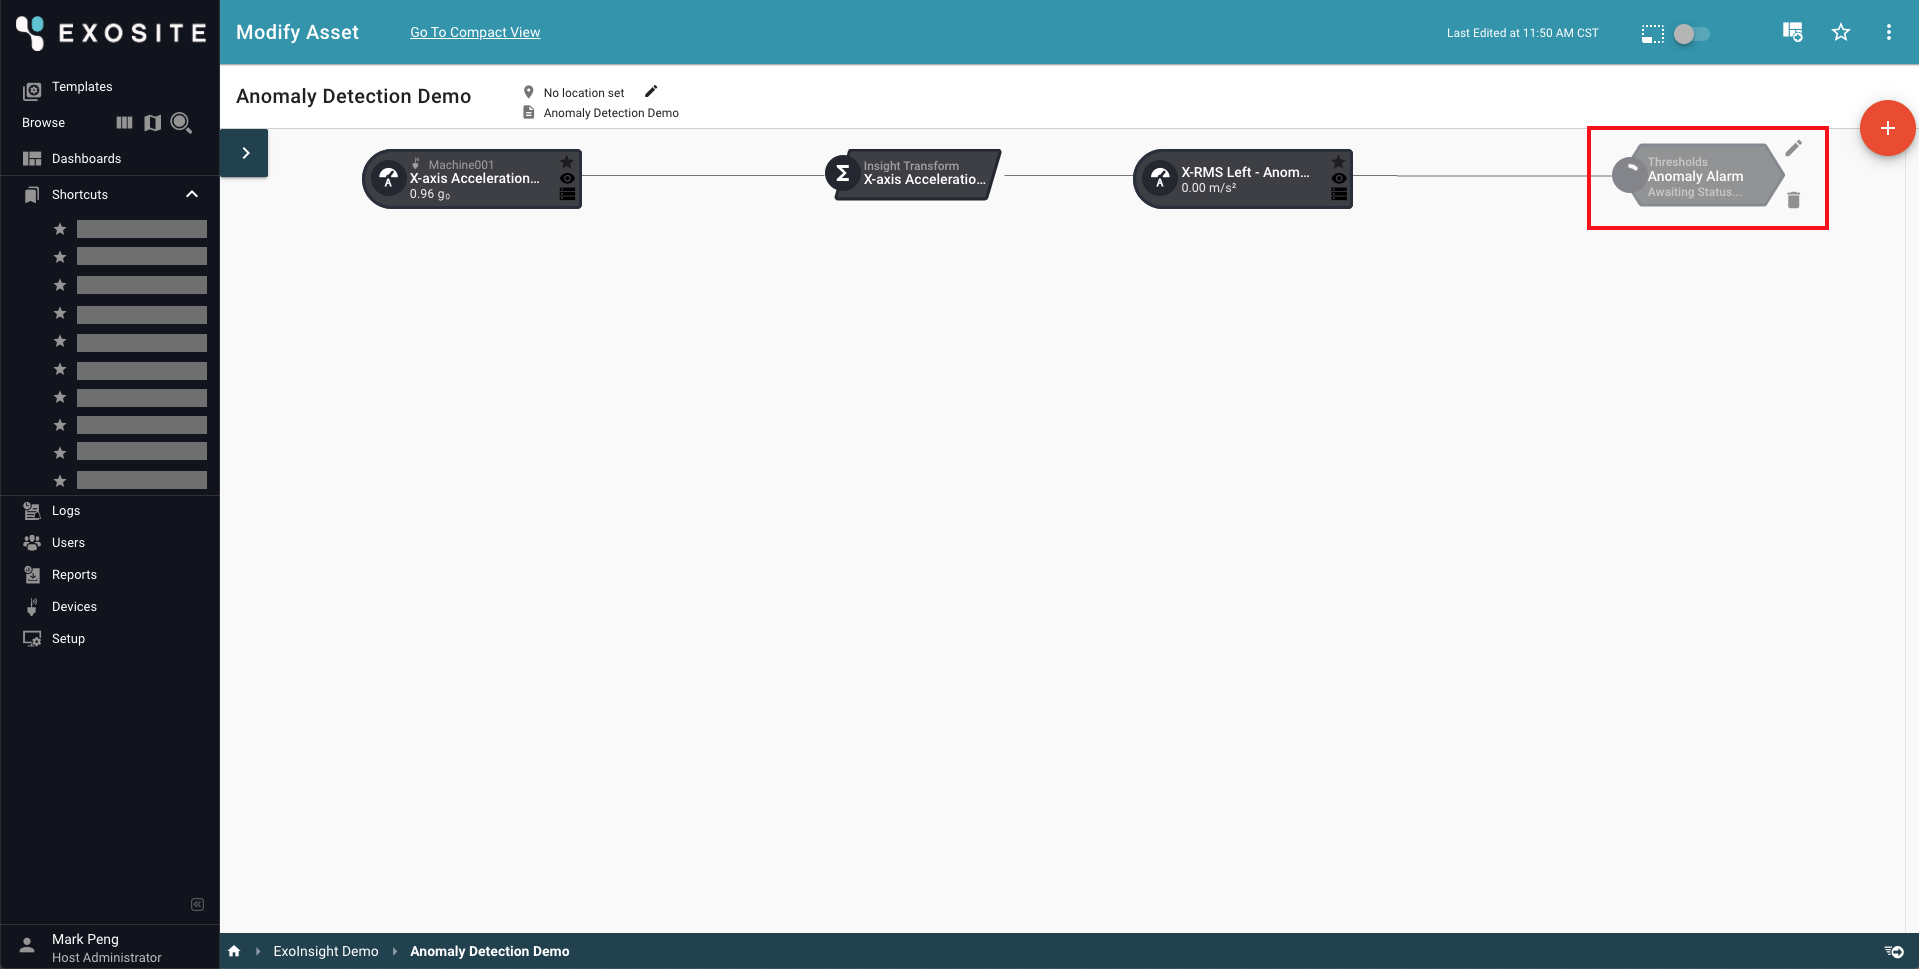
You should be able to see a Transform block created, linking with input and output signals. Next, please click the bell icon on the output signal block to create a new Rule.
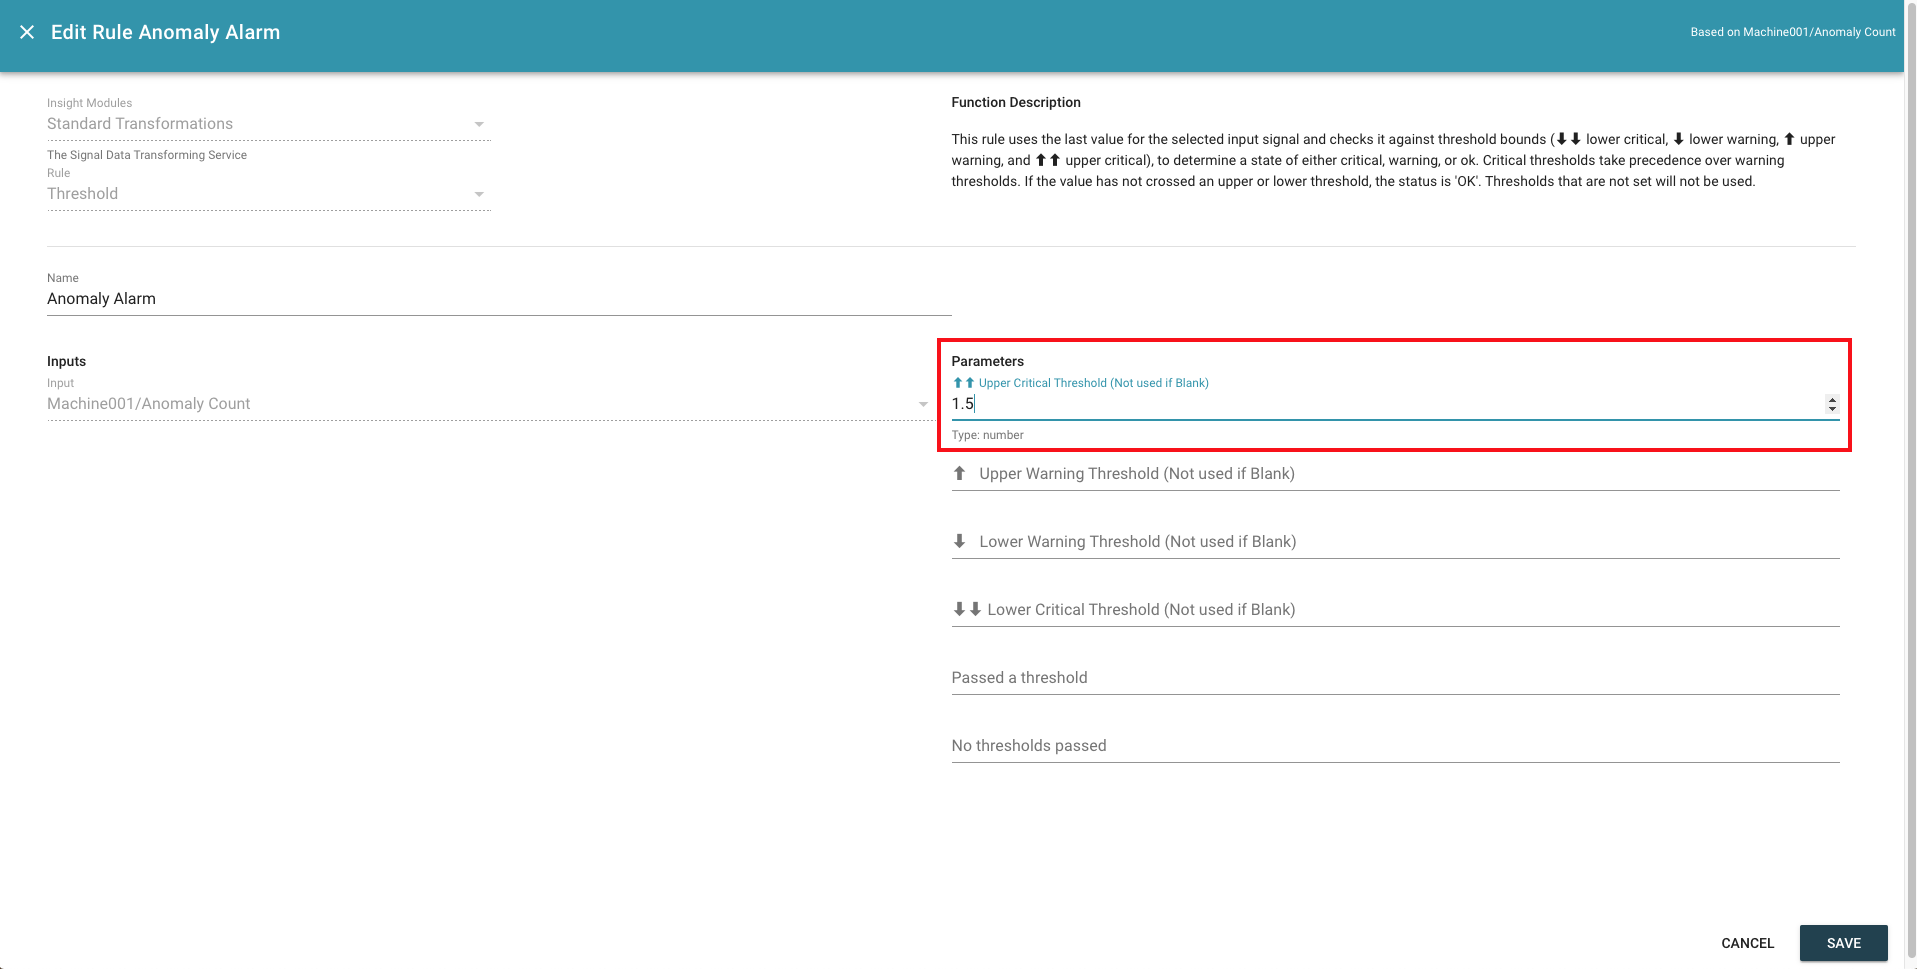
Under "Standard Functions", select "Threshold" as the function type. Type "Anomaly Alarm" as the name of rule. Set the threshold to 1.5 for "Upper Critical" option and leave blank to disable the rest 3 options. This is the way to display anomalies counts greater than zero to the red critical band of line chart. Click "SAVE" button to create the rule.
Once the rule is created, you should see a rule block linking with the output signal block.
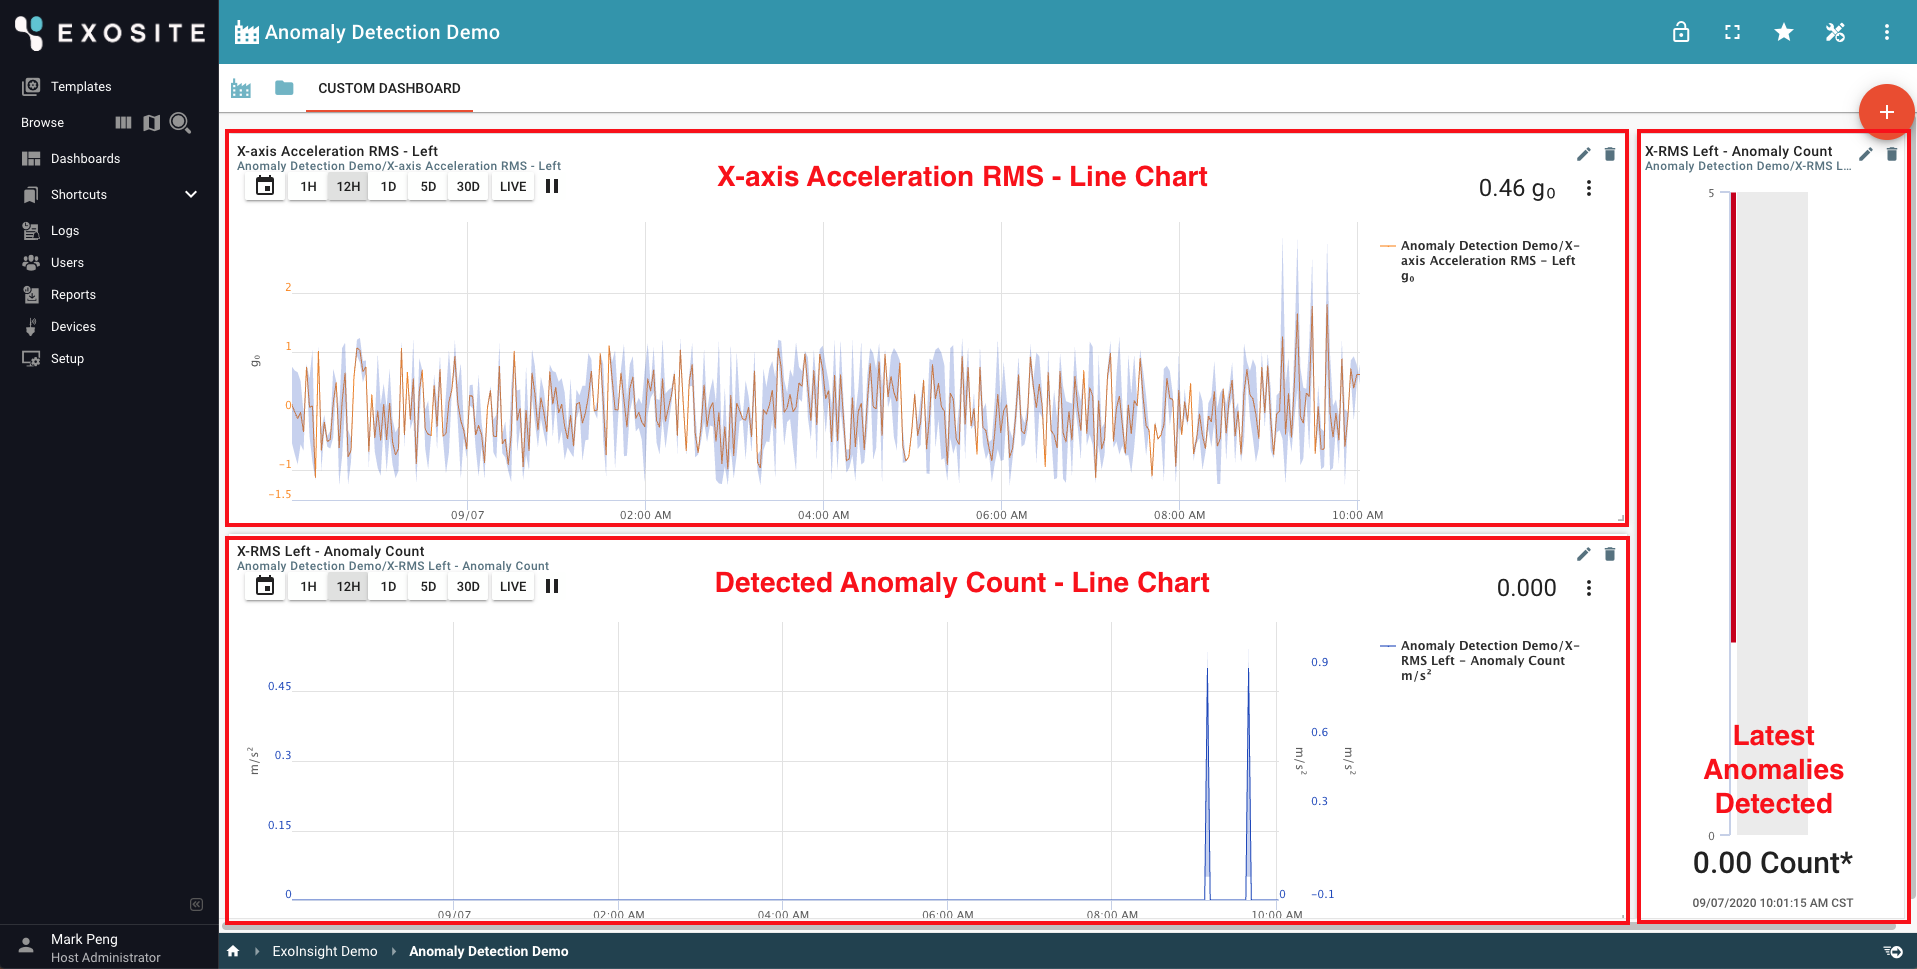
Design a Demo Dashboard
In this subsection, we are going to create 3 panels on the dashboard for demonstrating anomaly detection:
- Line Chart of X-axis Accelerometer: Raw signal values
- Line Chart of Detected Anomaly Count: Anomaly counts aligning with raw signal values
- Vertical Gauge Plot of Latest Detected Anomaly Count: Real-time value of anomaly count
The outlook of demo dashboard:
Add Line Chart for X-axis Accelerometer
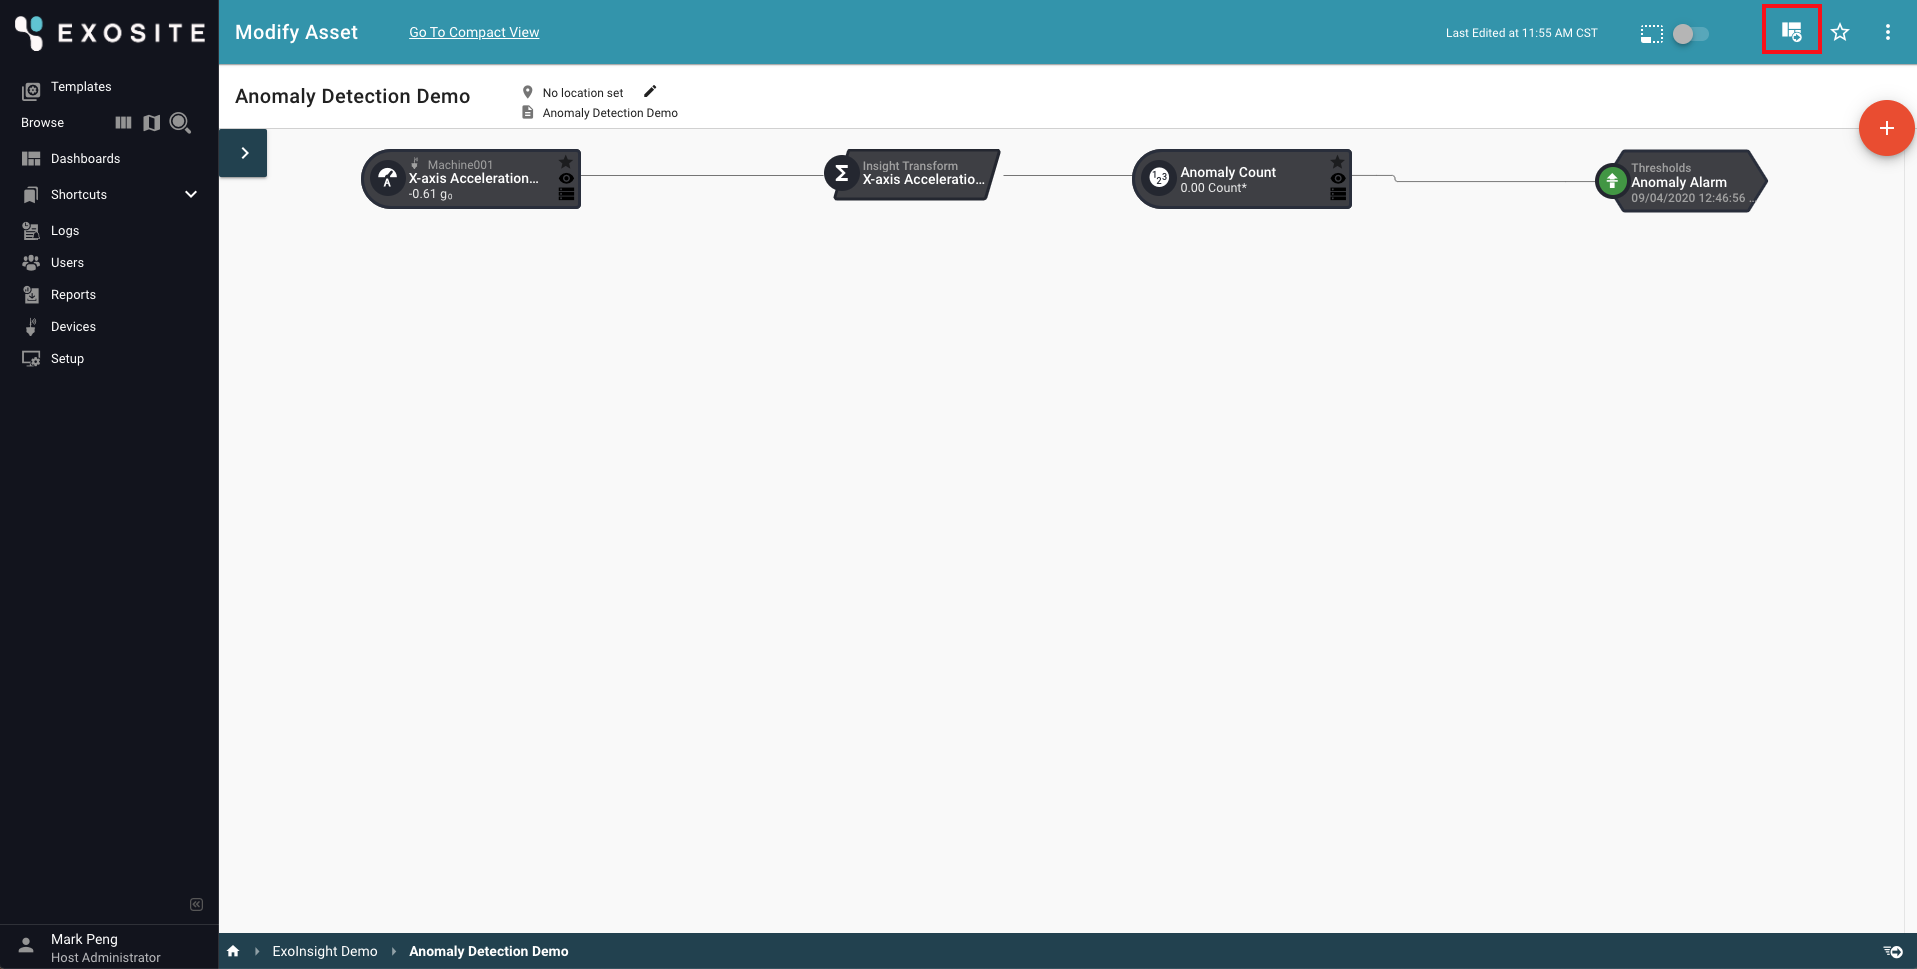
Click the "View Asset Dashboard" icon on the top right side of Modify Asset pipeline page.
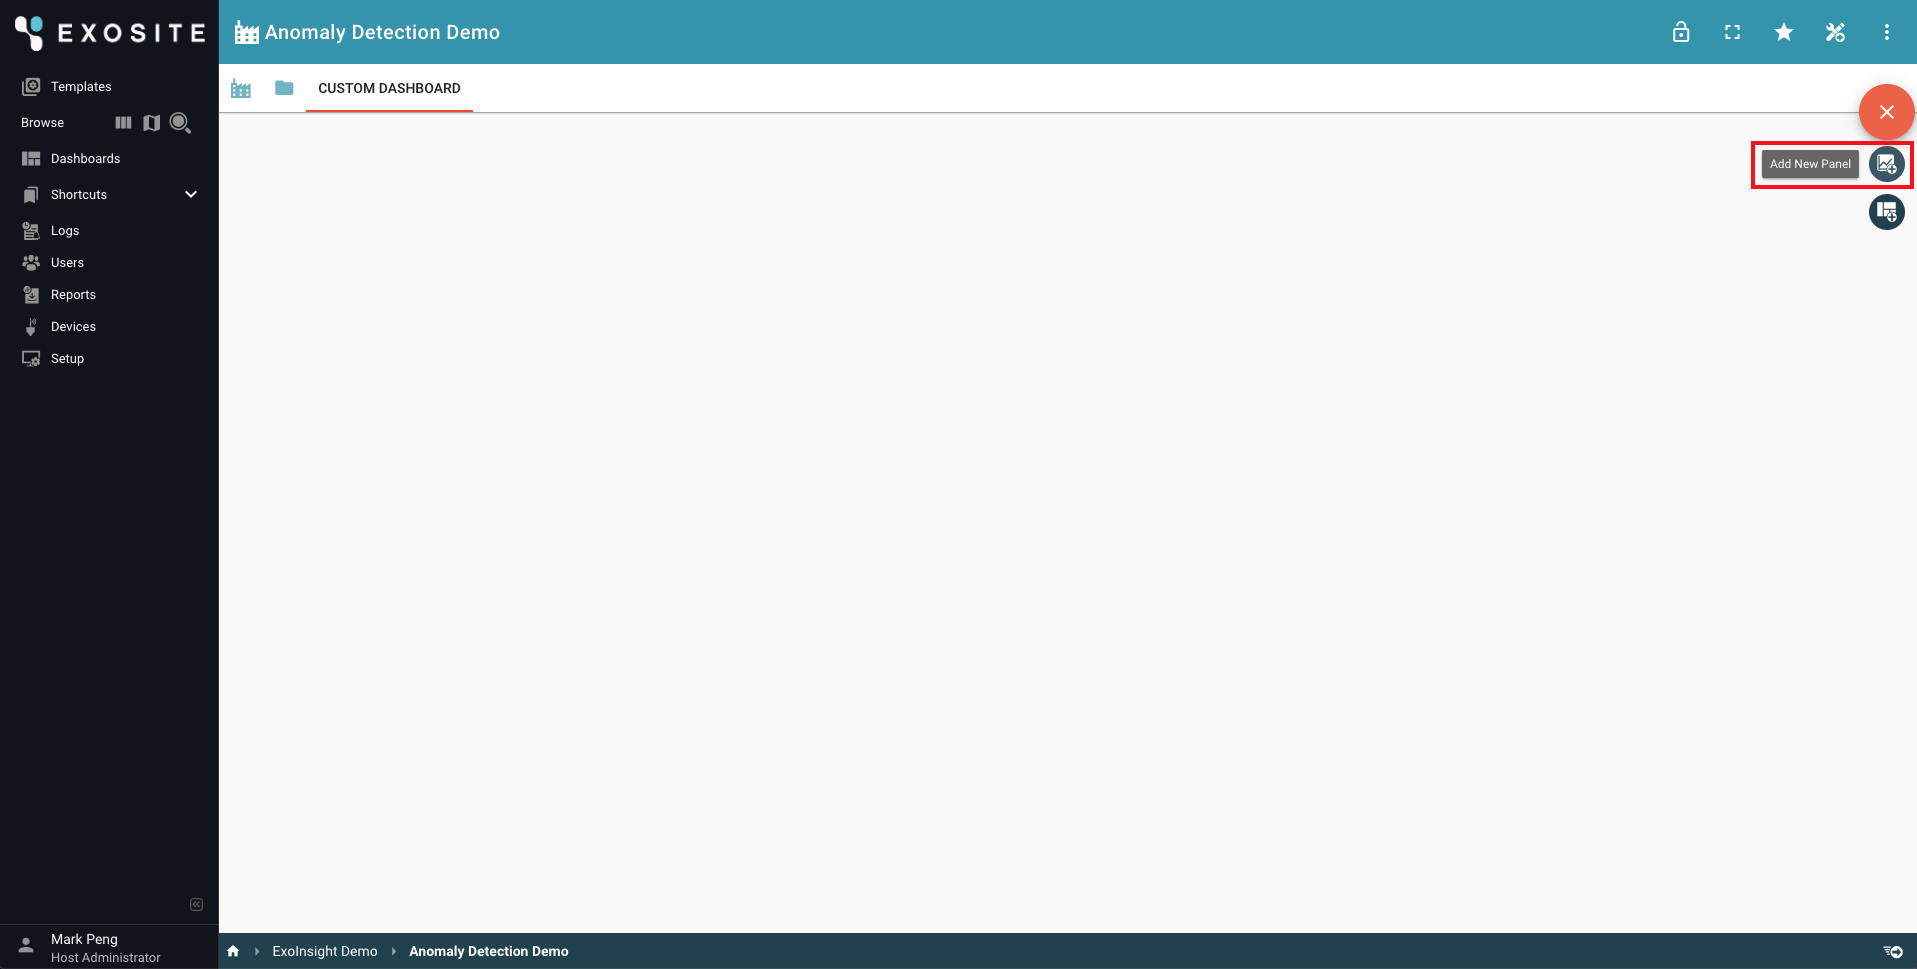
Click "Add New Panel".
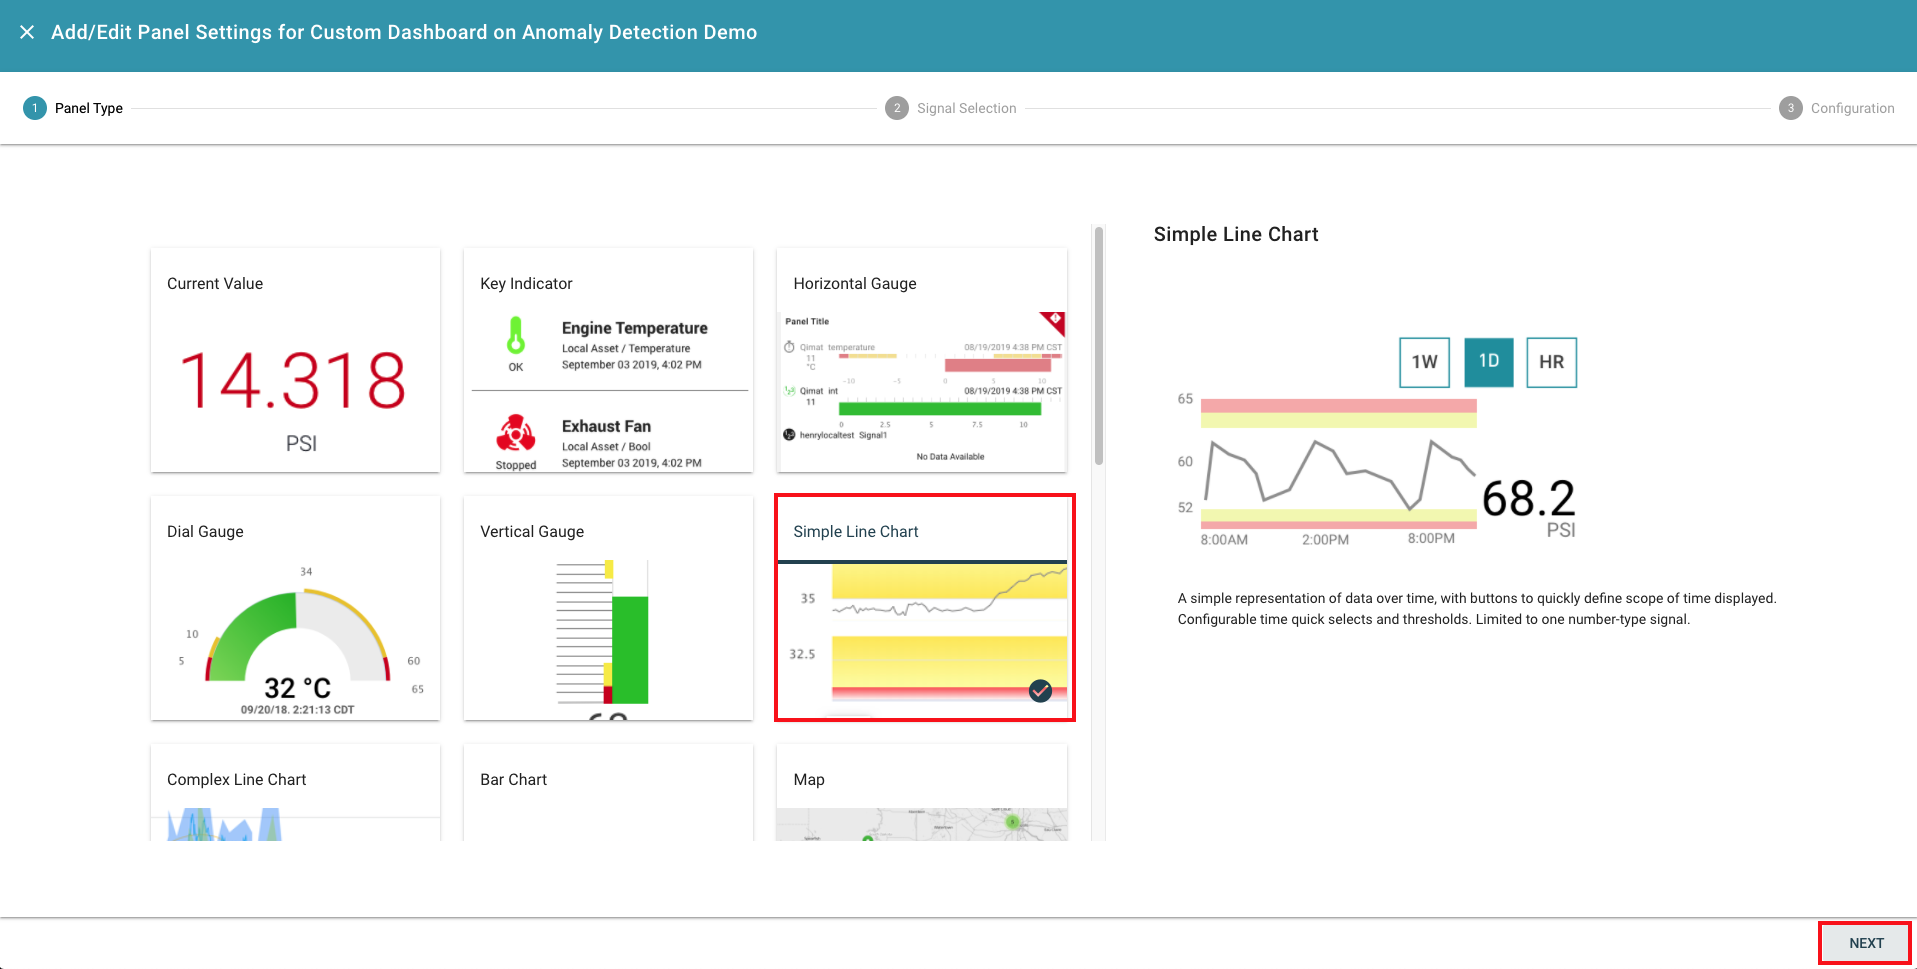
Select "Simple Line Chart" as the panel type and click "NEXT" button.

Select "X-axis Acceleration RMS - Left" signal and click "NEXT".
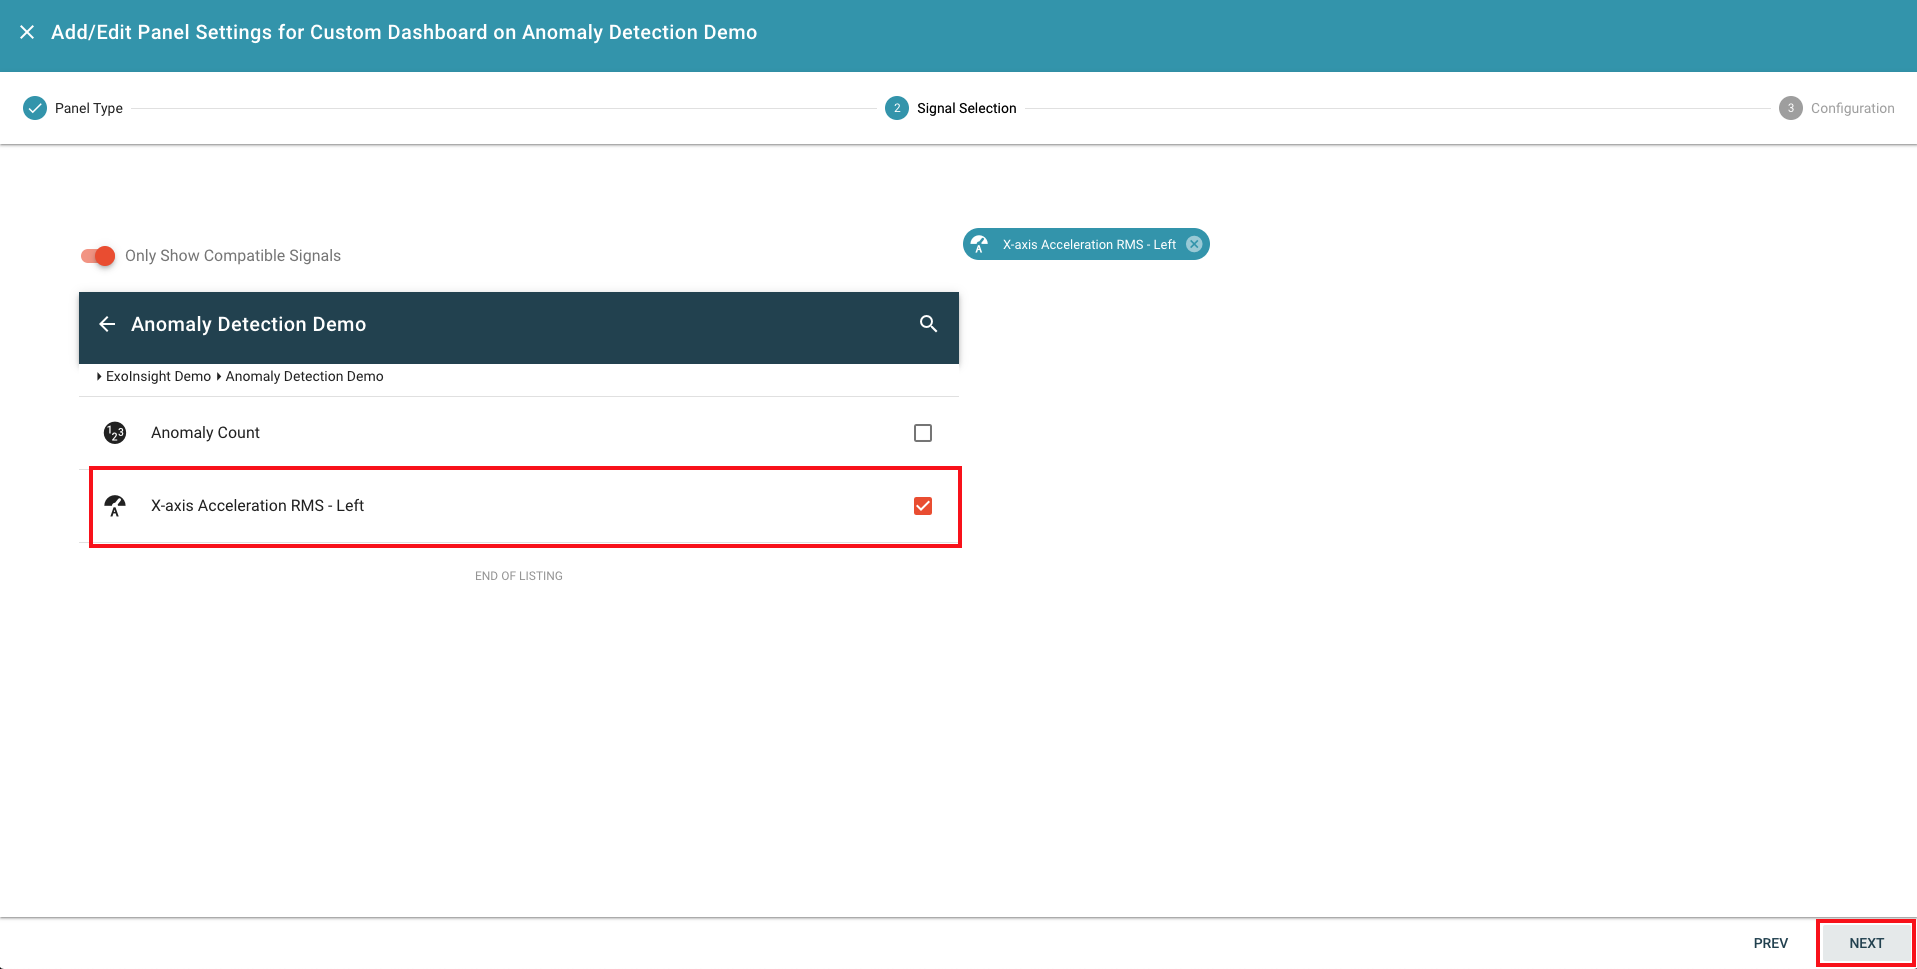
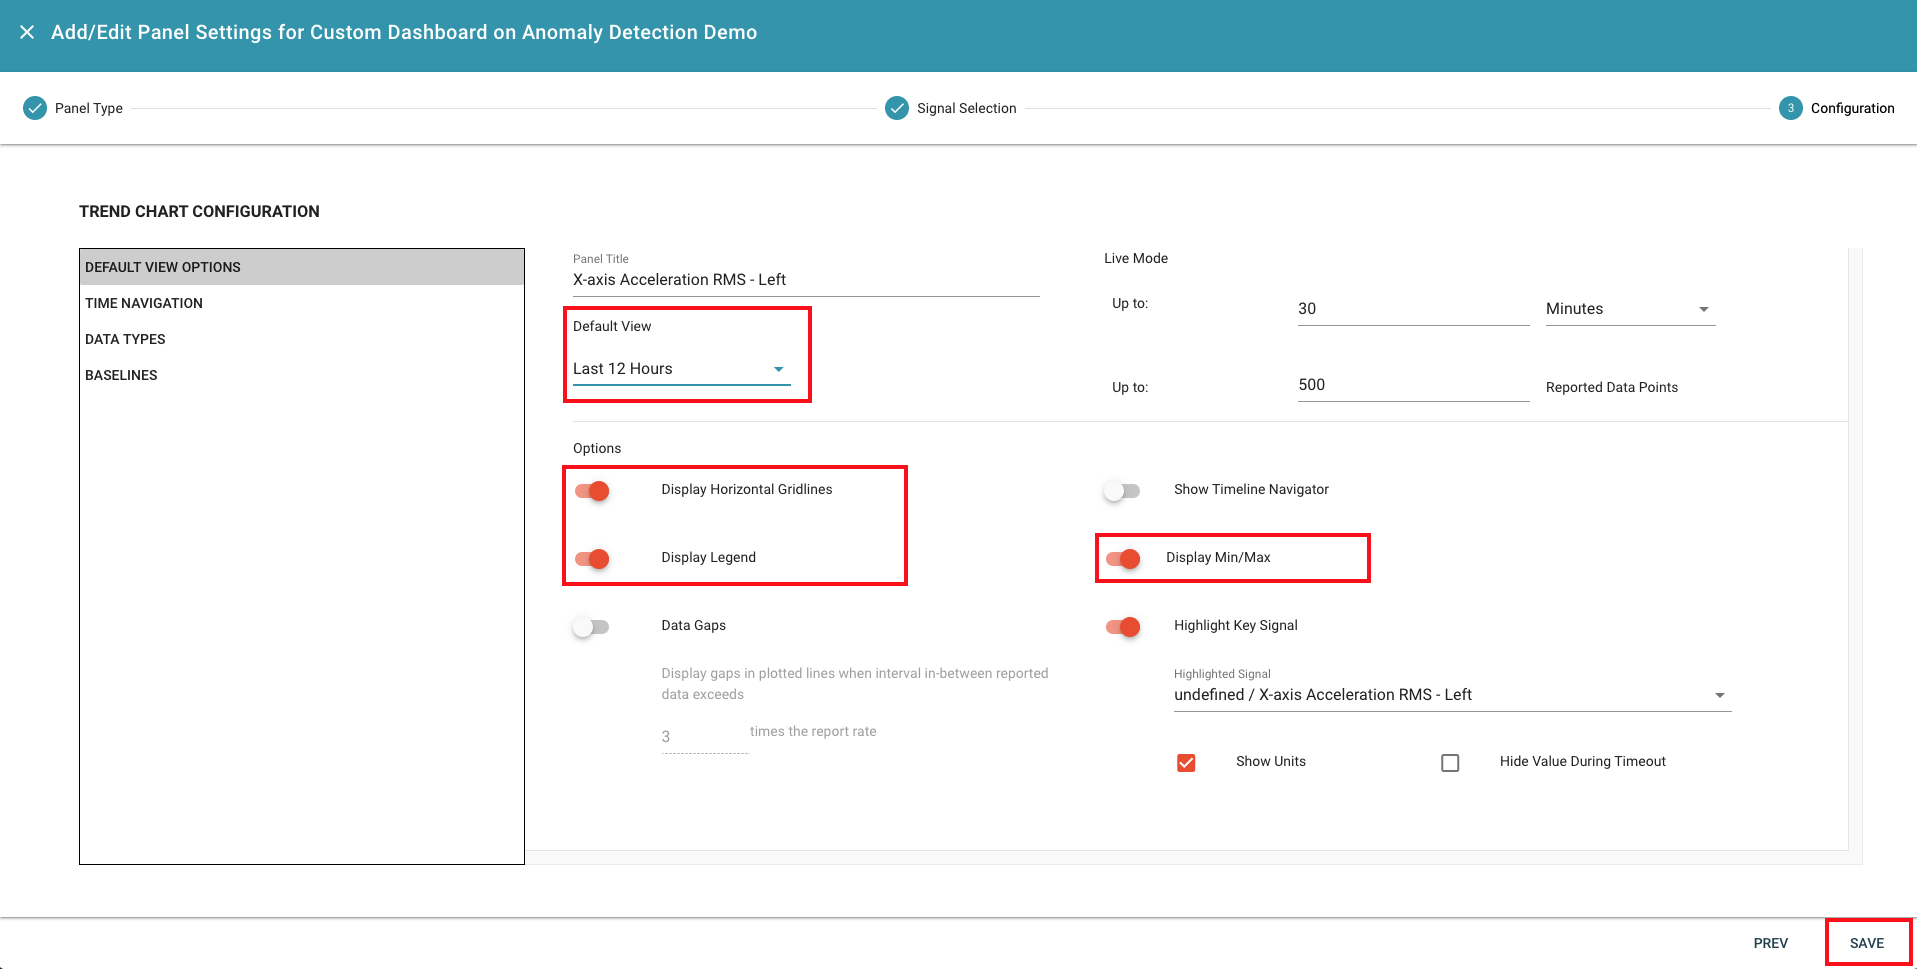
Change default view to "Last 12 hours", enable options for "Display Horizontal Gridlines", "Display Legend", "Display Min/Max" , and click "SAVE" button to create the line chart panel.
Add Line Chart for the Count of Detected Anomalies
Select "Simple Line Chart" as the panel type and click "NEXT" button.
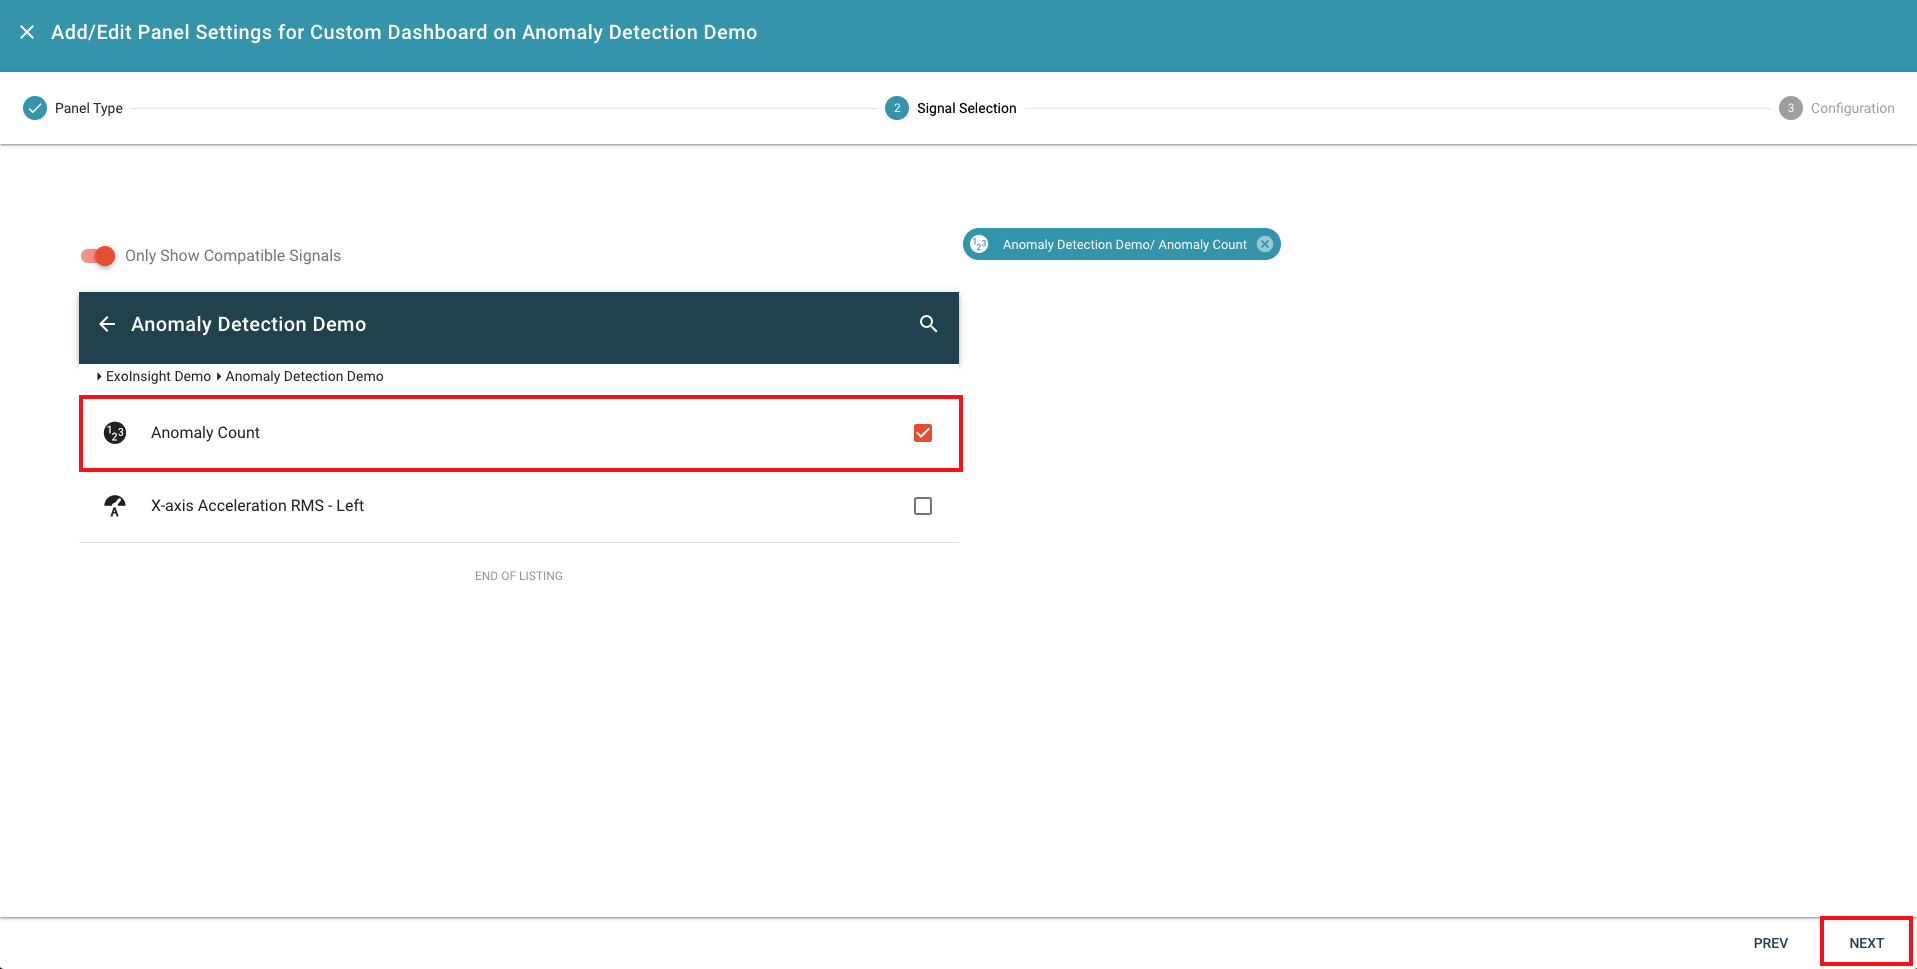
Select "Anomaly Count" signal and click "NEXT".
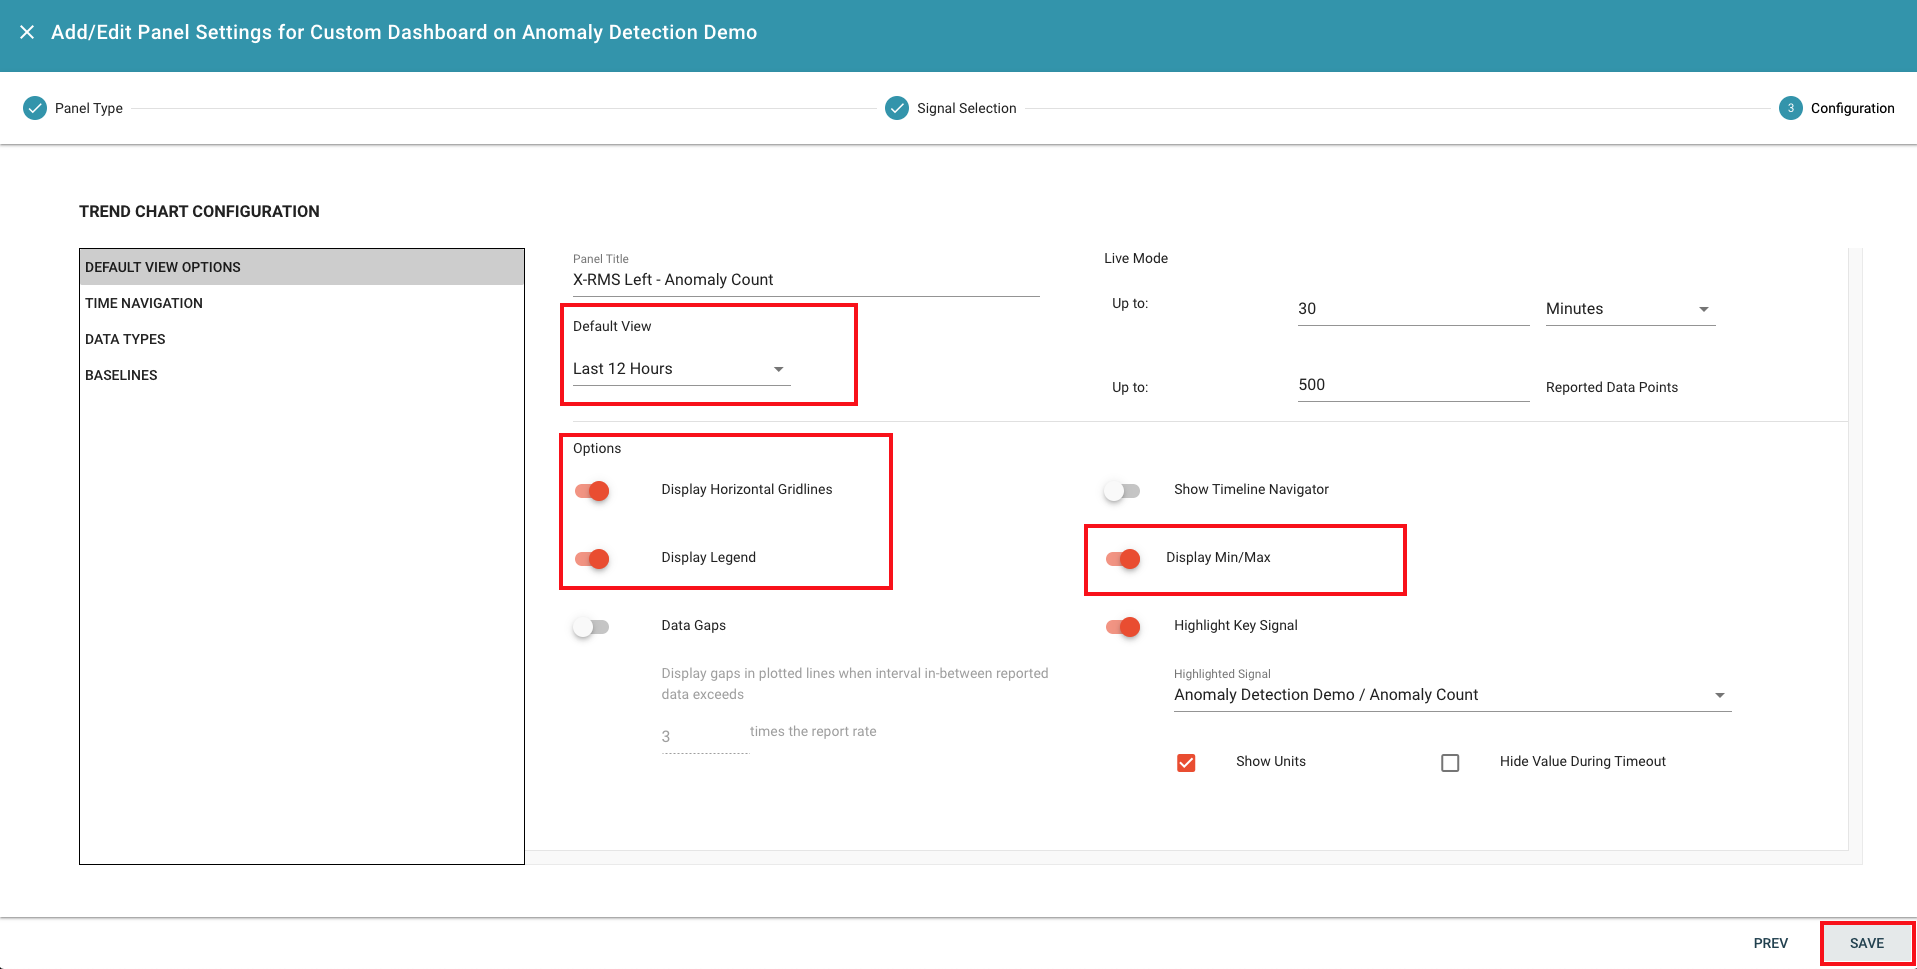
Change default view to "Last 12 hours", enable options for "Display Horizontal Gridlines", "Display Legend", "Display Min/Max" , and click "SAVE" button to create the line chart panel.
Add Vertical Gauge Plot to Show the Latest Detected Anomaly Count
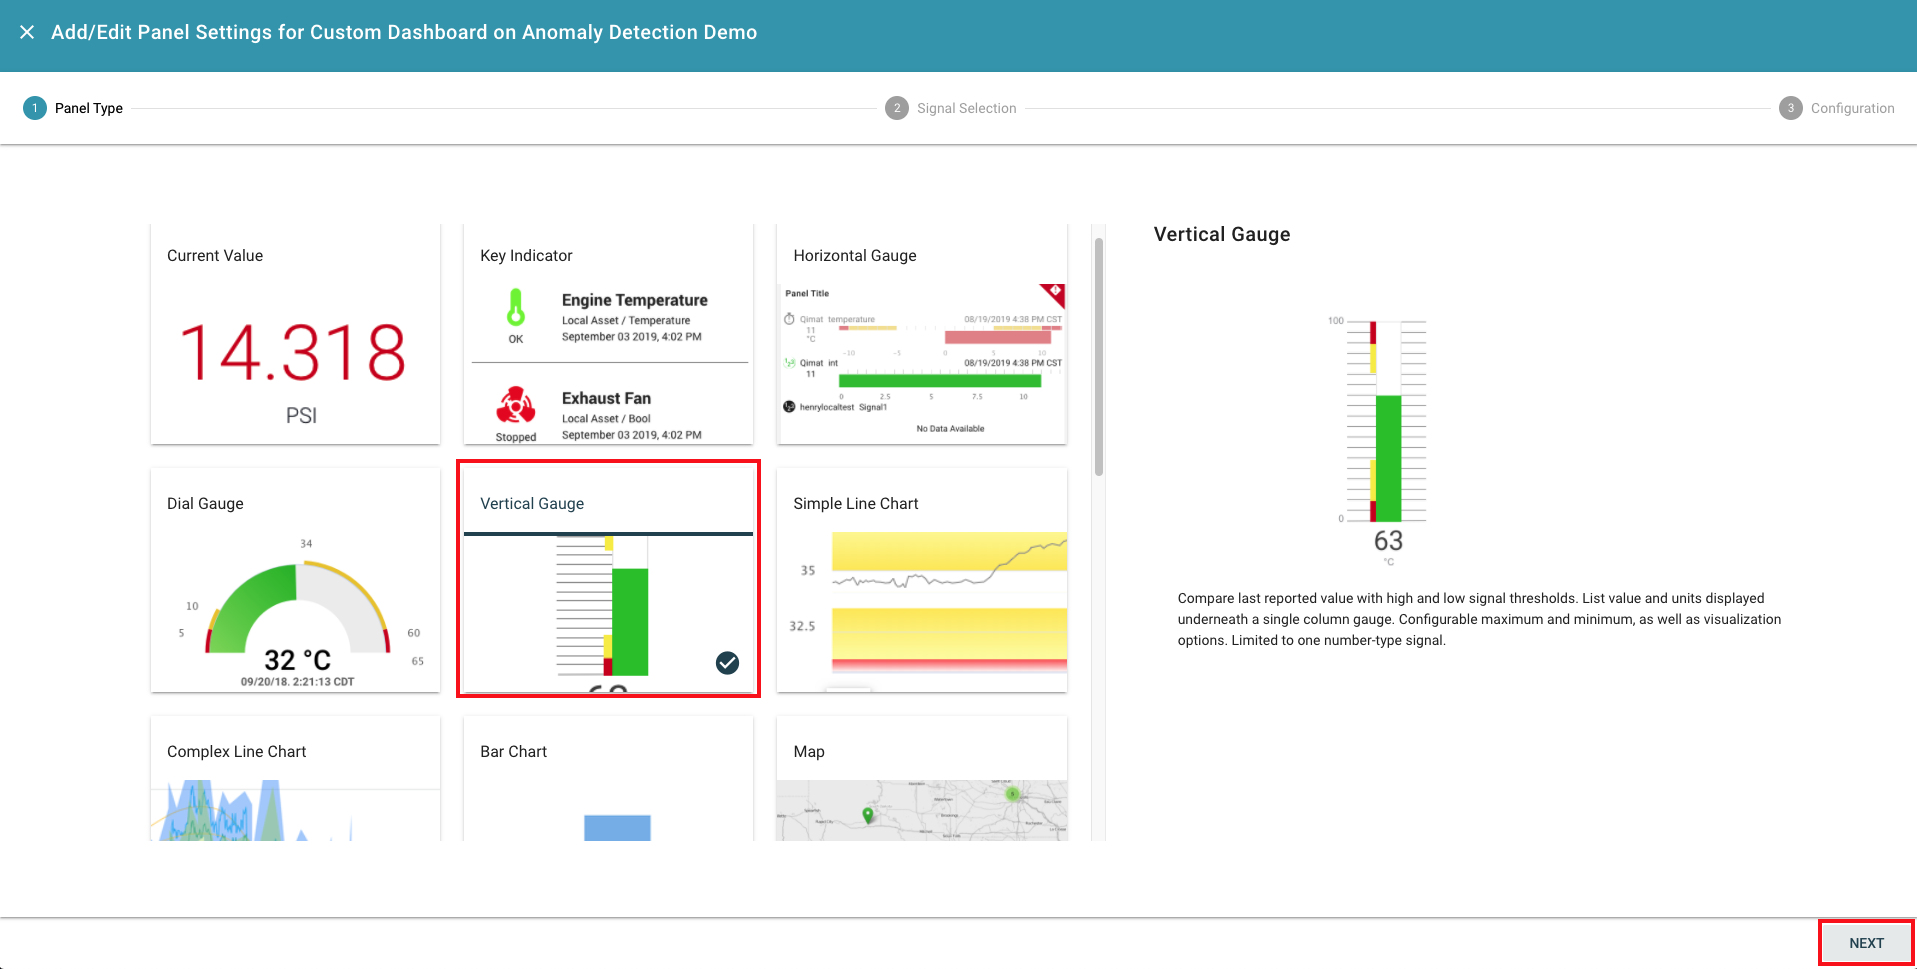
Select "Vertical Gauge" as the panel type and click "NEXT" button.
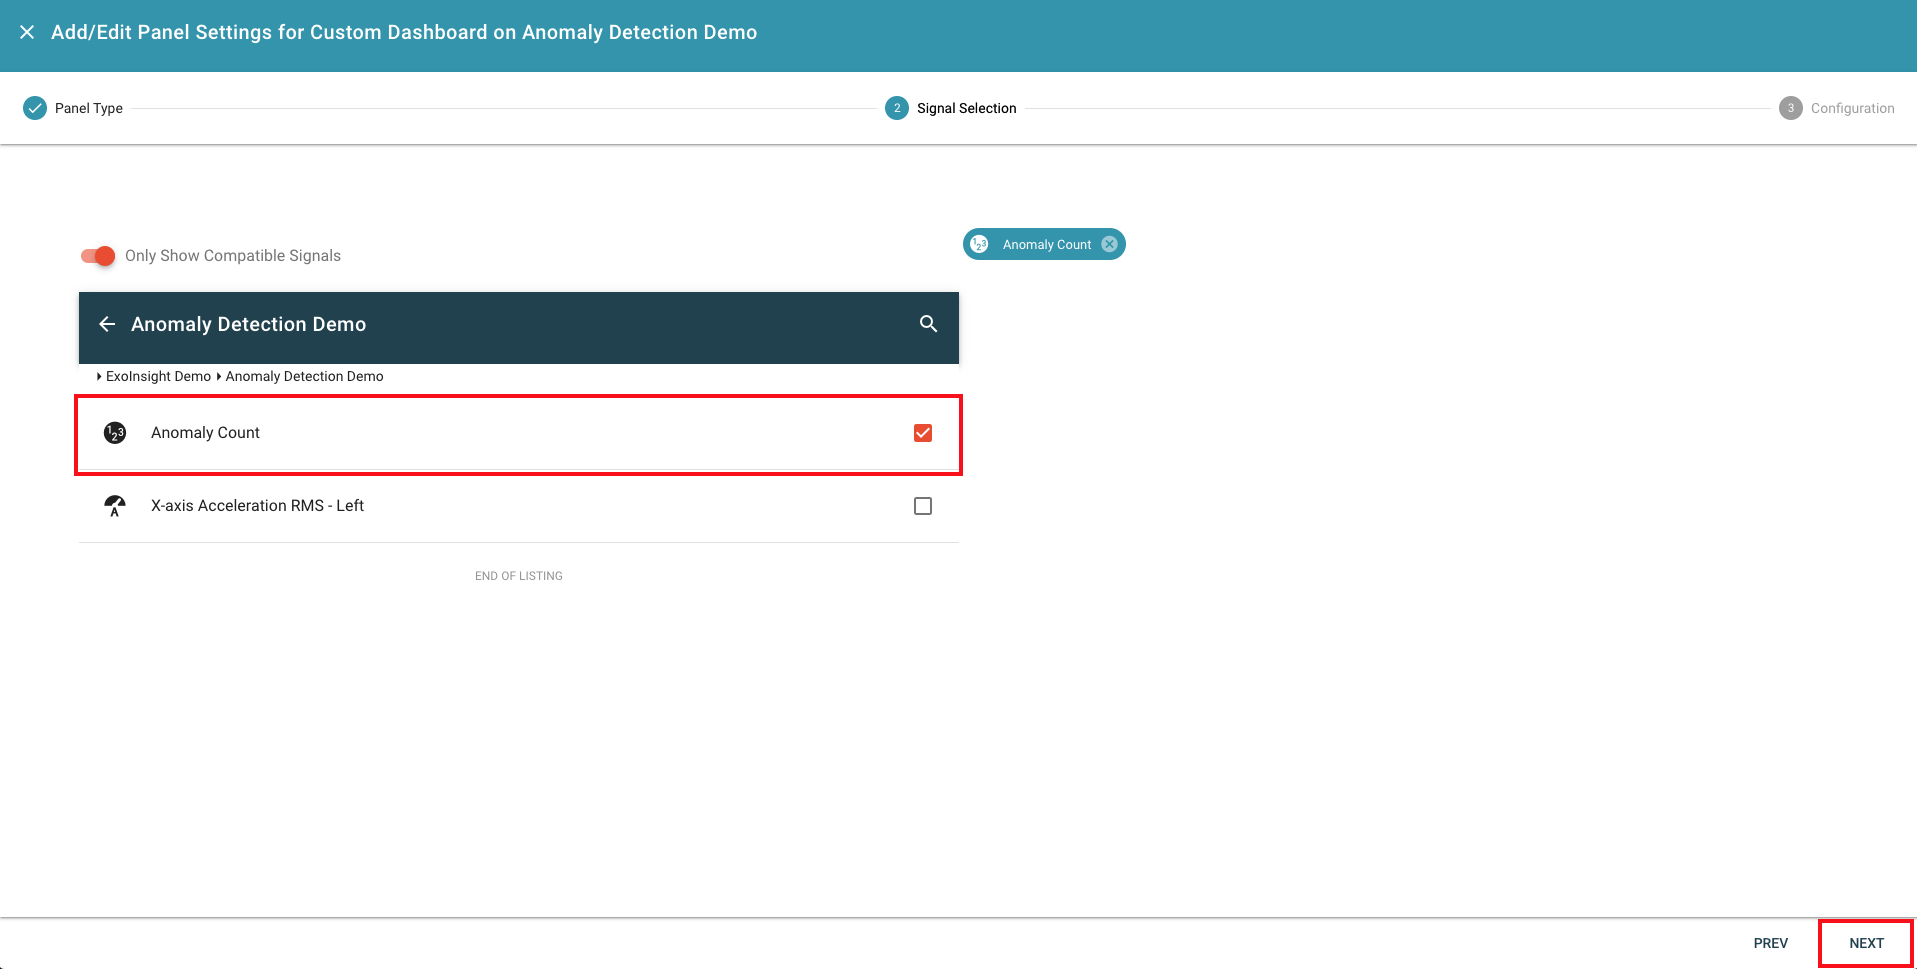
Select "Anomaly Count" signal and click "NEXT".
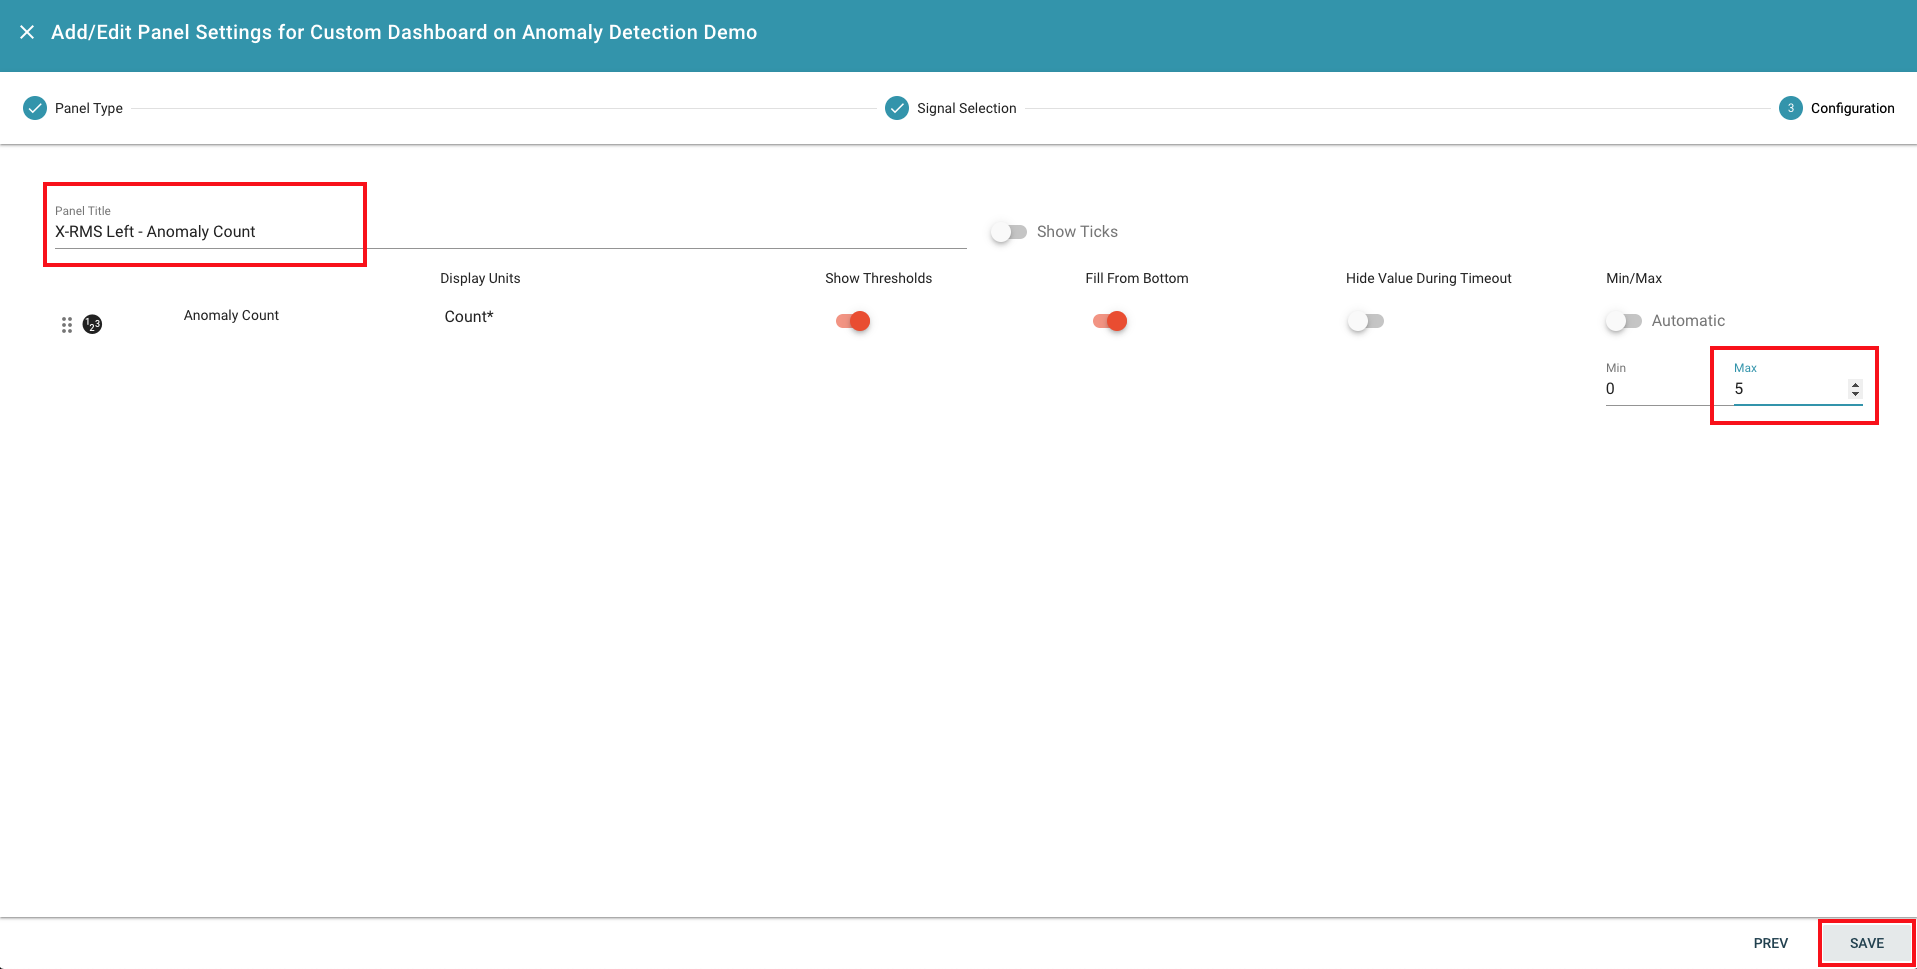
Type "X-RMS Left - Anomaly Count" as the panel title, and change the Maximum to 5. After that, click "SAVE" button to create the gauge plot.
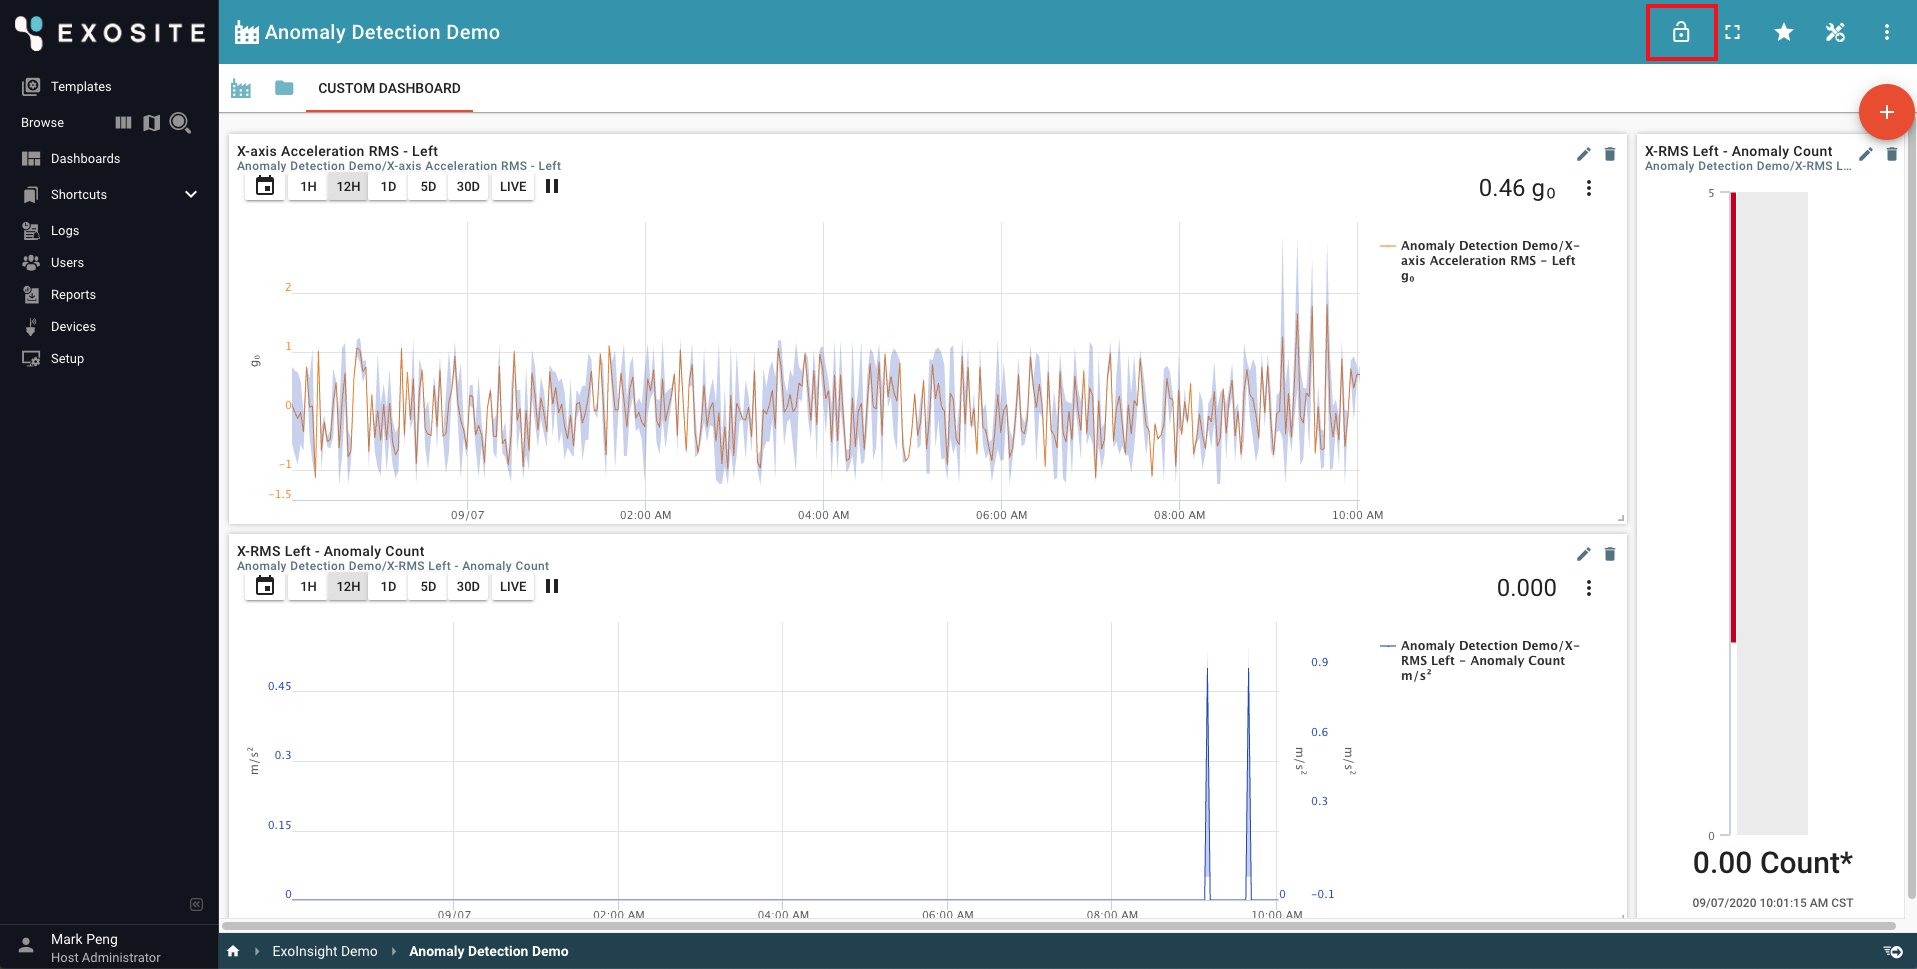
After creating the above three panels, click on the lock button to save them to the dashboard.
Trigger Accelerometer Spikes from a IoT Device
Now, try to generate some vibrations on the IoT device as some anomalies from accelerometers. Based on our recent_window settings of anomaly detection, it should be able to detect anomalies in 2-3 minutes, and would display the value spikes and detection counts on the dashboard panels.
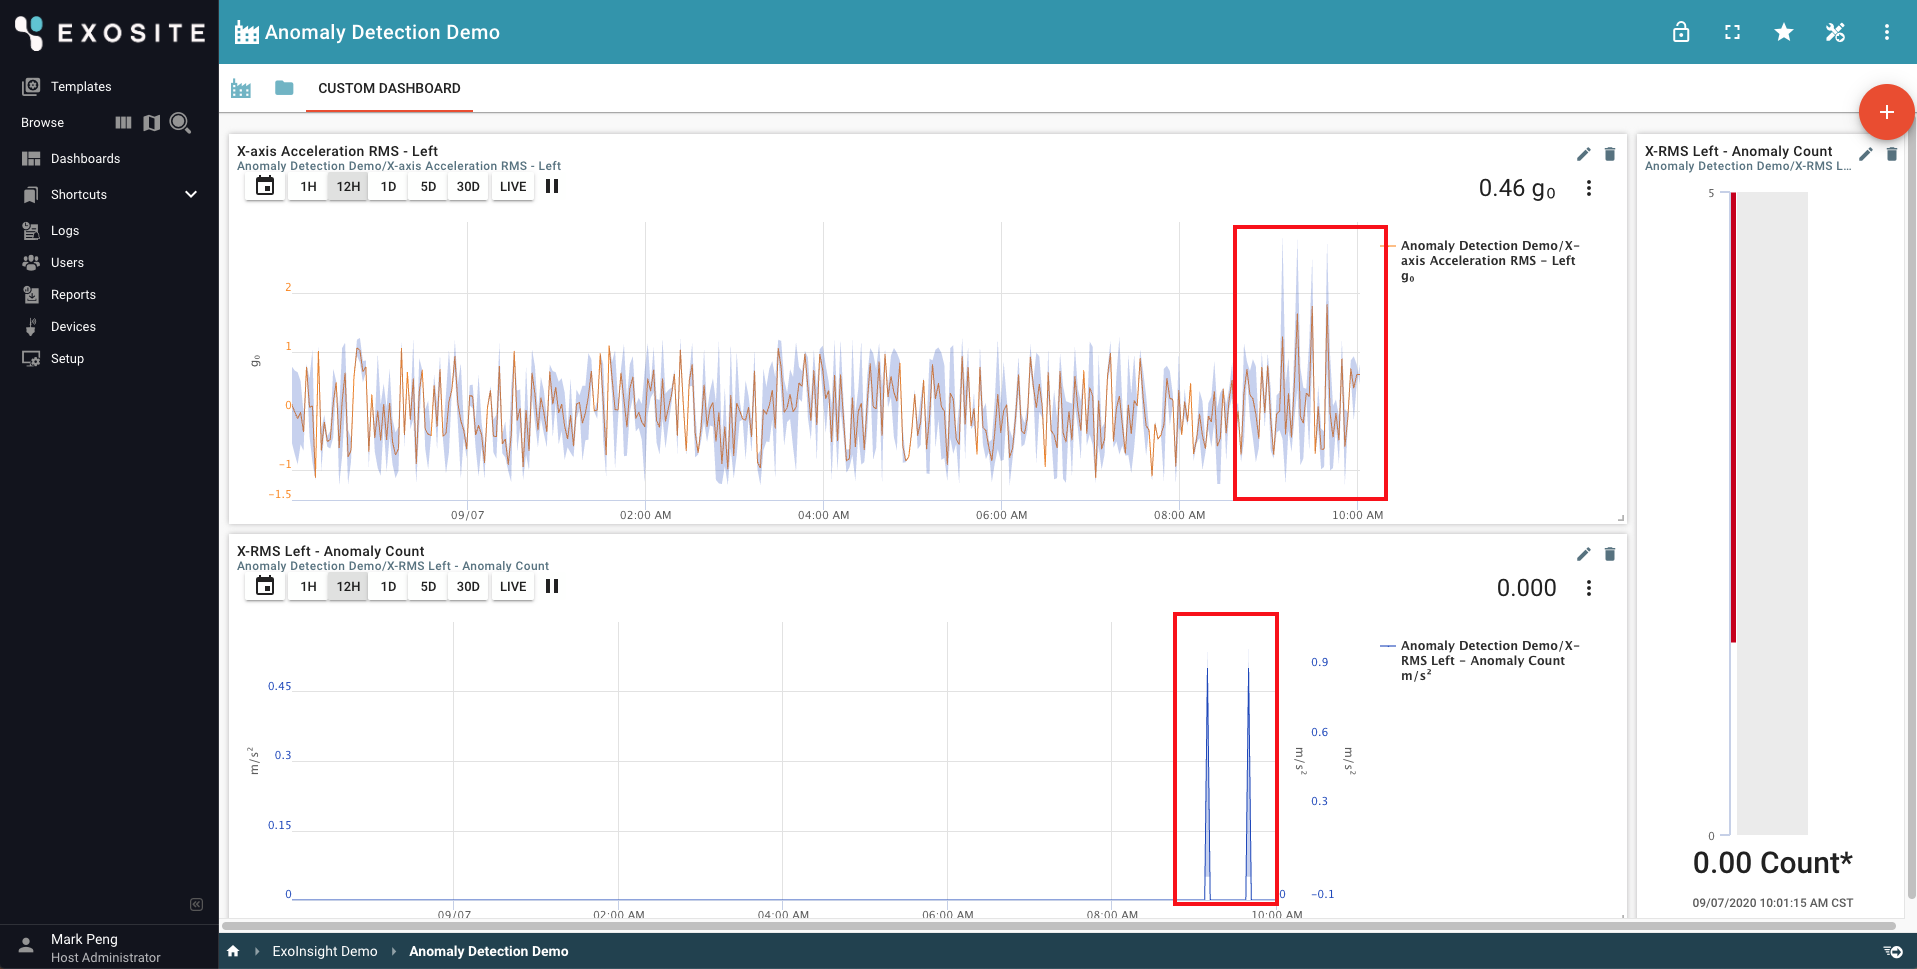
Show Detected Anomaly Count from Dashboard
Example screenshot is shown as follows.
A zoom-in version:
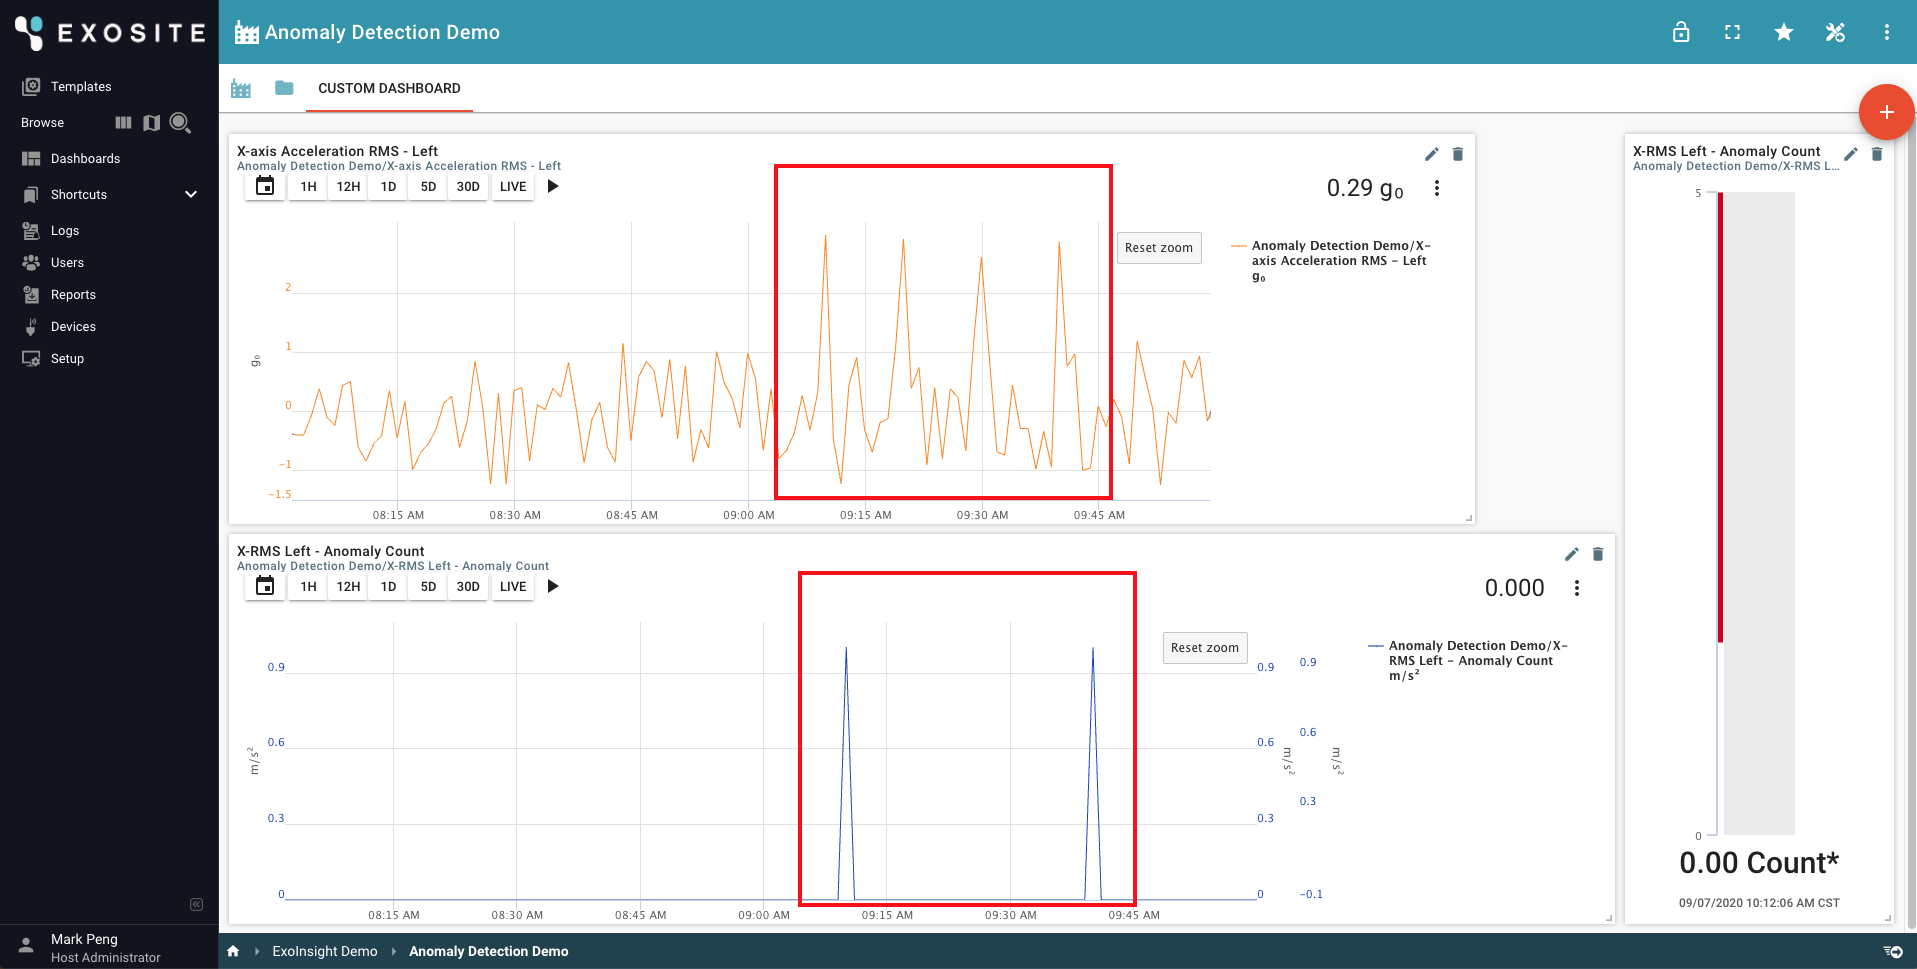
Detected anomaly counts would align with the spike event time on the line chart of X-axis accelerometer. Vertical gauge also shows the latest count of anomalies.