Boon Logic Amber Analytics Insight
Overview
Boon Logic's Amber™ platform is the first scalable, autonomously configuring, real-time unsupervised learning product for predictive maintenance and condition monitoring.
Amber™ is powered by the fastest unsupervised Machine Learning (ML) algorithm in the World, the Boon Nano, which quickly and autonomously learns the normal behavior of each individual Asset in your environment. Each Asset-specific model can identify anomalous activity with extreme precision and near 100% accuracy. Amber’s high-level insights allow your operators to know exactly when maintenance is needed, reducing downtime and preventative maintenance costs.
Leverage as an ExoSense™ Transform
The Amber Analytics Insight is an ExoSense™-compatible third-party Insight Module that implements patent-pending unsupervised machine learning methods capable of detecting anomalies from any individual or multi-sensor data stream in real-time.
Capability Highlights
- Automatic tuning and training
- Individual Asset-level models resulting in multiple analytic outputs
- Early detection of anomalous behavior to inform predictive maintenance needs
- Scalable and applicable to diverse kinds of signals
- Removes reliance on limited human experience to set proper alarm thresholds
Trial Access
This is provided for trial purposes, please contact Exosite for volume pricing
Outputs
The following table details the Signals and data generated by the Amber Analytics Insight.
| Name | Description | Type | Example Output |
|---|---|---|---|
| Amber Warning (AW) | Representation of Asset "health" based on a threshold of the AM metric auto-determined in Amber (see AM in "Metrics Expanded" section below) 0: Normal, 1: Asset Changing, 2: Asset Critical The thresholds for the two warning levels are the standard statistical values of 0.95 (outlier) and 0.997 (extreme outlier) respectively Possible Values: 0, 1, 2 | Number (int) | 2 |
| Metrics | Additional analytic metrics & metadata (see "Metrics Expanded" section below) | JSON | |
Note
The above two outputs are generated as new Signals with their own dedicated data streams. See below for more details on what is included within the Metrics object.
Metrics Expanded
| Key | Description | Type | Possible Values | Example Value |
|---|---|---|---|---|
| state | Current state of processing | String | Buffering, Autotuning, Learning, Monitoring | Monitoring |
| message | When present, additional context about the current state | String | . . . | Reinitializing |
| progress | Highest percent completion among all possible graduation requirements (see "Configuration Parameters" section below) | Number (int) | 0 - 100 | 61 |
| retryCount | Number of restarts that occurred during Autotuning | Number (int) | 0 - 3 | 1 |
| clusterCount | Number of unique clusters of patterns identified within the model | Number (int) | 0 - {Max Clusters} | 47 |
| totalInferences | Total number of complete samples (inferences) analyzed in the life of the sensor | Number (int) | 0 - infinity | 271845 |
| error | Context regarding any processing error that may have occurred | String | . . . | There must be at least 10 patterns for autotuning |
| SI | Smoothed Anomaly Index, the output of an edge-preserving exponential smoothing filter applied to the raw anomaly indexes of successive patterns With respect to the data seen before, values closer to 0 represent ordinary patterns and values closer to 1000 represent novel - potentially even anomalous - patterns | Number (int) | 0 - 1000 | 382 |
| AD | Anomaly Detection, a binary (boolean) result based on a threshold of the SI metric auto-determined in Amber | Number (int) | 0 or 1 | 0 |
| AH | Anomaly History, a rolling sum of Anomaly Detections over "recent history" (length based on {Samples to Buffer} - see "Configuration Parameters" section below) | Number (int) | 0 - {Samples to Buffer} | 7 |
| AM | Amber Metric, indicates extent to which an unusually high number of anomlaies have occurred in recent history (based on AH) The values are derived statistically from a Poisson model, with values closer to 0.0 and 1.0 respectively signaling a lower and higher frequency of anomalies than usual | Number (float) | 0.0 - 1.0 | 0.31275 |
| ID | Cluster ID, cluster into which the given input pattern is assigned | Number (int) | 0 - {Max Clusters} | 16 |
Tip
Custom Inline Insights can be used to split one or more of the above Metrics into their own dedicated Signal stream(s).
Configuration Parameters
The following table summarizes a list of configuration parameters for the Amber Analytics Insight.
| Parameter | Description | Single Sensor | Pre-Fused (Fusion) | Example Value |
|---|---|---|---|---|
| Feature Count | Number of sensor data components included in each sample | Default: 1 Min: 1 Max: 1 | Default: 1 Min: 1 | 8 |
| Streaming Window Size | Indicates the number of successive samples to use in creating overlapping patterns Example: With a Streaming Window Size of 50, each pattern clustered by the Insight is comprised of the most recent 50 samples, meaning each pattern overlaps the previous 49 samples with the latest 1 | Default: 50 Min: 1 Max: 500 | Default: 1 Min: 1 Max: 1 | 1 |
| Samples to Buffer | Number of samples to be streamed before Autotuning begins on the buffered samples Rolling window used for Anomaly History (AH) calculation Note: This must be at least 10x {Streaming Window Size}, with a general rule of thumb being to consider 200-500x | Default: 10000 Min: 50 | Default: 10000 Min: 50 | 43200 |
| Learning Rate Numerator | Component of learning graduation requirement for stopping learning See next | Default: 10 Min: 1 | Default: 10 Min: 1 | 1 |
| Learning Rate Denominator | Component of learning graduation requirement for stopping learning The ratio {Learning Rate Numerator} / {Learning Rate Denominator} determines a cluster growth "flatness" threshold During the most recent {Learning Rate Denominator} inferences, if there have been fewer than {Learning Rate Numerator} new clusters created, Learning will stop and Monitoring will begin | Default: 10000 Min: 1 | Default: 10000 Min: 1 | 1000 |
| Learning Max Clusters | Learning graduation requirement for stopping learning During the Learning phase, if the Insight reaches a total of {Learning Max Clusters} in its model, Learning will stop and Monitoring will begin | Default: 10000 Min: 1 | Default: 10000 Min: 1 | 1000 |
| Learning Max Samples | Learning graduation requirement for stopping learning During the Learning phase, if the Insight has processed a total of {Learning Max Samples}, Learning will stop and Monitoring will begin | Default: 1000000 Min: 1 | Default: 1000000 Min: 1 | 250000 |
Tips
- The Samples to Buffer configuration approximately determines which samples are available for the Autotuning state, during which the generalized Min & Max values of any feature(s) will be identified.
- The value to use may change based on the typical operating times and general behavior patterns of the target Asset.
- If historical data is available, consider reviewing the data (e.g. on a Line Chart, Data Table, etc.) to see if there are any temporal (hourly, daily, weekly, etc.) patterns.
- It is also often helpful to talk with someone who works directly with the Asset.
- For a Single Sensor stream, given the relationship among sequential time series measurements of a single feature is evaluated, the Streaming Window Size must be greater than 1.
- For a Pre-Fused (Fusion) stream, given the relationship among all features included in each sample is evaluated, a Streaming Window Size of 1 is generally sufficient.
Note
Once configuration parameters have been set for a given instance of the insight they cannot be changed. To analyze the stream with different parameters, create a new instance with the desired changes.
Setup Guide
This section walks through the setup steps for adding the Amber Analytics Insight to an Asset in your ExoSense application.
Add Amber Analytics Insight to ExoSense Application
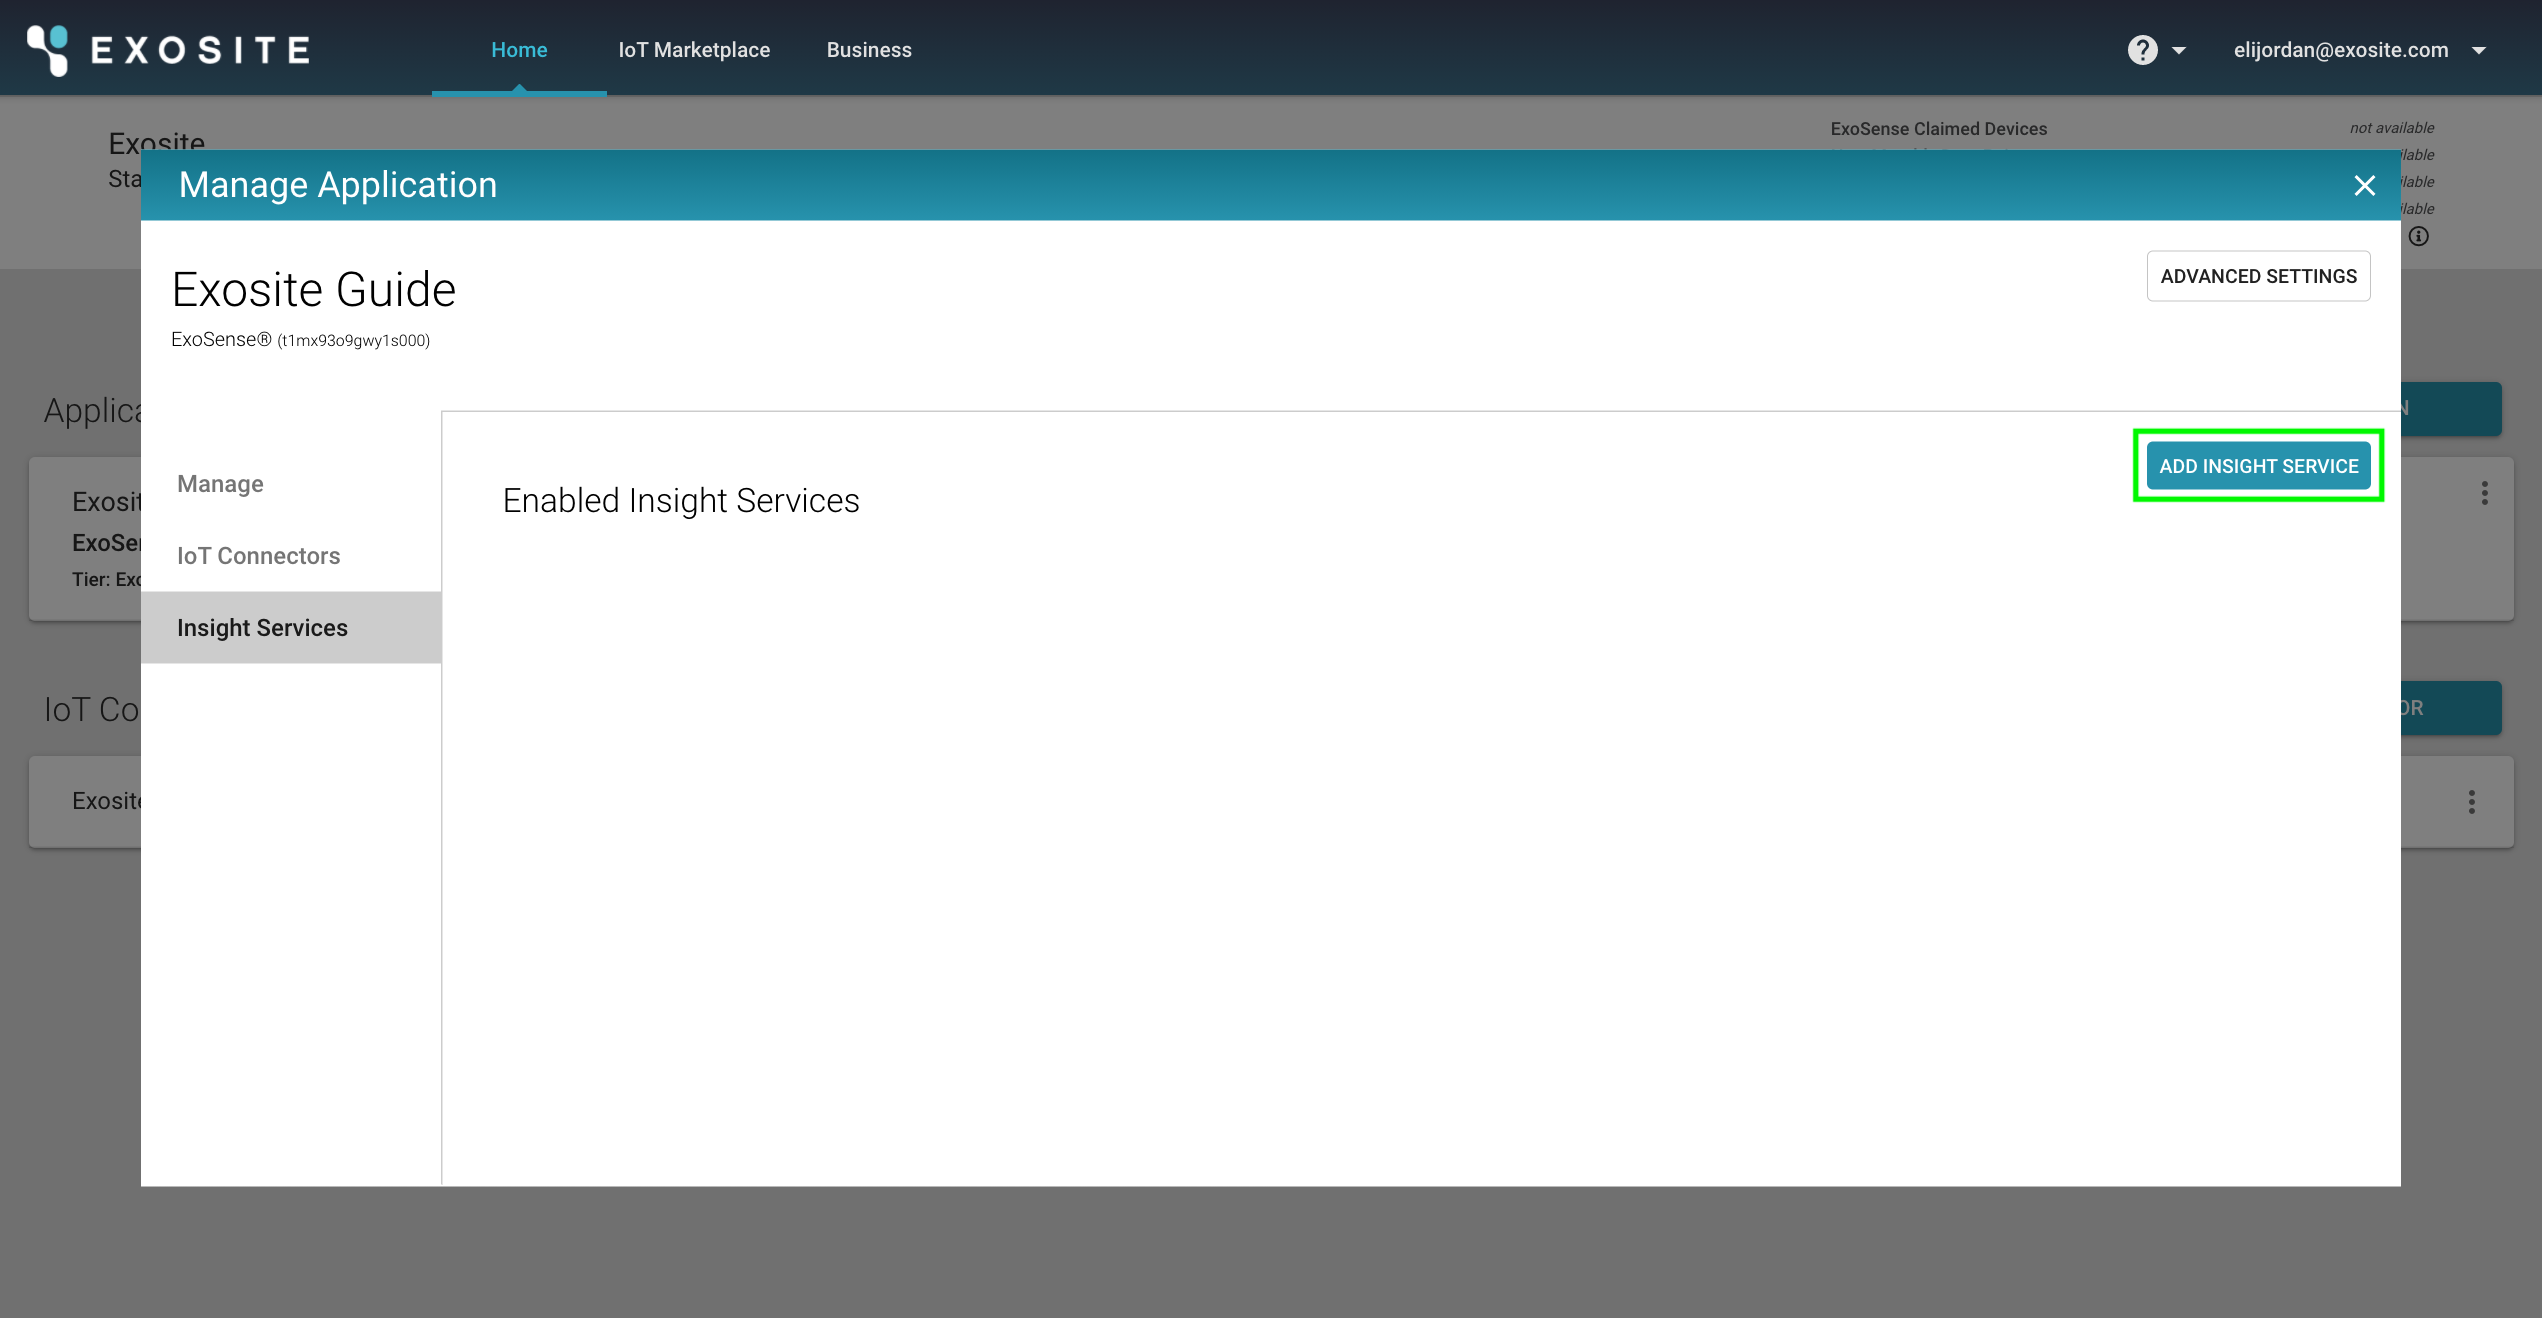
From your Business Account Home page: Select your ExoSense application, navigate to view the Insight Services added to it, and click "Add Insight Service".
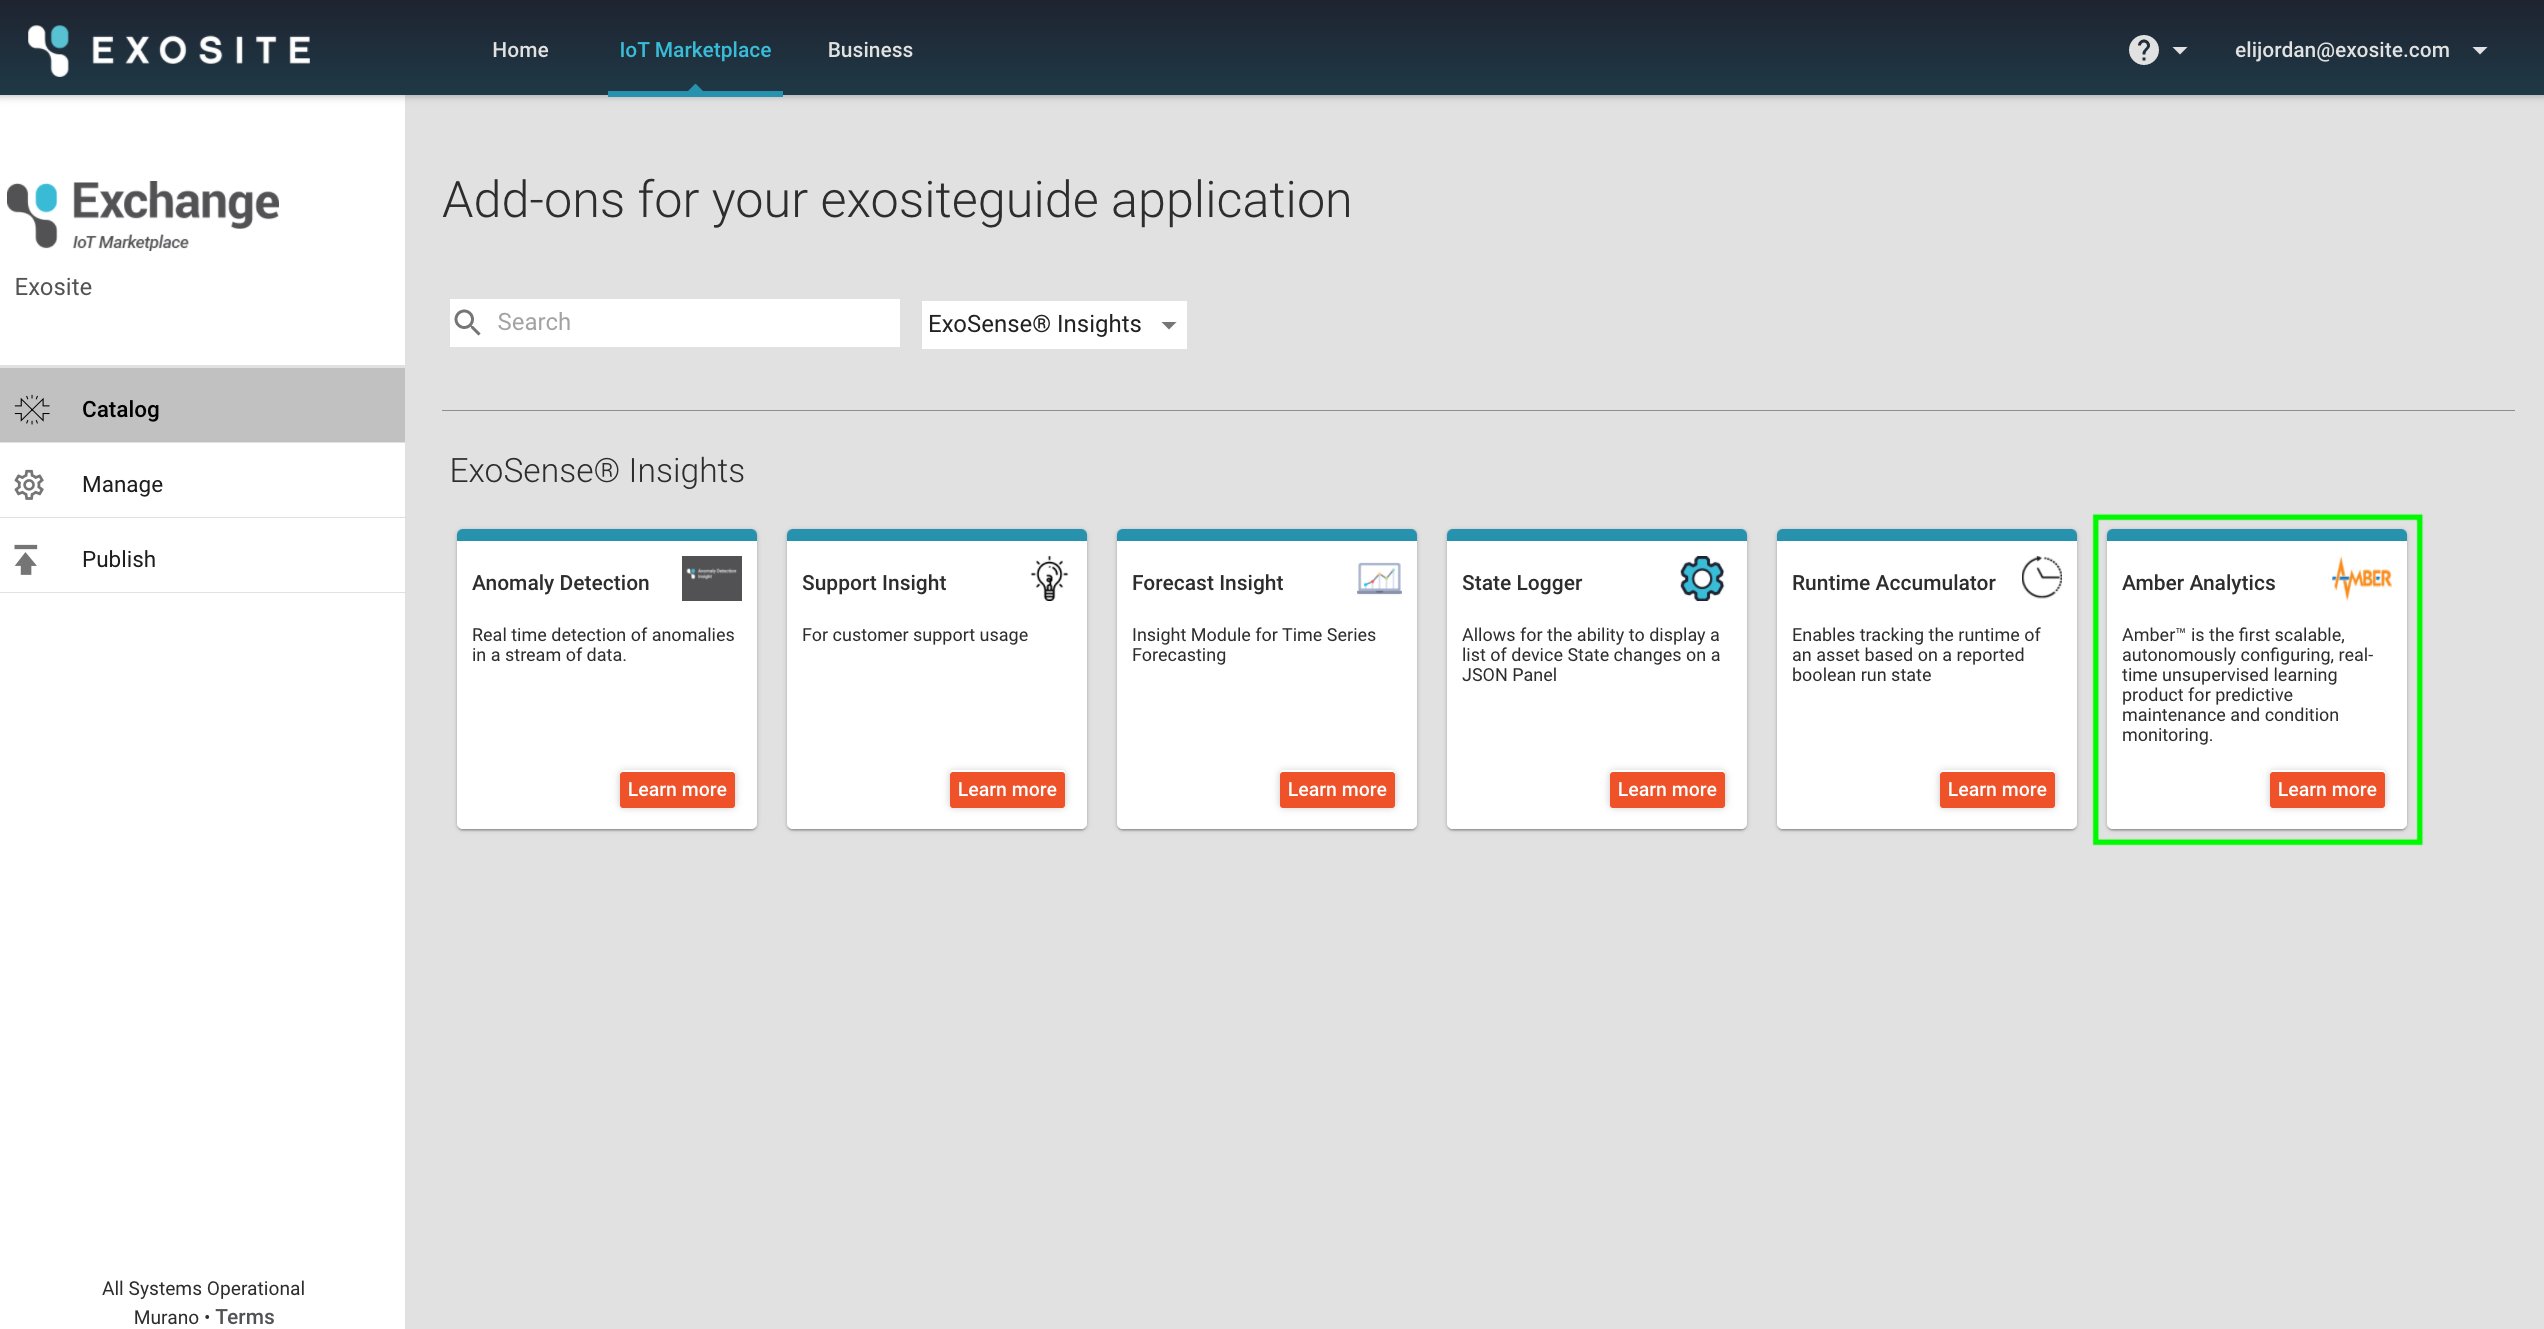
This will take you to Exosite's IoT Marketplace where you will find the Amber Analytics Insight among other available Insights. Select that element.
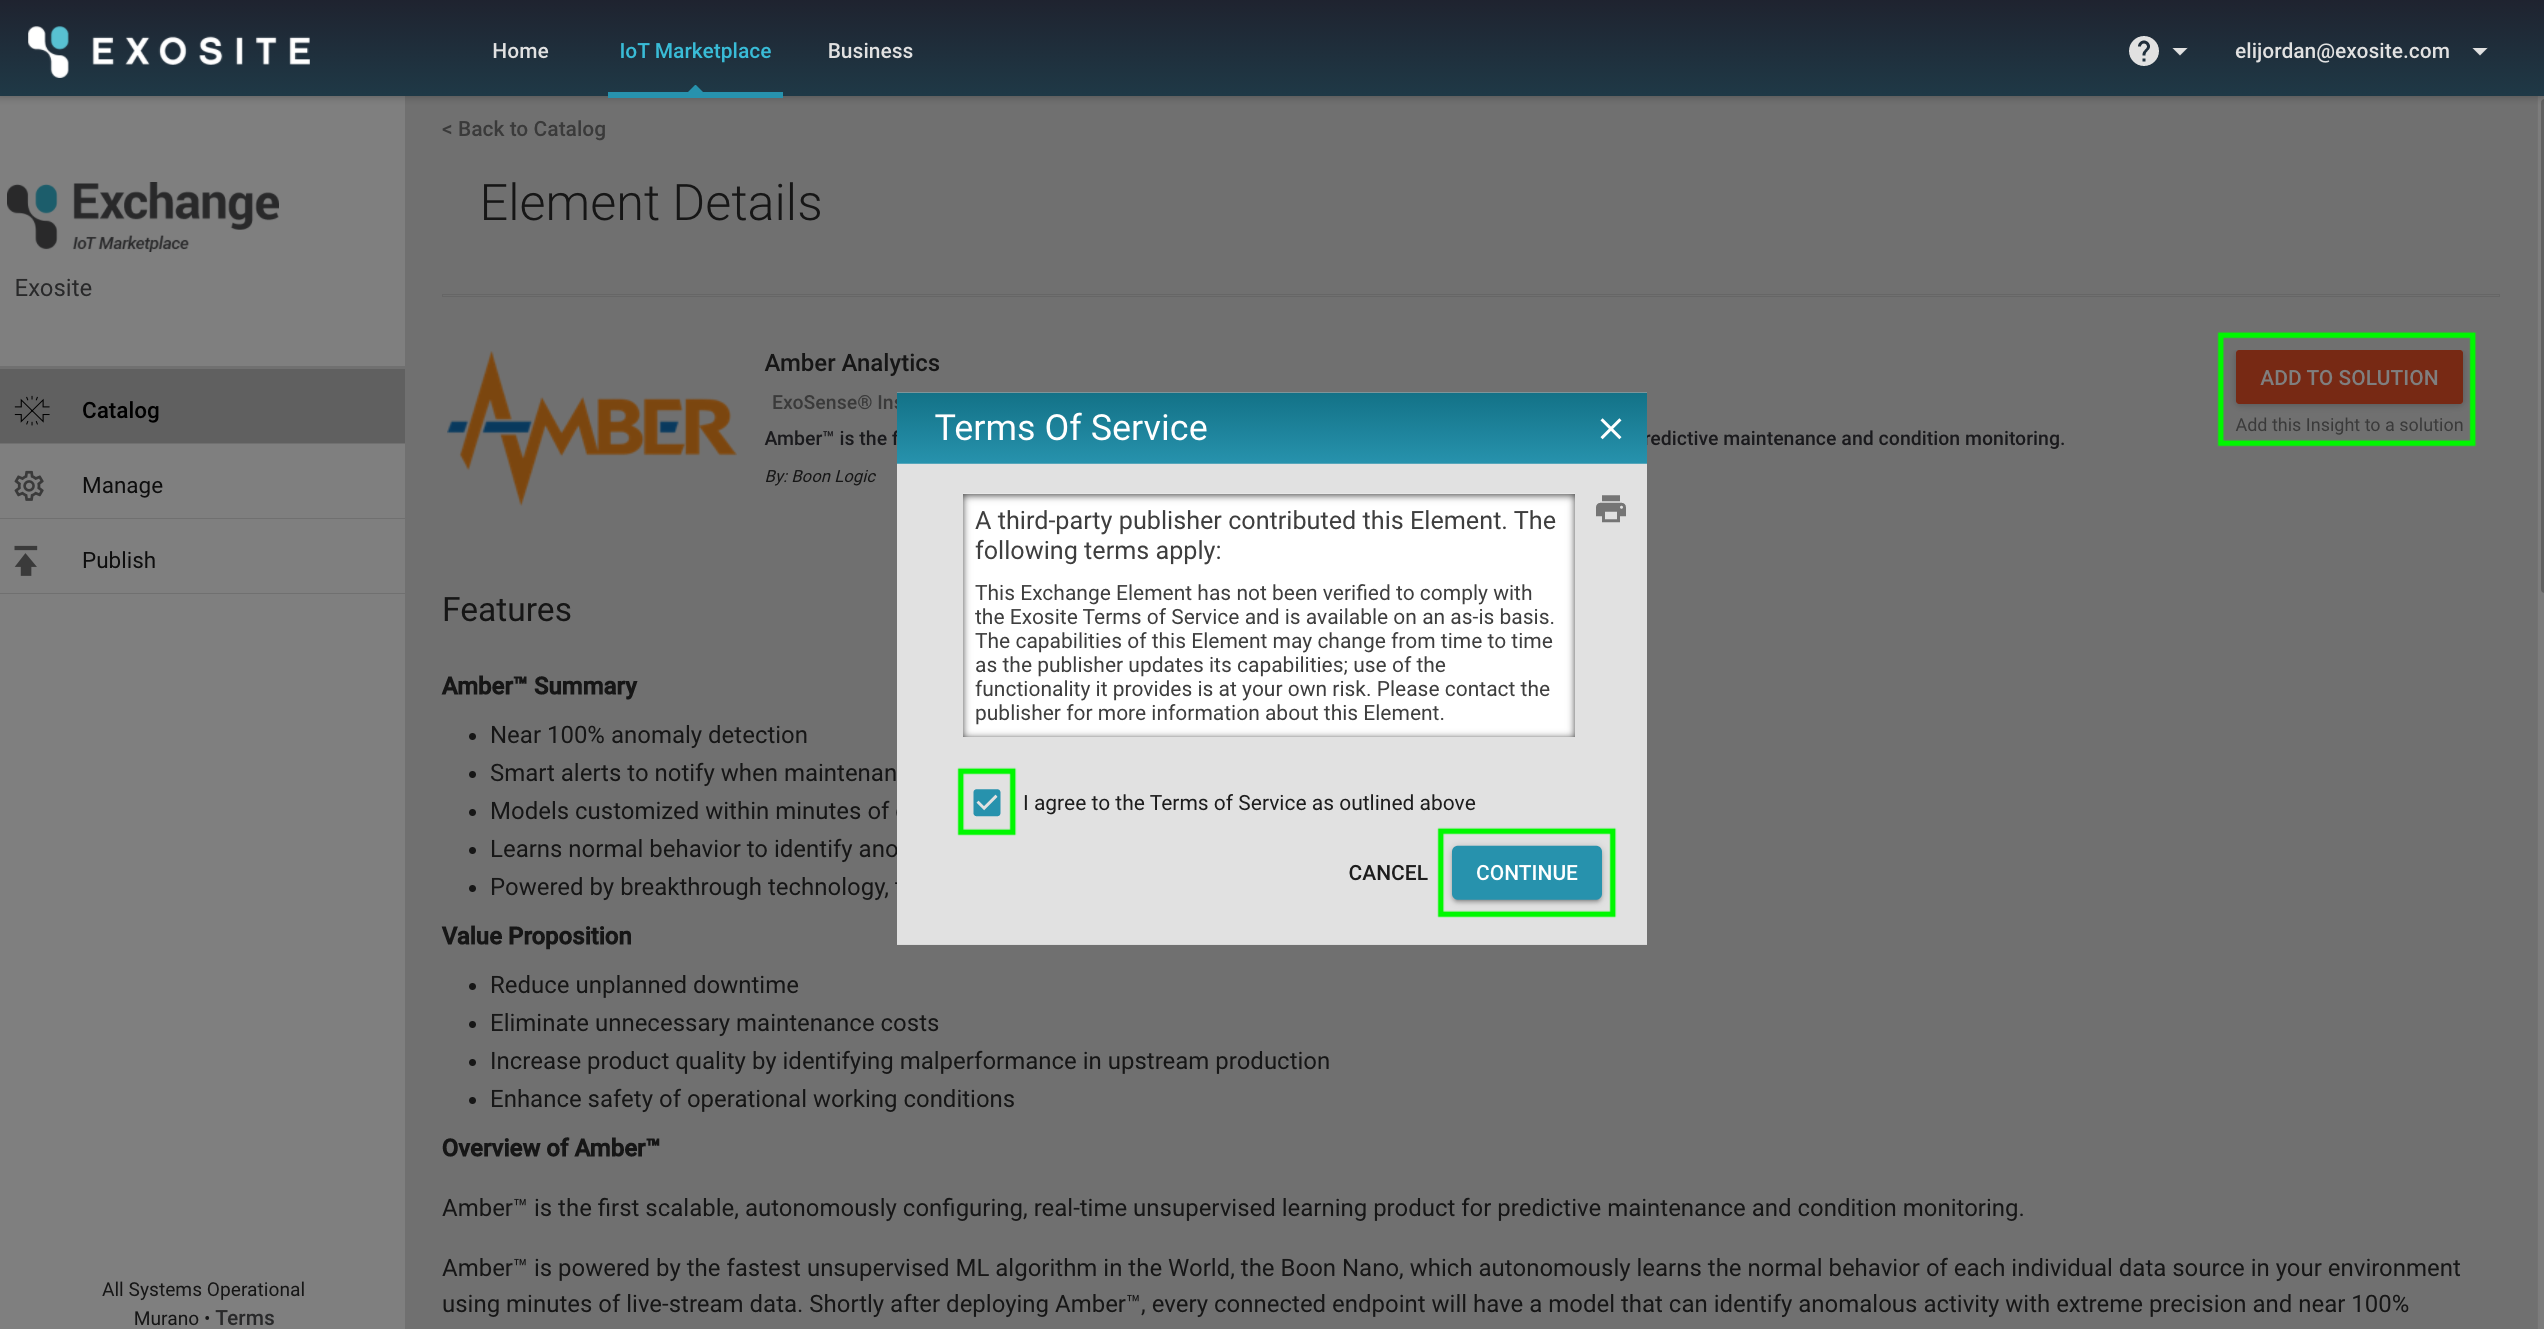
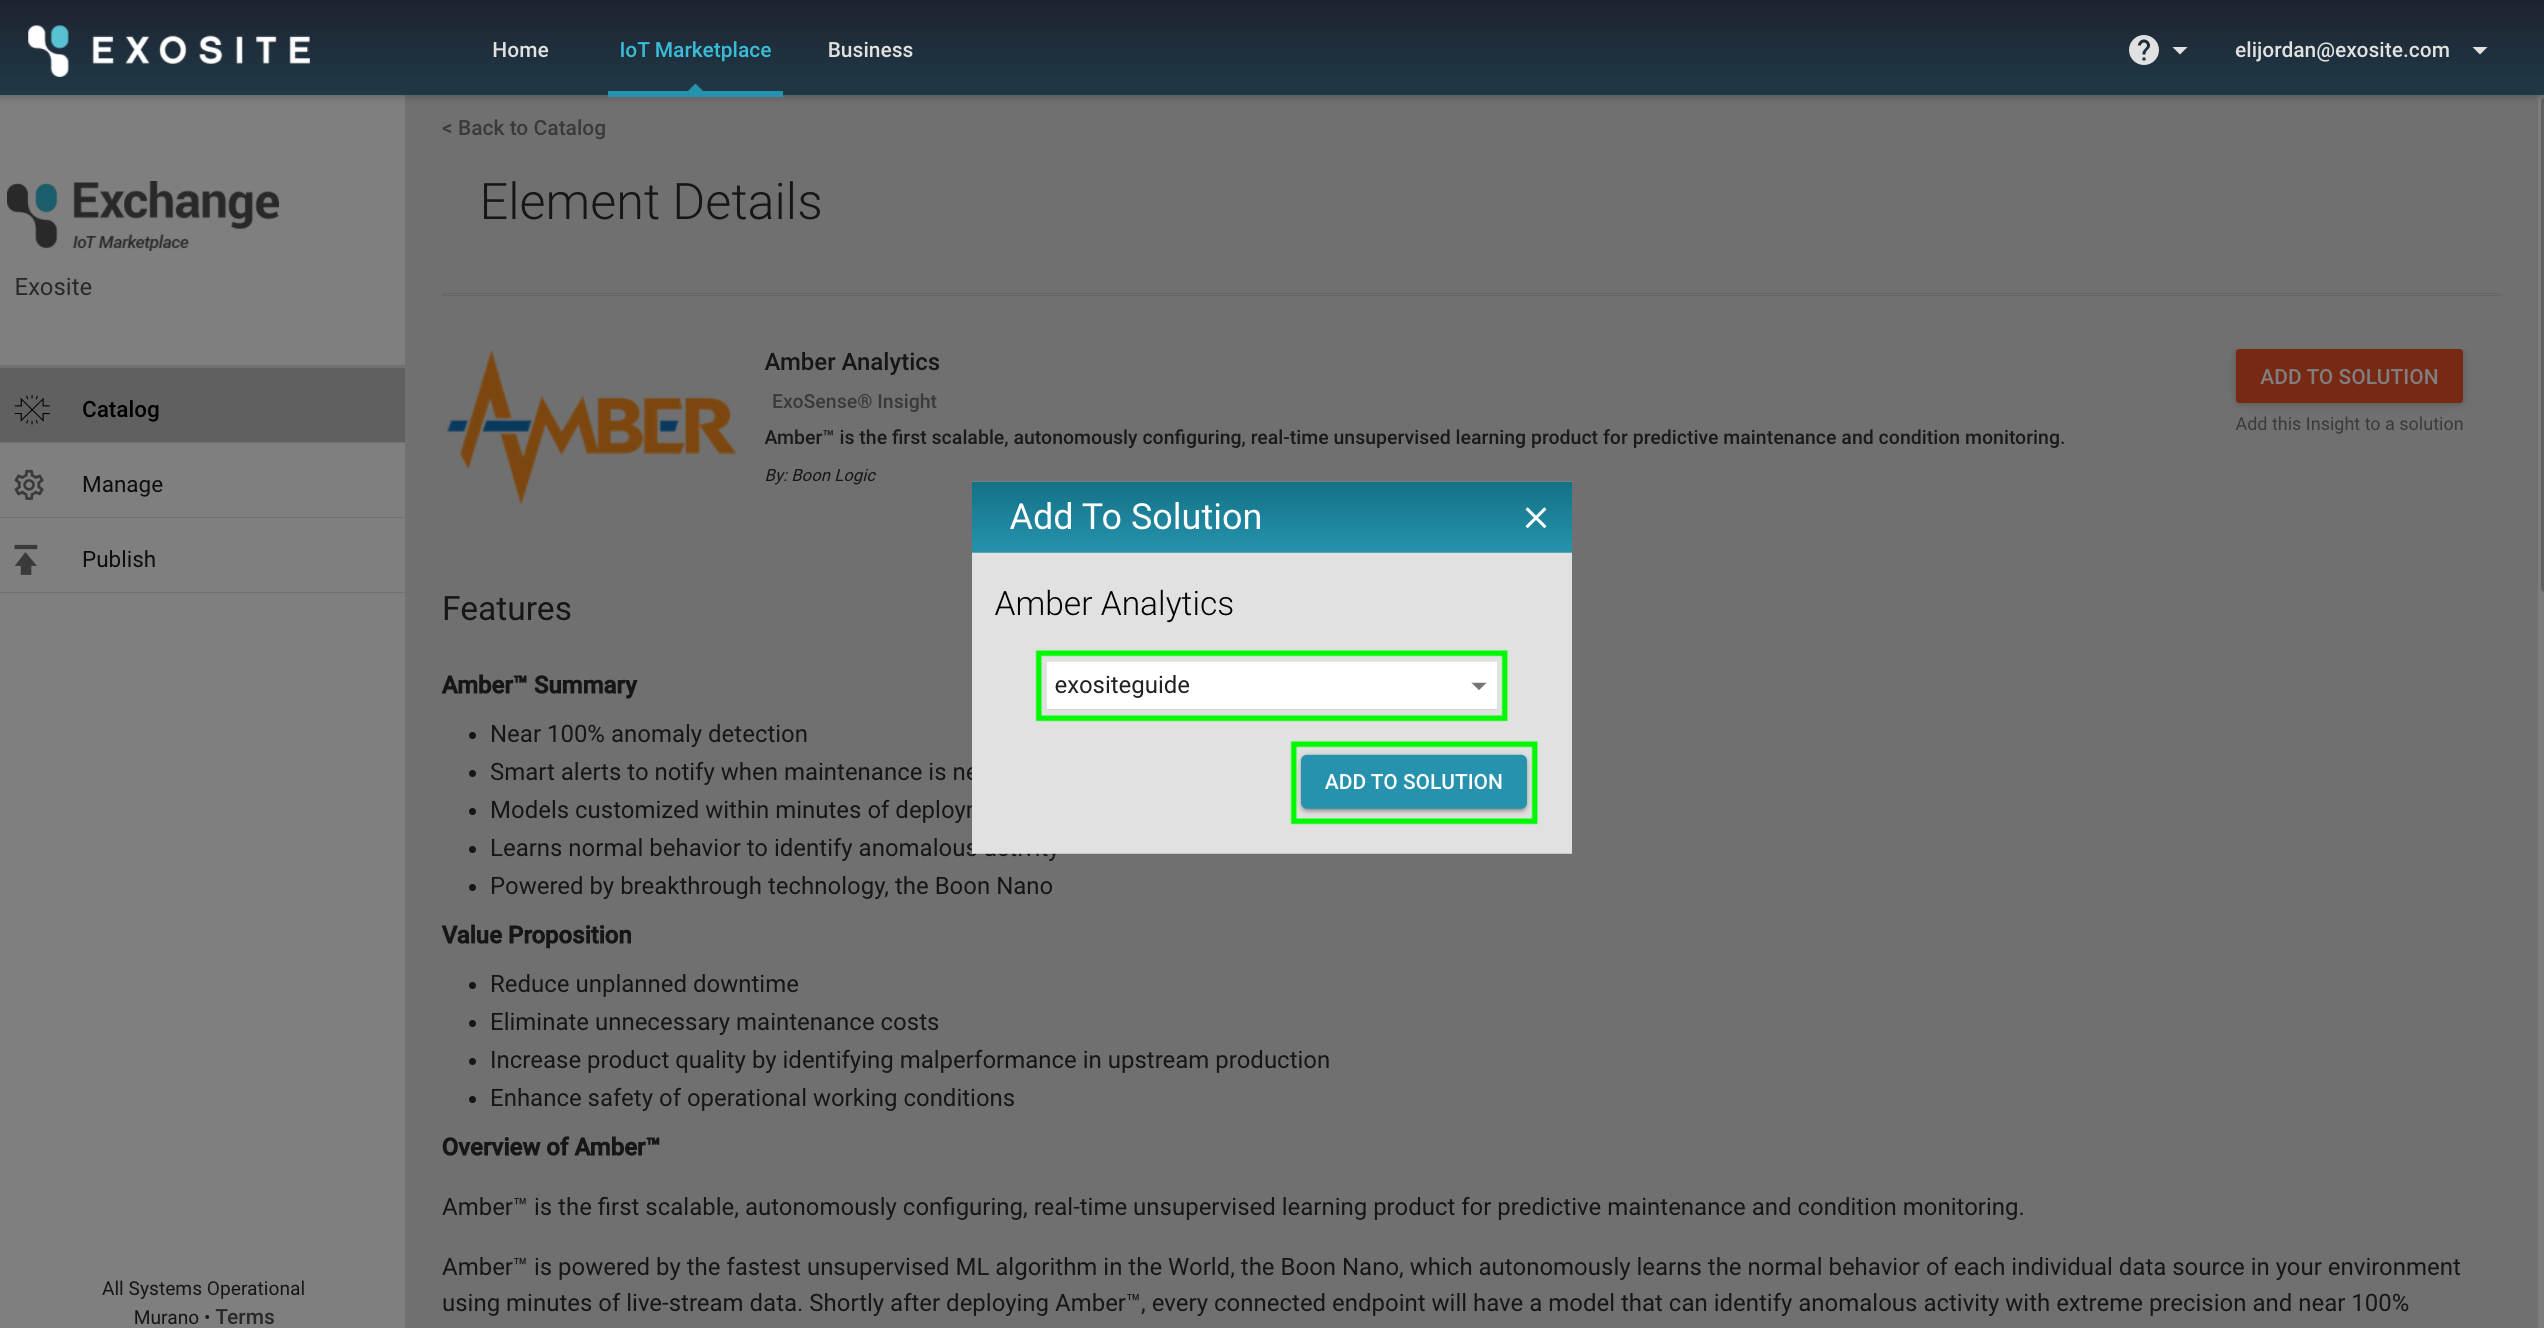
From the element page, click the "Add To Solution" button to add this Insight to your application. A window will pop-up with the Terms of Service, check the box and click "Continue".
This will show a dropdown list of your Murano Solutions with your ExoSense application selected, click "Add To Solution".
At this point, your ExoSense application is ready to use the Amber Analytics Insight!
Add Amber Analytics Insight to ExoSense Asset
Go to the Browse - Group View page and create or select an Asset to modify.
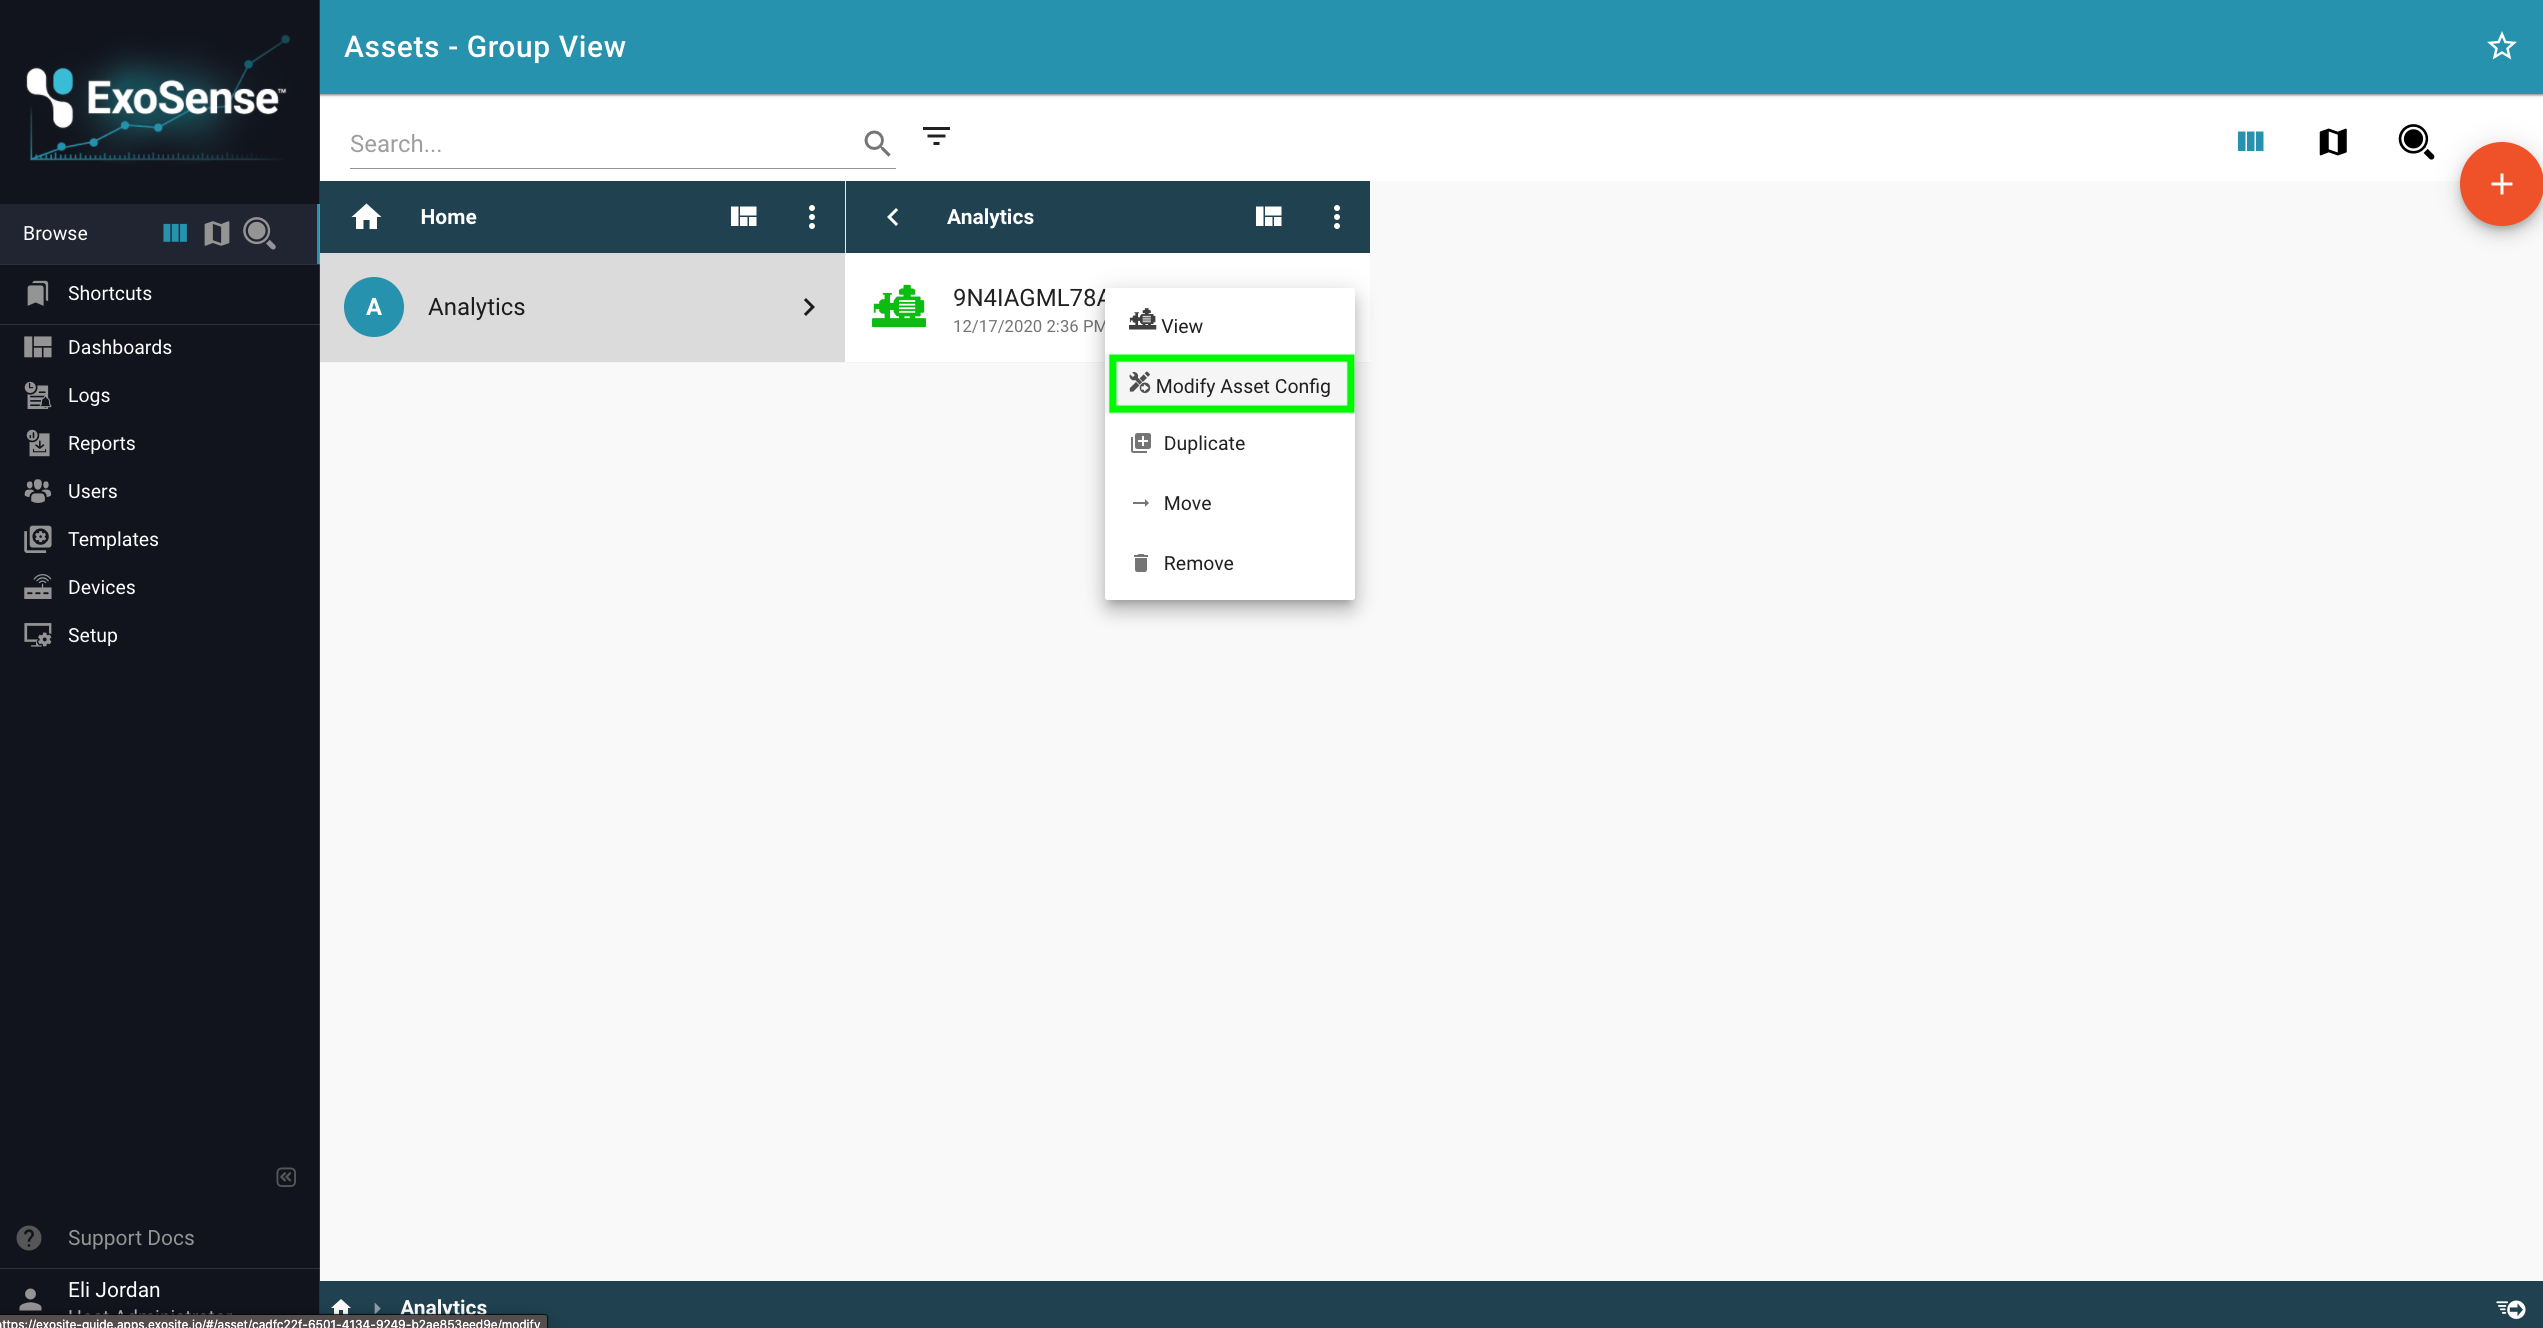
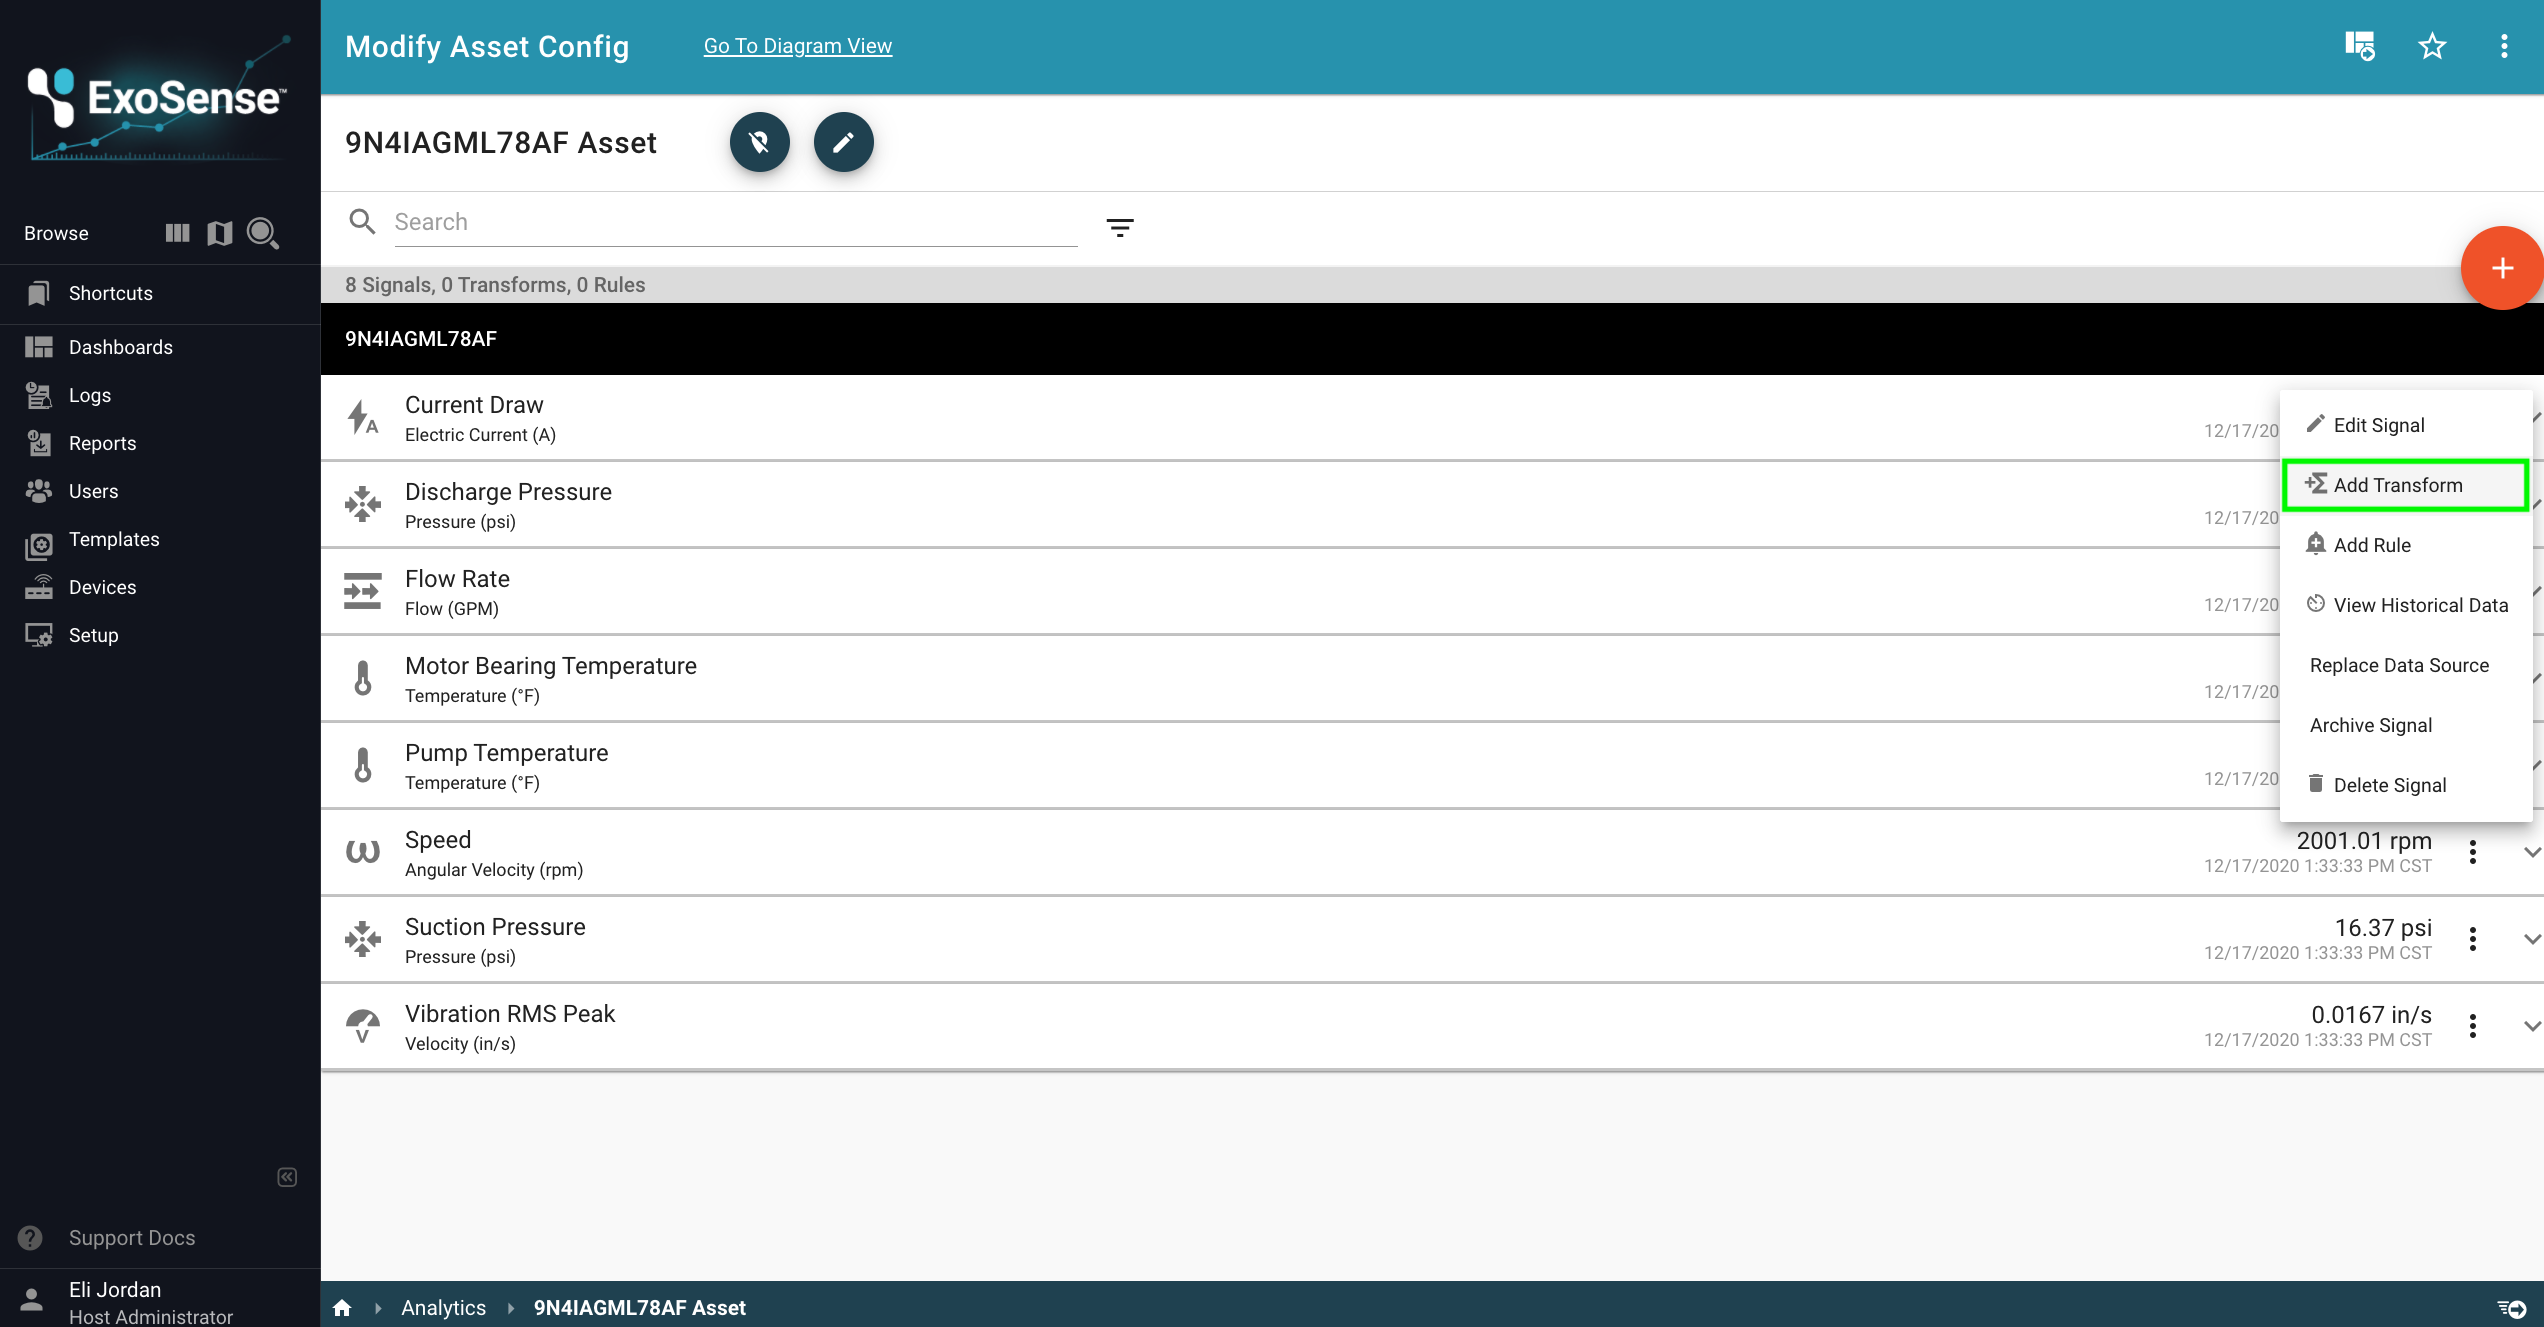
From the Modify Asset page, select a Signal to "Add Transform".
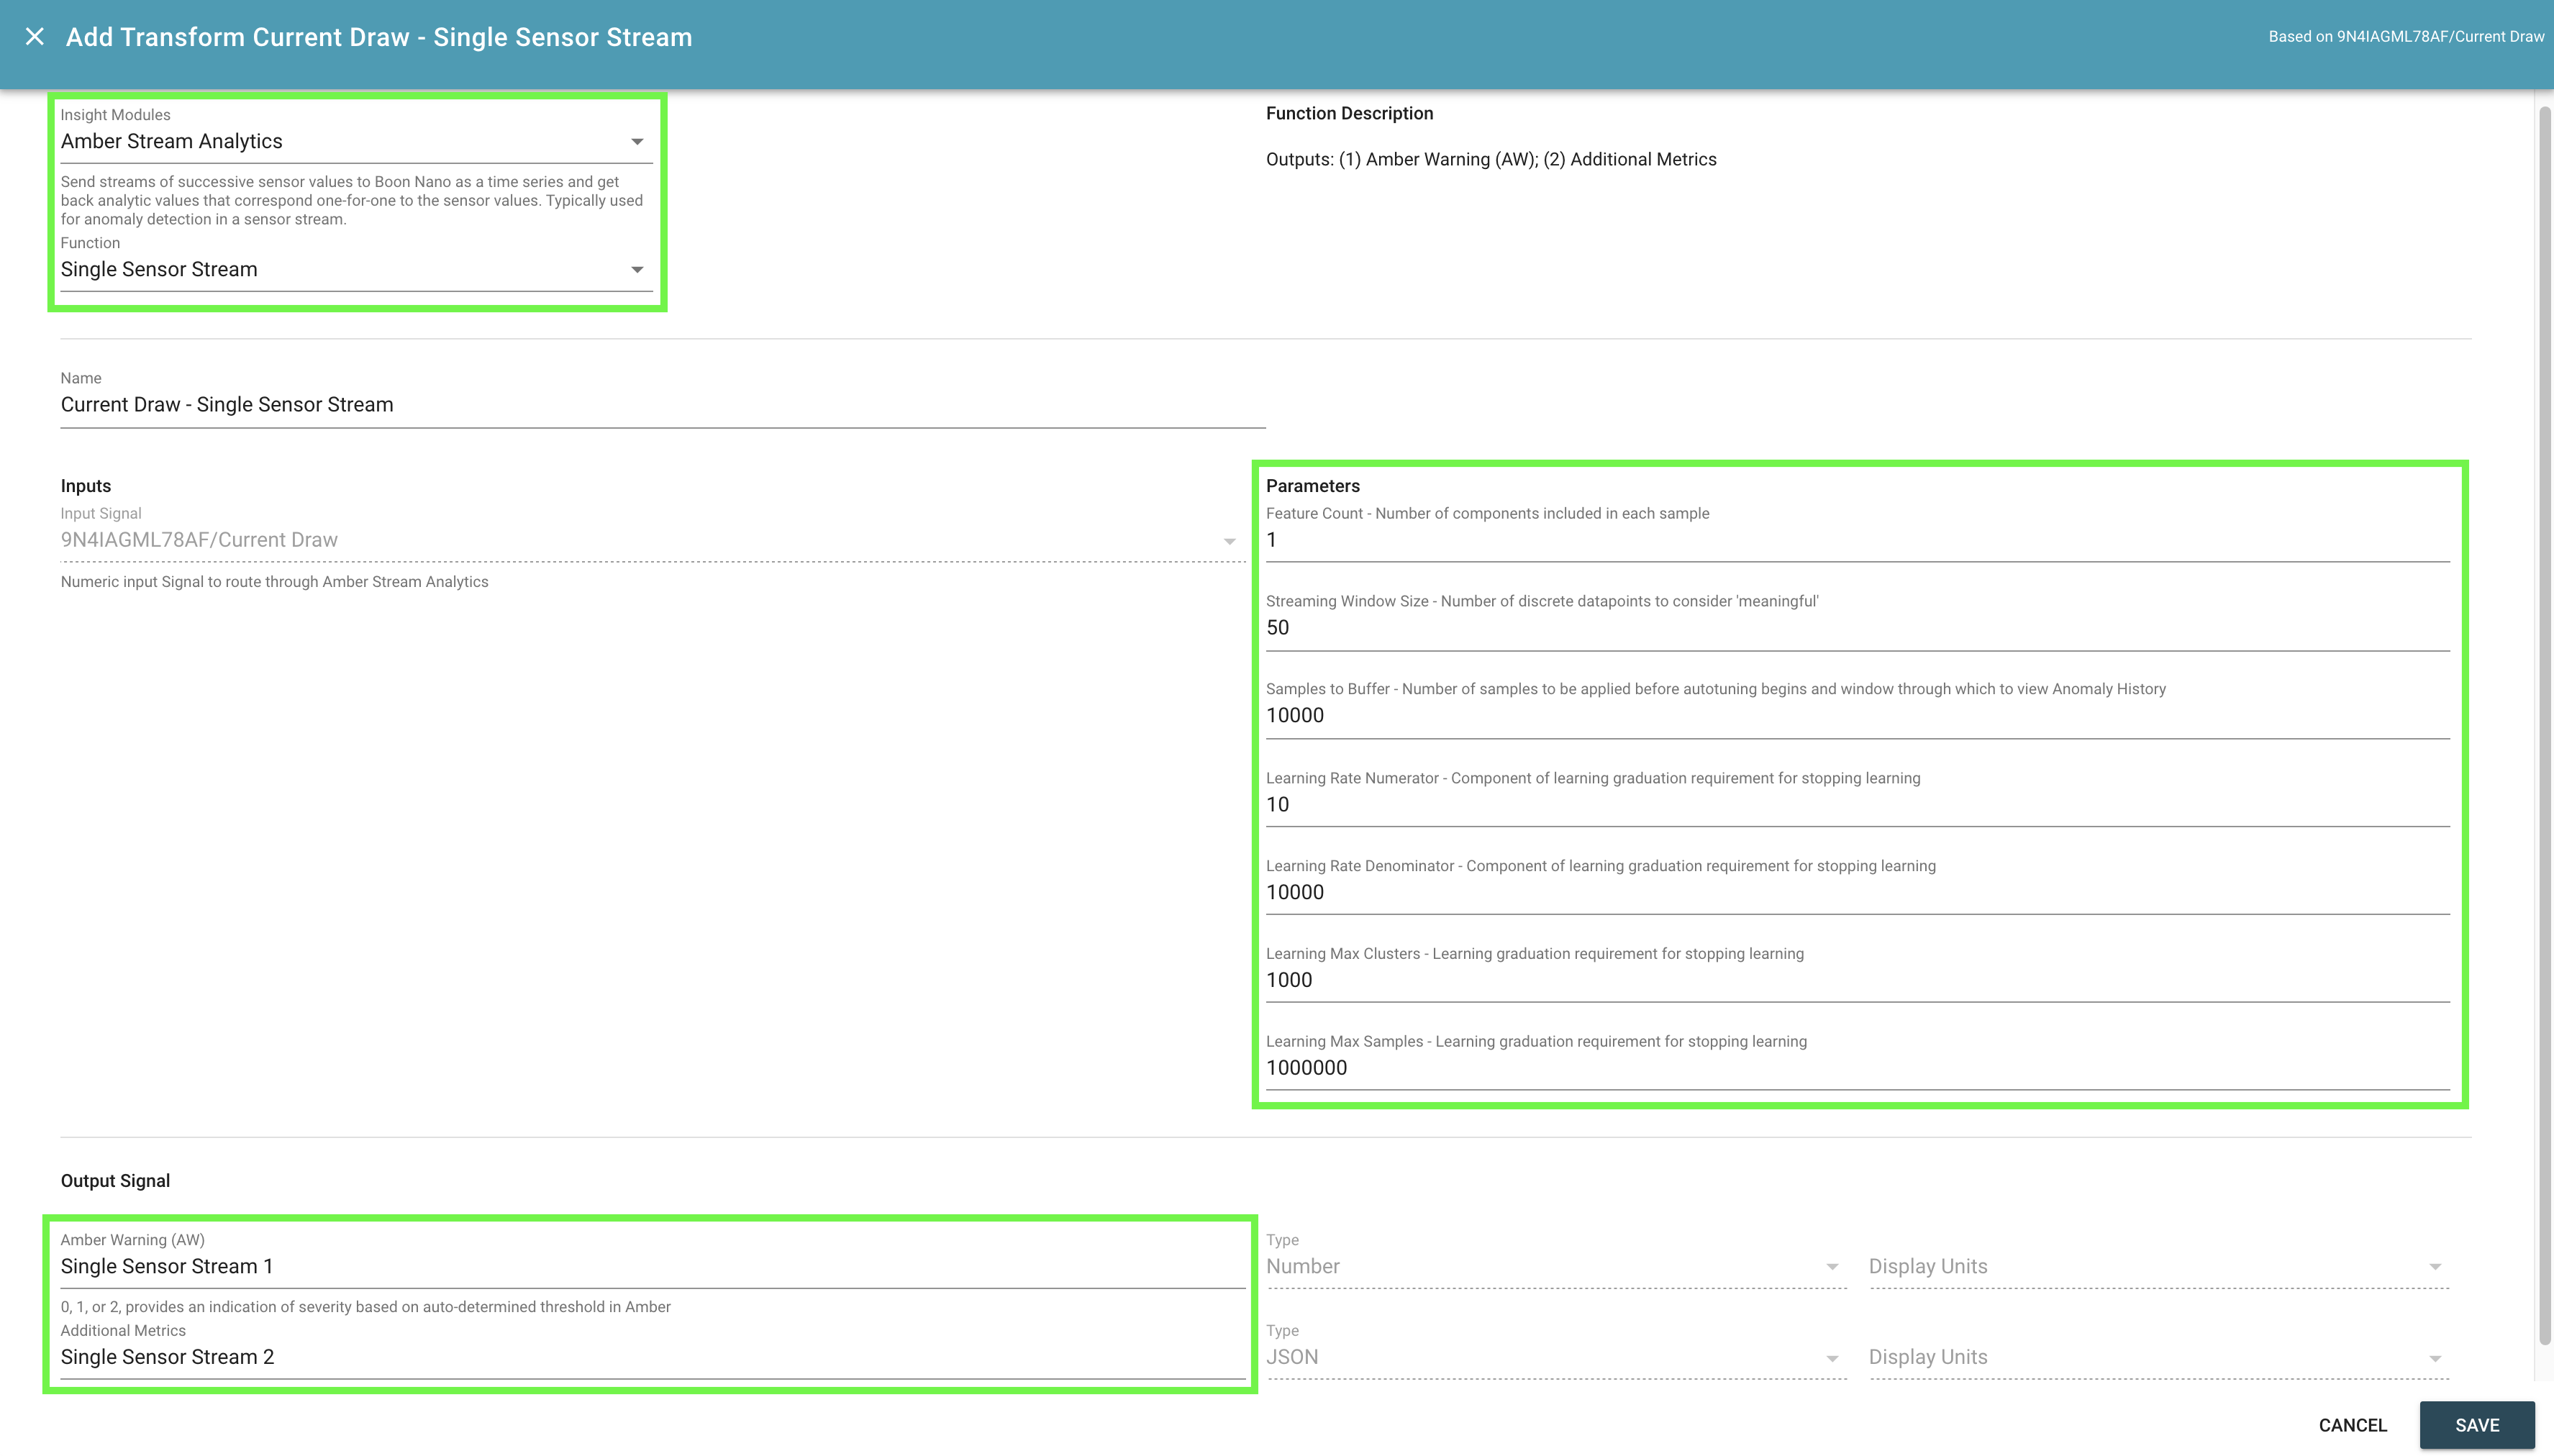
From the Insight Modules dropdown, select "Amber Stream Analytics". From the Function dropdown, select "Single Sensor Stream".
Set the Configuration Parameters to appropriate values for your Asset.
Several new derivative Signals will be created as function outputs. Set names for the Output Signals and click "Save".
The input Signal you used will now filter toward the top of your Asset's Signal list and the attached Transform will have links to the output Signals it is generating, which will be located near the bottom of the list.
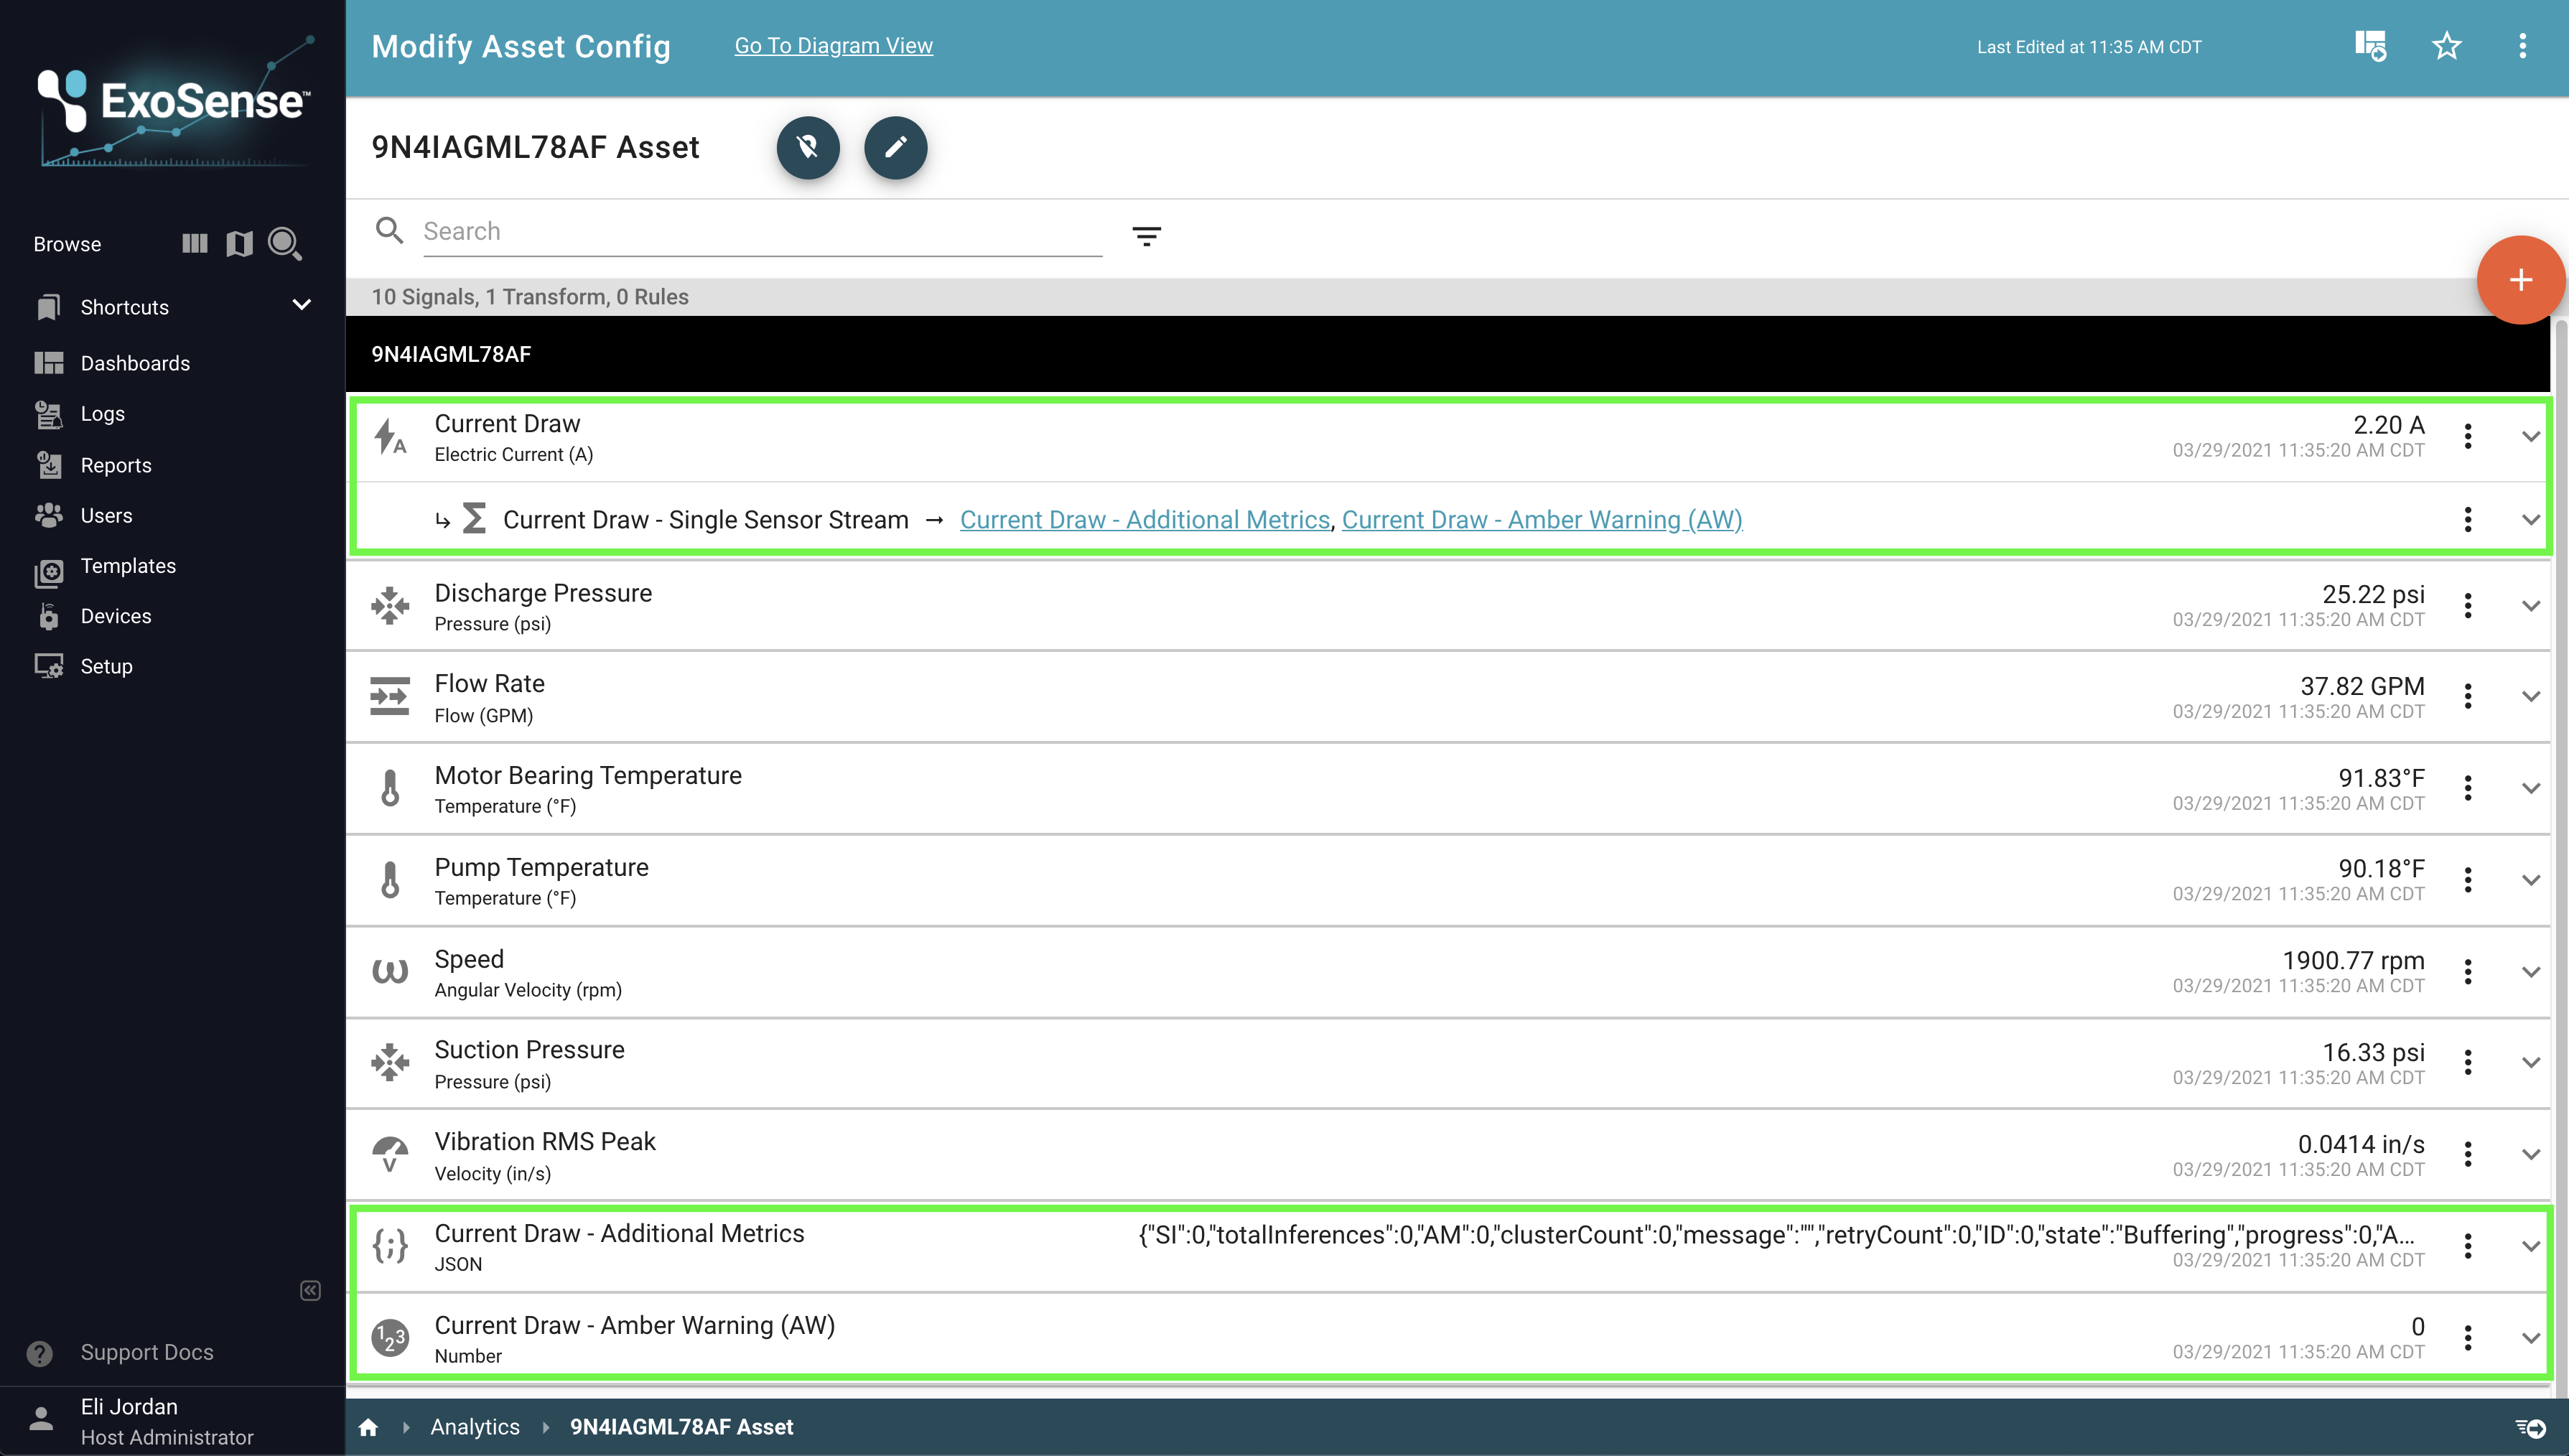
Tips
- You can now edit the properties of these Signals (e.g. to change the "precision" for the integer-type Amber Warning (AW)).
- As noted earlier, you may also consider using Custom Inline Insights to split one or more of the Additional Metrics into their own dedicated Signal stream(s).
Rules and Alerts
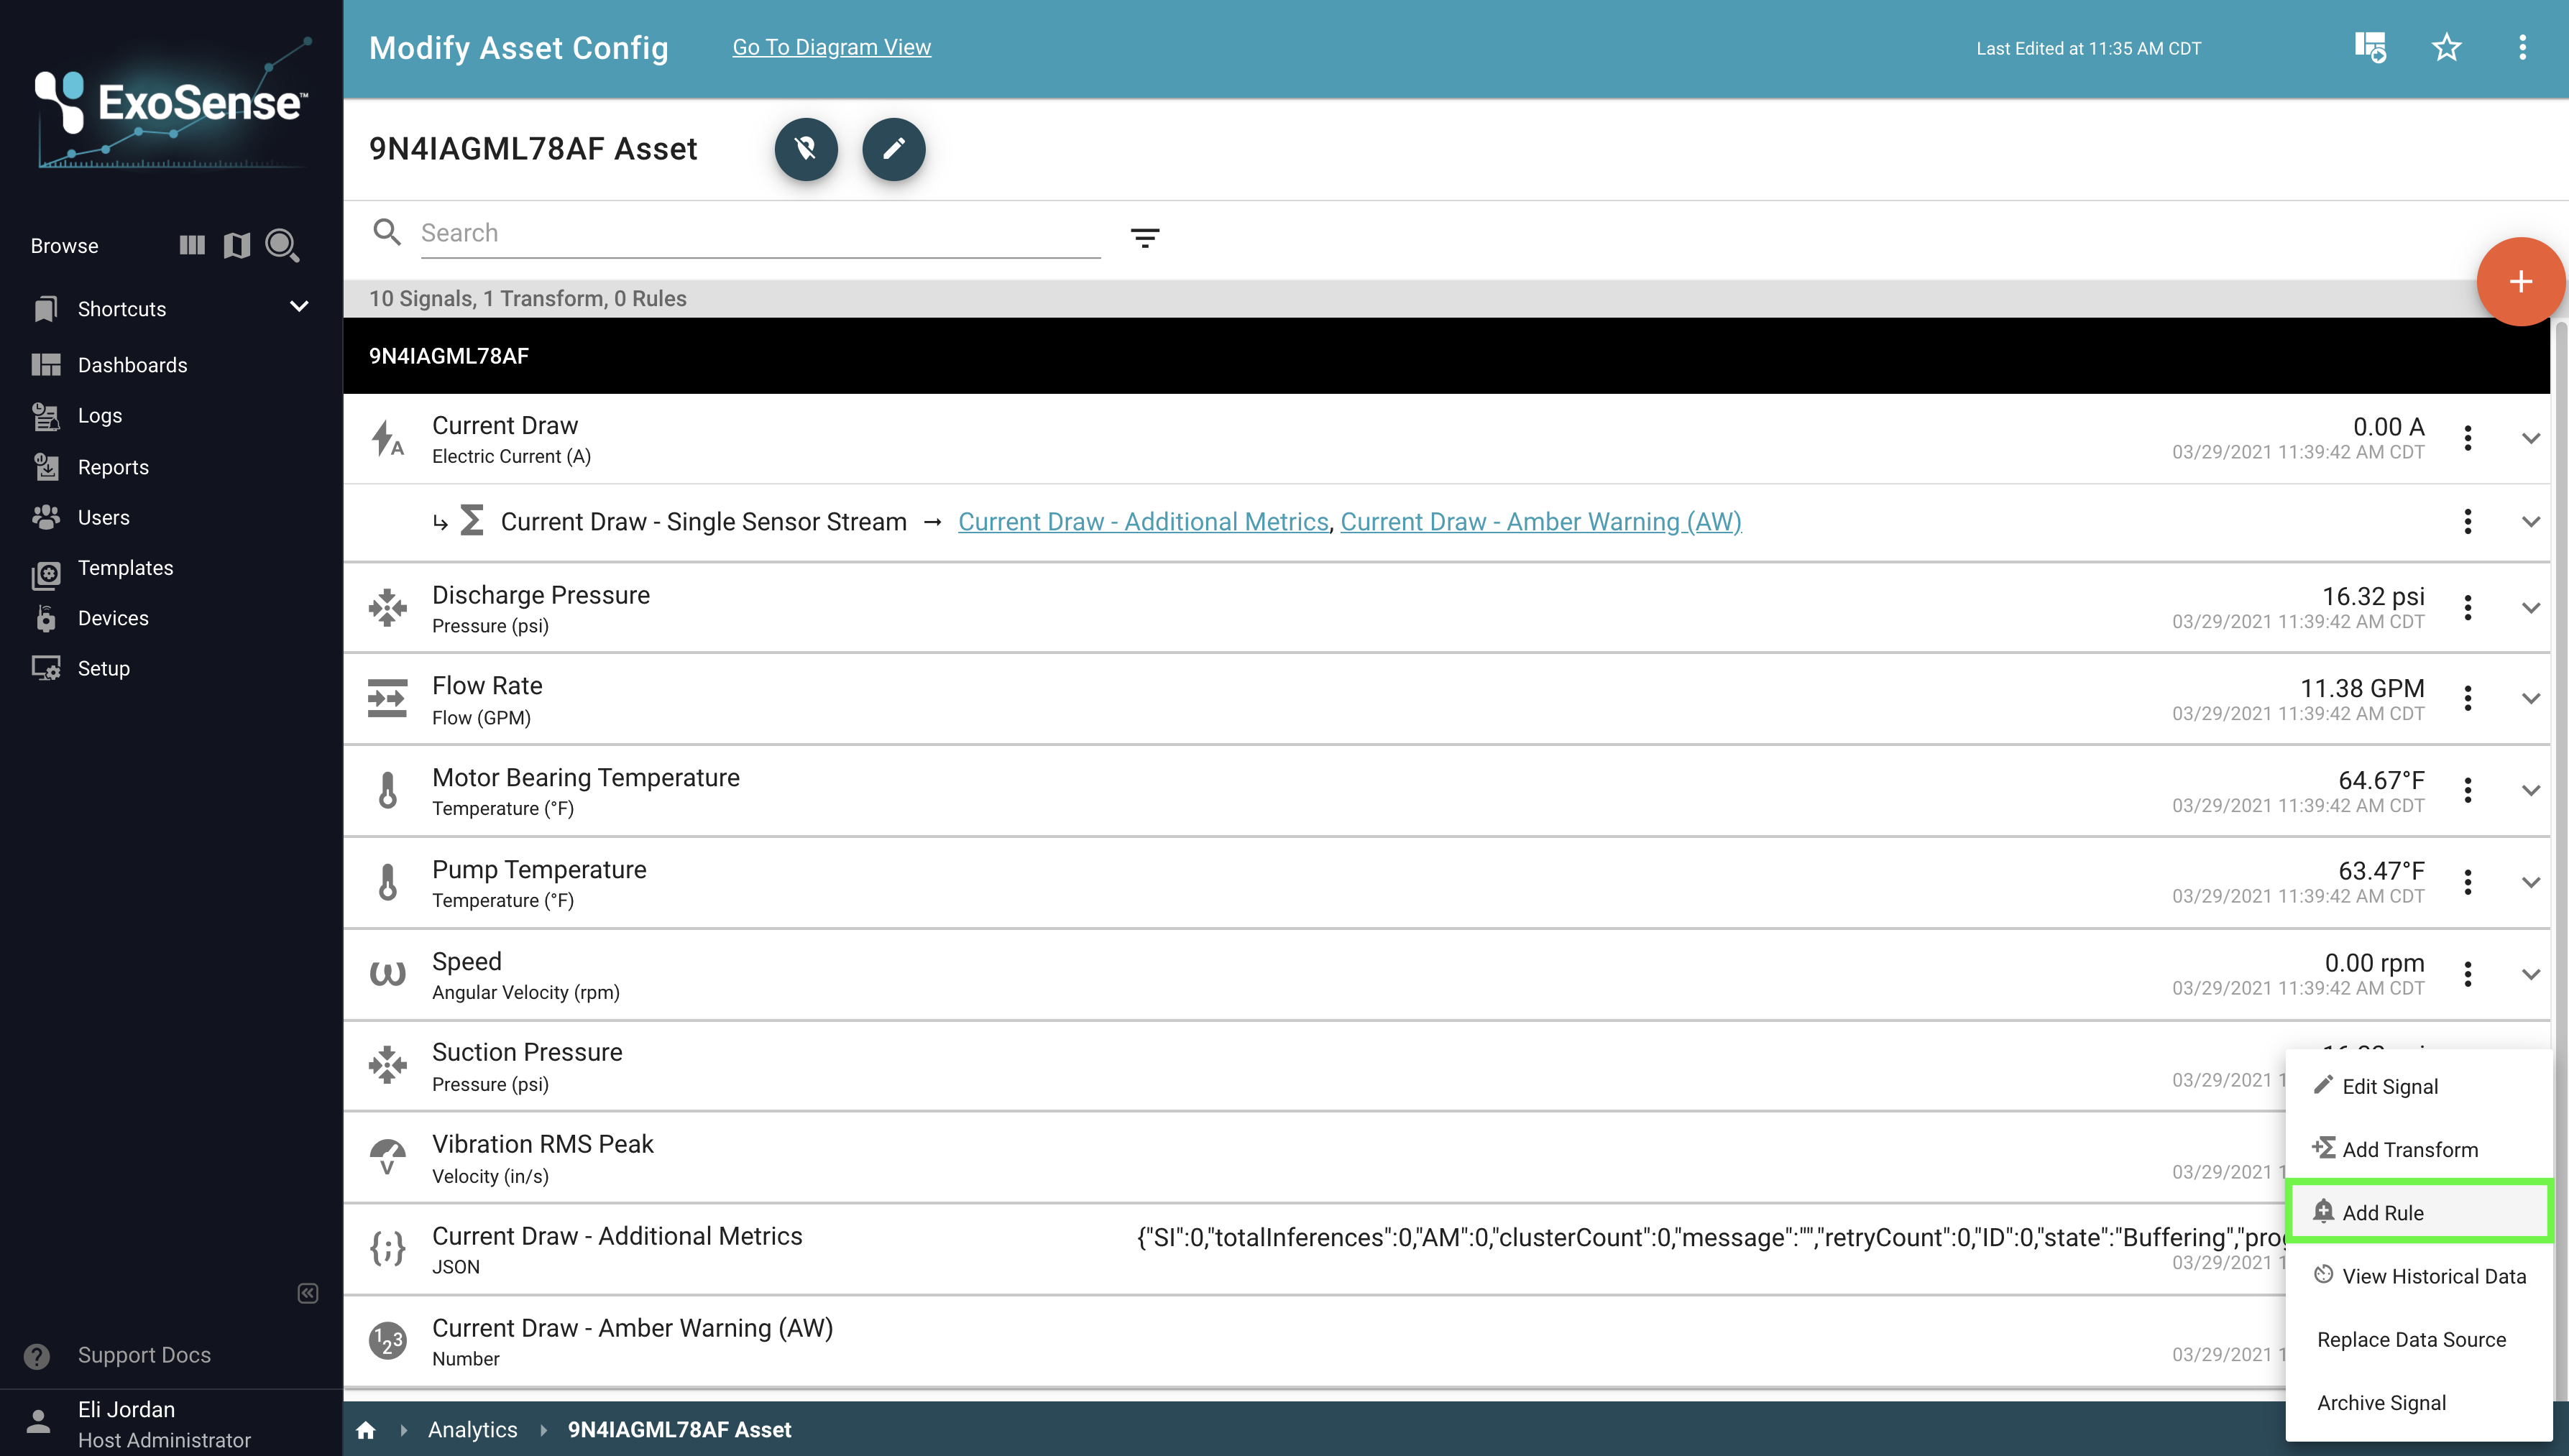
Select the newly created "Amber Warning (AW)" Signal and "Add Rule".
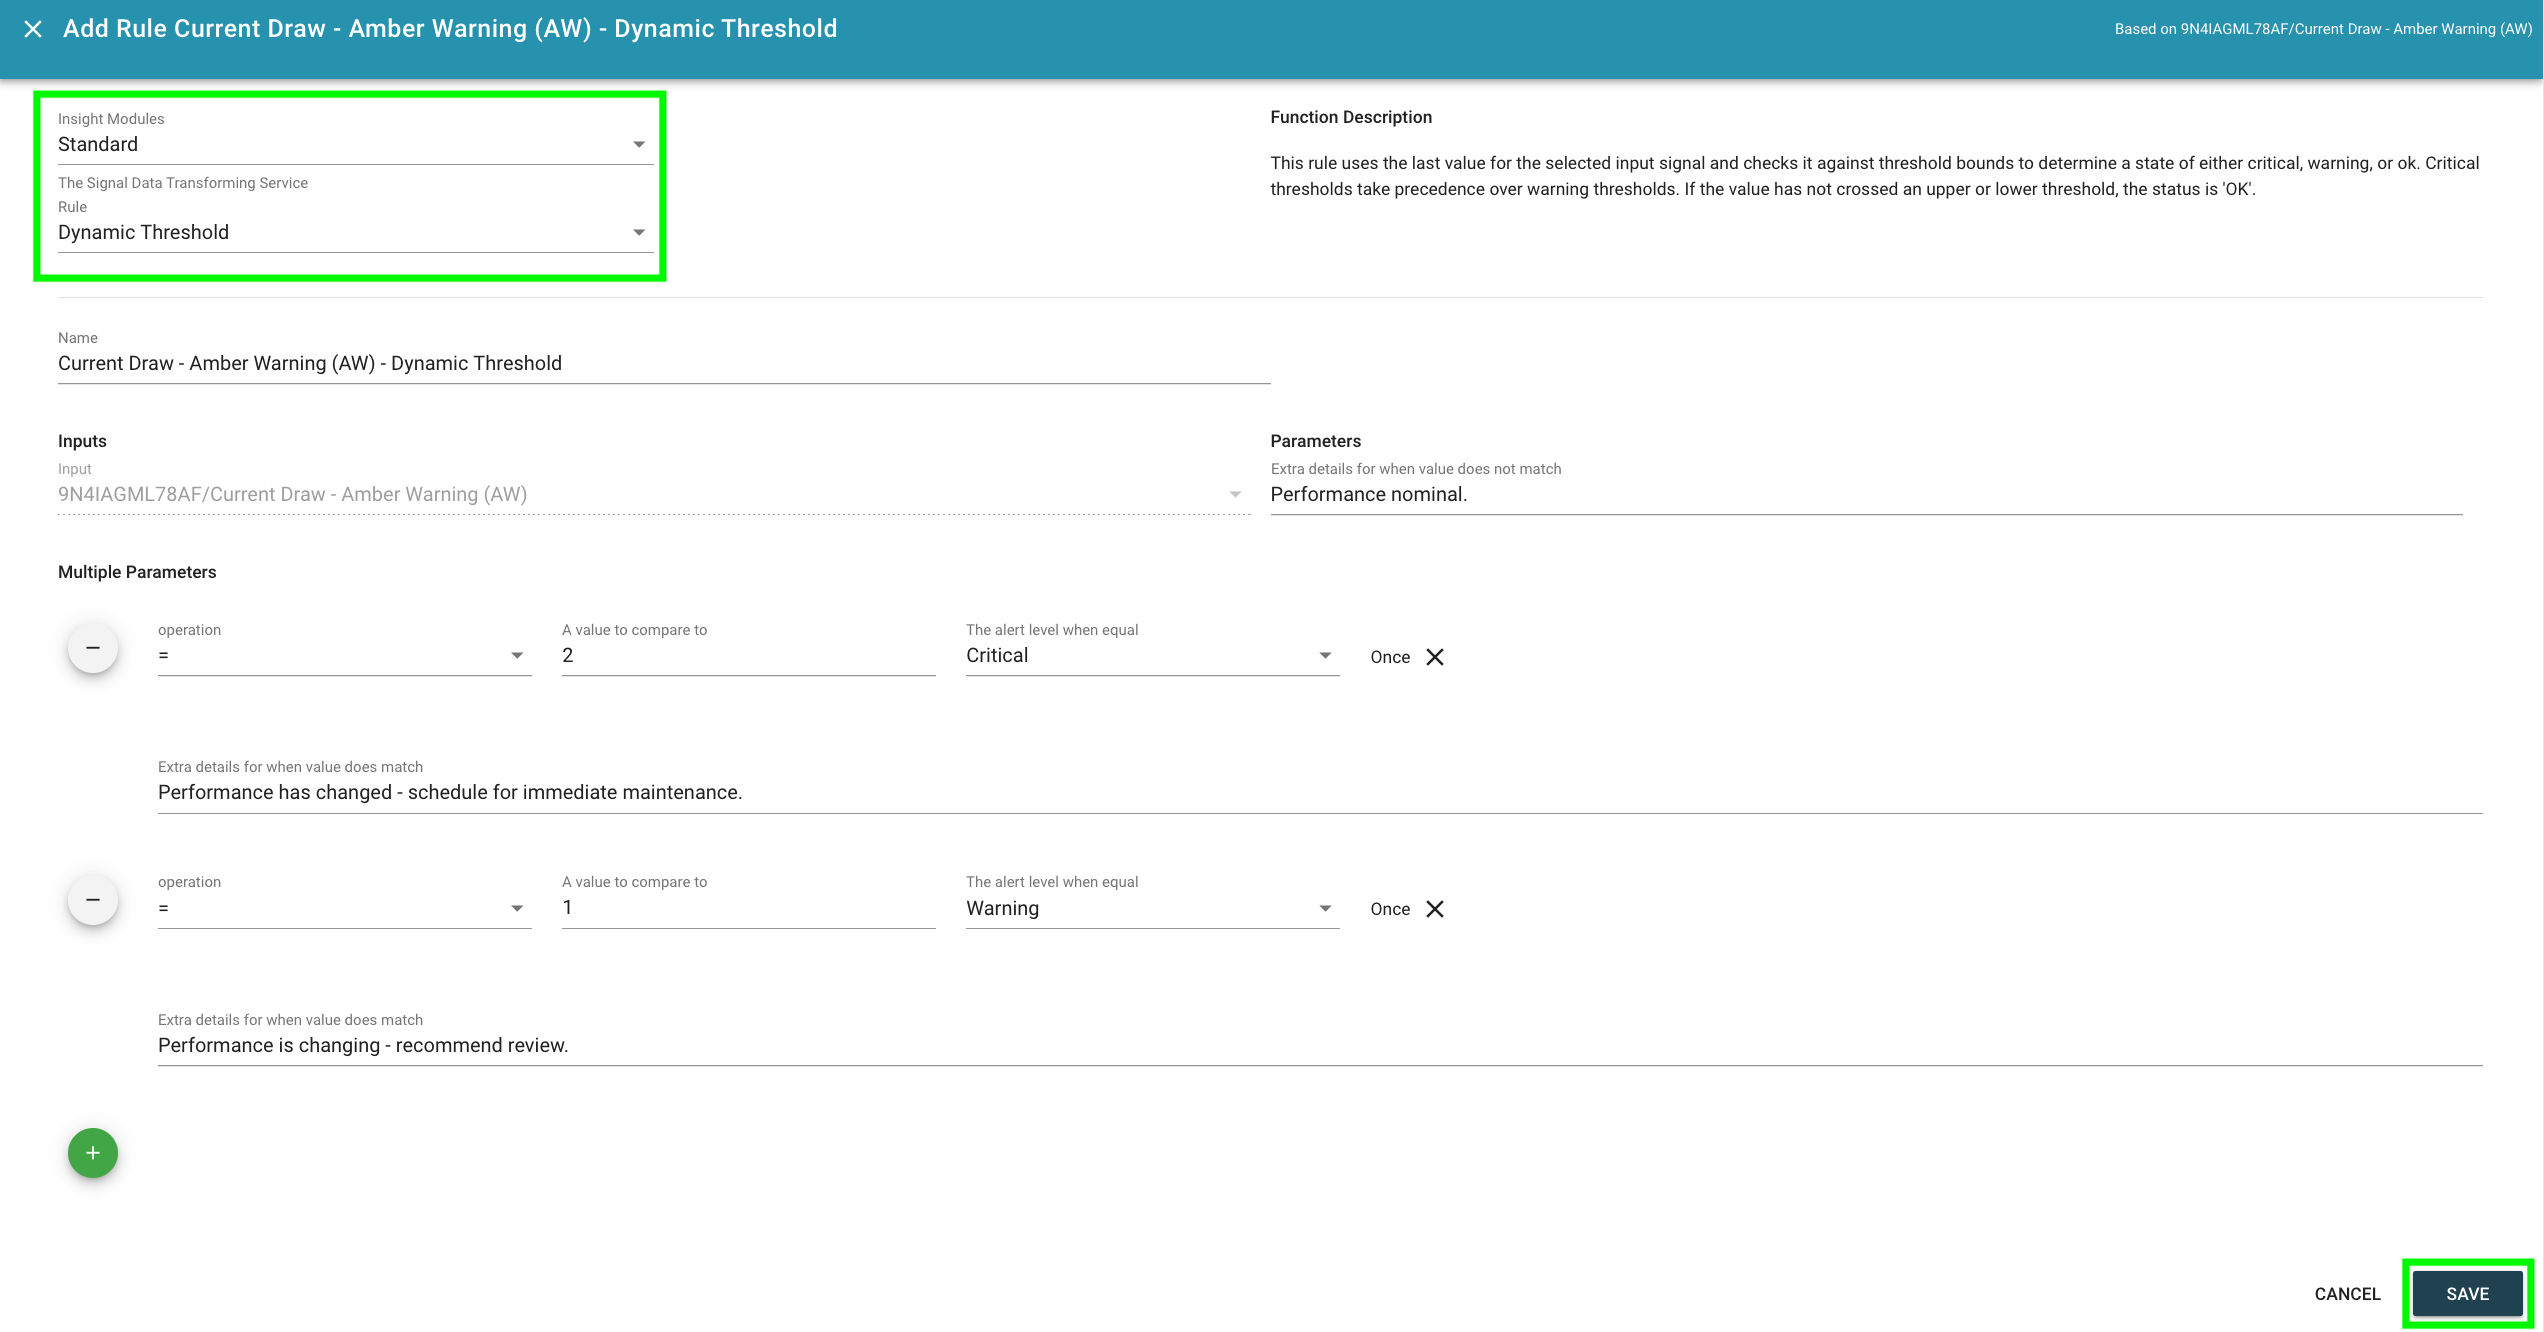
From the "Standard" Insight Module, select the "Dynamic Threshold" Rule and configure it as desired.
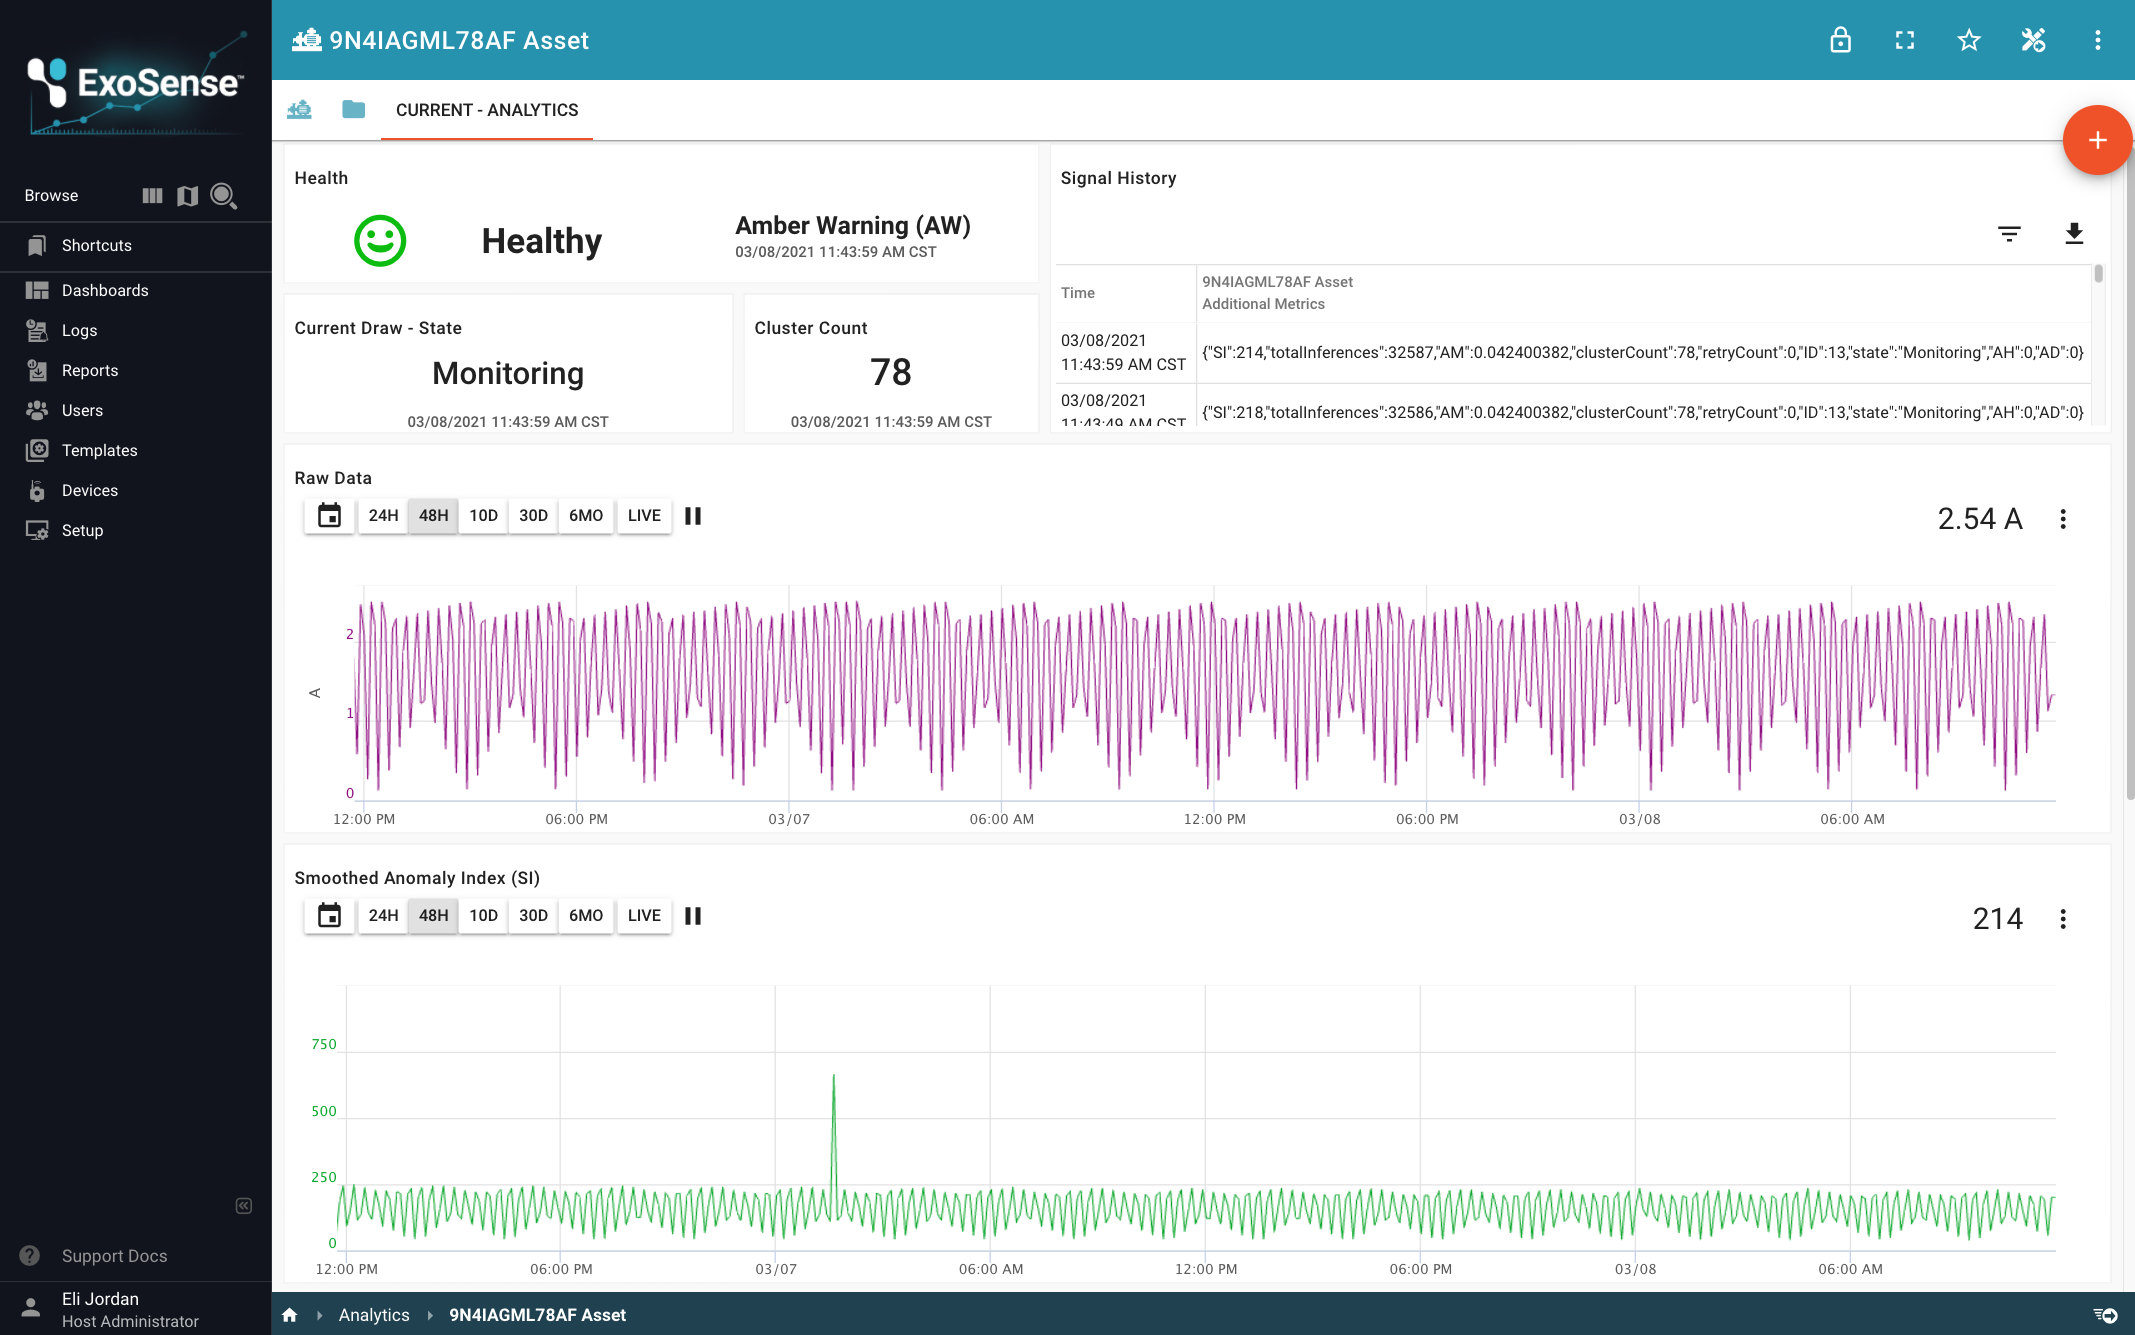
Dashboard Visualization
There are many ways to present data in ExoSense - here is an example showing the Amber Analytics Insight outputs in various ways: